
 ?Mathematical formulae have been encoded as MathML and are displayed in this HTML version using MathJax in order to improve their display. Uncheck the box to turn MathJax off. This feature requires Javascript. Click on a formula to zoom.
ABSTRACT
Ubeji Creek in Niger Delta Region of Nigeria suffers environmental pollution attributable to petroleum exploration. Therefore, this study was undertaken to investigate BTEX (benzene, toluene, ethylbenzene, and xylene) levels in locally sourced staple foods and dietary BTEX exposure of residents of the Creek from consumption of these foods. Fish, shrimps, pawpaw, cassava, pineapple, and bitter leaf were collected quarterly in a year at designated sampling locations along the creek. The food samples were collected, processed and analysed for BTEX using gas chromatography-flame ionisation detection. Dietary exposure assessment for the Ubeji Creek residents due to BTEX in the foods was conducted based on food consumption data from a food frequency questionnaire survey completed by 530 residents. Mean, maximum, and percentiles BTEX dietary exposures were estimated by both probabilistic and deterministic analyses methods using the @RISK® software through a first-order Monte Carlo simulation at 50,000 iterations. The food samples contained BTEX levels with pineapple tissue having the highest concentration (1.35 ± 0.11 mg/kg). Fish and shrimps have the highest consumption rates of about 120 g/person/day and 90 g/person/day, respectively. The deterministic and probabilistic assessments indicated that fish and shrimps were the highest contributors to the intakes of total BTEX compared to other foods. The deterministic and probabilistic analyses of dietary intakes of benzene revealed that total dietary intakes of benzene exceeded benzene oral reference dose (RfDo), minimum risk level (MRL), and maximum permissible risk (MPR) level. This indicates that the residents who consume the studied foods are potentially at risk of BTEX dietary exposure.
1. Introduction
Ingestion is an important pathway for the delivery of many toxicants to the human system. Consequently, food is an important vehicle of environmental contaminants delivery to humans. Some of the environmental toxicants that humans have been exposed to through consumption of contaminated foods include polychlorinated biphenyls PCBs [Citation1–4]; polyaromatic hydrocarbons PAHs [Citation5,Citation6]; tartrazine [Citation7]; methyl mercury [Citation8].
The presence of organic compounds as pollutants in foods are usually very low owing to the volatility of such compound. Notwithstanding, human dietary exposure to volatile organic compounds from the consumption of contaminated food can be significant if a high concentration is present in the food and the food is consumed frequently and/or in large quantities. The BTEX (benzene, toluene, ethylbenzene, and xylenes) are volatile organic compounds that frequently co-occur and are found in petroleum derivatives such as gasoline, and hazardous waste sites. The BTEX compounds are also released by incomplete combustion of organic matter and their other major sources to the environment include vehicle exhaust, exploitation of mineral resources (petroleum mining and refining processes, coke and aluminium production), and other industrial /agricultural production activities. Improper discharge of contaminated industrial effluents and pipeline oil spills/leakages have been identified as one of the sources of BTEX compounds in water bodies [Citation9]. Notable environmental and health impacts arising from exposure to BTEX compounds include habitat alteration of aquatic organisms, contamination of fish, organ irritation, and cancer in humans [Citation10,Citation11]. The most important sources of human BTEX exposure are inhalation from contaminated air, ingestion from contaminated water and food as the experiences are with the residents of Ubeji of the Niger Delta region of Nigeria. This region is renowned for its large deposit of petroleum reserves.
To assess the risk environmental contaminants in food posed to human health, it is expedient to first determine human’s exposure to these contaminants through diet. Therefore, the food contaminant concentration and the food quantity consumed must be known to estimate dietary exposure. Food contaminant concentration can be determined by measurement or model (mathematical predictive methods); while food quantity consumed can be obtained by food surveys. A human health risk assessment is then conducted to predict the likelihood of adverse human effects from the environmental contaminants. Human exposure risk assessment is the systematic scientific characterisation of known or potential adverse health effects of exposures to contaminants or polluted environment [Citation12]. The Joint FAO/WHO Food Standards Programme Codex Committee on contaminants in foods has described exposure assessment and risk characterisation as part of the four key steps in assessing the risk of human exposure to hazardous contaminants such as BTEX or activities leading to contaminants production [Citation13].
Of the four BTEX compounds, benzene is known to be the most toxic [Citation14]. Several deleterious human health conditions have been associated with BTEX exposure. Some of these include irritation of the upper respiratory tract, and aggravation of asthma, leukaemia, and cancer of the bladder, allergies, and neurocognitive defects; just to mention a few [Citation15,Citation16]. However, all the BTEX compounds can cause death at high exposure levels and irritate various parts of the body at low exposure levels [Citation17]. The occurrence of harmful effects following BTEX exposure in humans depends on a variety of factors. These include the amount of BTEX to which the subject was exposed to [Citation18]. Ubeji Creek in the Niger Delta Region of Nigeria suffers environmental pollution attributable to petroleum production activities. This Creek was selected for this study because it is typical of most oil and gas production host creeks of the Niger Delta. The area is densely populated and the people are engaged mainly in fishing, crop farming, vegetable farming, and some petty trading. The residents of the Ubeji community subsist on locally obtained food materials from the creek environment. They consume, as a major portion of their diet; fish and other aquatics organisms caught from the creek and plant materials including fruits and vegetables harvested from the environment. The concern is that there is potential for consumption of BTEX contaminated food by the residents of the Ubeji community due to the notable environmental pollution related to crude oil production activities in the area. The high solubility of BTEX and migration in air and their deposition on plants and soils [Citation19,Citation20] can endanger foods commonly consumed by the inhabitants of Ubeji.
BTEX have high solubility in lipids [Citation21], thus readily absorbed from the environment such as Ubeji creek by freshwater fish. Freshwater fish are commonly consumed by the residents of the Ubeji community. The release of BTEX into the Ubeji creek environment by exploration activities of the petroleum industry and their accumulation into human is associated with incidences of infertility [Citation22]. Different categories of cancers particularly ovarian cancers have been linked to human exposure to BTEX. This necessitated the study of dietary exposure of BTEX in selected foods commonly consumed by the inhabitants of the Ubeji community in the Niger Delta region of Nigeria. As a matter of fact, there is a dearth of information concerning the real exposure of humans and animals to BTEX. Therefore, this study aimed to examine the extent of BTEX contamination in locally sourced staple foods by the residents of the Ubeji community in the Niger Delta region of Nigeria with the ultimate purpose of accessing the human dietary intake level of BTEX through the foods.
2. Materials and methods
2.1 Reagents and solutions
The chemicals used were of analytical grade. Standard BTEX working solutions were prepared from stock BTEX mixed solution of 1000 µg/mL which was obtained from Sigma Aldrich, St. Louis MO, USA). All solutions and standards were prepared using deionised water.
2.2 Study area, sampling and preparation of food materials
Ubeji creek is located in Ekpan in Uwvie local government area of Delta State, Nigeria within longitude 5.54° E and 5.7° W and latitude 5.13° N and 5.6° S. (). Fish, shrimps, and harvested plant materials (cassava, bitter leaf, pineapple, and pawpaw) were locally sourced from the Ubeji Creek community. These food samples were collected once quarterly, from the fourth quarter of 2017 to the fourth quarter of 2018 as available. The food samples were wrapped in aluminium foil and placed in labelled Ziploc bags to prevent contamination. The bags were placed in an ice chest to keep samples at 4°C during their transportation to the laboratory for analysis. A total of 28 food samples were collected for each aquatic animal and plant material during each quarter. The samples were washed properly with deionised water before processing for analysis.
Figure 1. Relative contribution of foods to the total dietary BTEX intake
Food samples were analysed using headspace extraction and gas chromatography-flame ionisation detection (GC-FID) based on the US EPA Methods SW-846/5021 and 8260B [Citation23,Citation24]. Each food sample was washed with deionised water and blended to form a consistent paste using a blender. Homogenized sample of 5.0 g was weighed into a 40 mL vial, followed by adding 5.0 g of anhydrous sodium sulphate and then 10 mL of methanol was added. The vial was sealed and sonicated for 30 minutes. An aliquot of the organic extract was transferred into the headspace vial, sealed, and placed into the headspace auto-sampler for analysis.
2.3 Instrumentation and BTEX analysis
A gas chromatography instrument (HP 5890 Series II) coupled with a flame ionisation detection (GC-FID) equipped with a headspace auto-sampler (HP model 7694) was used to quantify BTEX in the samples. The operating conditions for the GC and auto-sampler are indicated in . Food samples were analysed using headspace extraction and GC-FID based on the US EPA Methods SW-846/5021 and 8260B [Citation23,Citation24]. Food sample was washed with deionised water and blended to form a consistent paste using a blender. Homogenized sample of 5.0 g was weighed into a 40 mL vial, followed by adding 5.0 g of anhydrous sodium sulphate and then 10 mL of methanol was added. The vial was sealed and sonicated for 30 minutes. An aliquot of the organic extract was transferred into the headspace vial, sealed, and placed into headspace auto-sampler for analysis. The BTEX analysis was performed using a gas chromatography-flame ionisation detection GC-FID (with Chemstation Software) equipped with an HP Model 7694 Headspace Auto-sampler. The GC-FID instrument was calibrated before analysis by preparing and injecting dilutions of known concentrations (10–200 µg/L) of BTEX external standard.
Table 1. Instrument settings for the HP 5890 Series II GC and Headspace optimised for BTEX analysis
Data were evaluated using descriptive statistics and one-way ANOVA at α0.05.
2.4 Quality control/quality assurance
The following measures were adopted to ensure the quality of analyses and results obtained in this study:
Sample collection and handling: Food samples were wrapped in foil paper and placed in clean labelled Ziploc bags. All samples were kept in an ice chest and transported to the laboratory at 4°C. Samples were analysed within 7 days after sampling. The samples were washed properly with deionised water before processing for analysis.
Chemicals and Reagent Purity: All chemicals used were of analytical grade. Deionised water was used for all experiments. BTEX mixed standard include benzene, toluene, ethyl benzene, and xylene (Sigma-Aldrich®) was used to calibrate GC-FID. All solvents used were of high-grade purity. All solutions were stored in the dark at 4°C. Working solutions were prepared by dilution of standard stock solution with deionised water. All glass wares and consumables were pre-treated by washing with deionised water and suitable solvent before use.
Validation: Recovery analyses were conducted for four selected food samples to check the accuracy of the analysis. The following selections were based on the original BTEX concentrations in the already analysed samples: Shrimps with the highest BTEX concentration, pawpaw with an average BTEX concentration, fish and cassava with the lowest BTEX concentration were selected. The various concentrations of each working BTEX standard solution spiked into the samples are indicated in . The recoveries obtained ranged from 90.0% and 107%.
To determine Limit of Detection (LOD) and Limit of Quantification (LOQ) solvent blanks were run and standard deviation calculated for six replicate analyses. The LOD was calculated as three times the standard deviation and the Limit of Quantification (LOQ) was calculated as ten times the standard deviation [Citation25–27]. The Limit of Detection (LOD) obtained was 0.001 mg/kg while the LOQ was 0.003 mg/kg.
Table 2. Recovery analysis for BTEX determination in biota
2.5 Respondent recruitment and food consumption data collection
A total of 530 respondents from the study area; aged 5–65 years (including 240 females and 290 males) were recruited within the Ekpan community for the survey. The following inclusion criteria were used to ensure that the participants were representative of the community:
The homes of the respondents were restricted to within 2 km from the selected catchment area of the creek where the biota samples were collected. This is to ensure that the individuals are not far from the geographical location where biota are located/sampled and thus reduce or eliminate any uncertainties of consumption of the biota.
To be eligible, an individual had to have resided in the household greater than 6 months at a time during the last 12 months and within the age range of 5–70 years.
The households were contacted with the help of the local community guards to explain eligibility/consent information and solicit their participation in the study. Each participant completed the questionnaire and/or was interviewed to provide personal biodata (including age, gender, weight, lifestyle habits, health status, etc.) and dietary information on consumption of selected foods for the study.
A food frequency questionnaire (FFQ) containing the sampled staple foods (locally caught aquatic organism and harvested plant materials) from the environment was used to generate food consumption data from residents of households within the settlement of the creek. The FFQ used in this study was adapted from the extensively used and validated European Prospective Investigation into Cancer and Nutrition Norfolk Food Frequency Questionnaire (EPIC-Norfolk FFQ) [Citation28].
2.5.1 Human BTEX dietary exposure
A combination of food consumption data and food BTEX concentration was used to compute human BTEX dietary exposure. Human BTEX dietary exposure was calculated as follows (Equation A) [Citation29,Citation30]:
2.5.2 Estimation of daily food intake and target hazard quotient (THQ)
The daily food intake rate in kg/kg bw/day for each food was calculated from consumed food quantities reported by each respondent in the administered FFQ [Citation29,Citation30]. The life time average daily dose (LADD) and the target hazard quotient (THQ) for BTEX from consumption of the contaminated foods were then determined using EquationEquations (I(I)
(I) to EquationIII
(III)
(III) ). The THQ derived by US EPA is used to estimate potential adverse health-related risks due to prolonged exposure to chemical pollutants [Citation31].
where THQ is Target Hazard Quotient; LADD is Lifetime Average Daily Dose (mg/kg/day); RfDo is oral Reference Dose (mg/kg bw/day); CEXP is concentration of BTEX in food (mg/kg); FIR is food ingestion rate (kg/person/day); ED is exposure duration (days); BW is average body weight of population (kg); and LT is life time (days) [Citation32–34]. Total THQ is considered as an arithmetic sum of the individual analyte THQ values. Hence, total THQ (i.e. THQ (BTEX)) was calculated by summing the individual THQ obtained for benzene, toluene, ethylbenzene, and xylene as shown in Equationequation (III)(III)
(III) . The summary of assumptions for THQ calculation in this study is shown in .
Table 3. Summary of assumptions for THQ calculation in this study
Table 4. The BTEX concentration (mg/kg) of biota samples
Table 5. THQ and EDIb of BTEX from consumption of contaminated foods in Ubeji Creek
2.5.3 Deterministic and probabilistic risk analysis
The BTEX dietary exposure was estimated by the deterministic and probabilistic risk analysis methods. All analyses were performed using the @RISK (for excel Palisade corporation, version 7.6) software. In the deterministic analysis, the mean concentration of BTEX in the foods was multiplied by each of the mean, maximum, and percentiles (50th, 95th, and 99th) food intakes (kg/kg bw/day). The results obtained were compared with the reference limits. In the probabilistic analysis, both concentration and food consumption data were fitted to statistical distributions using the @Risk software. The mean, maximum, and percentiles (50th, 95th, and 99th) of the food consumption and BTEX concentration data obtained from the best fit distributions were used to execute the BTEX dietary exposure analysis. The @Risk software was0 used through a first-order Monte Carlo simulation at 50,000 iterations to estimate mean, maximum, and percentiles (50th, 95th, and 99th) of both food consumption and BTEX concentrations. The respective mean, maximum, and percentiles (50th, 95th, and 99th) dietary BTEX intakes were then calculated. The probabilistic method provides more accurate and detailed analysis than the deterministic method.
3 Results and discussion
3.1 BTEX concentrations in food samples from Ubeji Creek
The analysed fish, shrimps, pawpaw, pineapple, bitter leaf, and cassava samples from the study area contained certain levels of BTEX; with pineapple tissue having the highest concentration of 1.35 ± 0.11 mg/kg. The BTEX concentrations of food samples analysed are shown in . The fish (Sardinella eba) and shrimps (Macrobrachium macrobrachion) analysed in this current study are economically important species with a high consumption rate by the people of the study area. These species are the most common species consumed by the people in the community. The average food consumption rate for fish and shrimps is about 120 g/person/day and 90 g/person/day respectively.
Results of recovery analysis for respective food samples are presented in . Recoveries of fish, shrimps, cassava, and pawpaw BTEX averaged 90.0%, 91.0%, 89.0%, and 107% respectively.
The ATSDR/WHO oral Tolerable Daily Intake (TDI) values for benzene, toluene, ethylbenzene and xylene are 0.005, 0.223, 0.0971 and 0.179 mg/kg/day, respectively [Citation35,Citation36]. A comparison of the ATSDR/WHO oral TDI values with the daily BTEX intake rate through the consumption of the contaminated foods from Ubeji Creek in this current study indicates that the daily intake rate of BTEX in Ubeji Creek is below the ATSDR/WHO oral TDI values (). This suggests that the daily intake rate of BTEX in Ubeji Creek is within the safe margin established by the ATSDR/WHO safe daily intake levels for BTEX.
3.1 Target hazard quotient (THQ)
The THQ is a ratio of the measured concentrations of BTEX in the food and the US EPA oral reference dose (RfDo) of the BTEX taking into account the duration of exposure, amount ingested, and body weight. This ratio between the BTEX exposure and the reference dose is used to express non-carcinogenic effects. The US EPA developed the THQ to estimate potential adverse health concerns connected with prolonged exposure to chemical pollutants such as BTEX [Citation31].
When the THQ value is less than 1.0, it implies that the exposed population is safe, or has no obvious risk. A THQ value equal to or greater than the reference dose suggests that the exposed population is likely to experience health risk from exposure to BTEX. On the other hand, when the THQ value is greater than 1.0, it implies that intake of the contaminated food may have an obvious harmful effect on the exposed population. The higher the THQ value, the higher the probability of the hazard risk on the population [Citation31]. The RfDo values for benzene, toluene, ethylbenzene and xylene are 0.004, 0.08, 0.1 and 0.2 mg/kg/day, respectively [Citation37].
There is no report estimating THQ for BTEX from consumption of the studied staple foods from the Ubeji Creek environment. The current study is the first study to estimate THQ for BTEX in the selected staple foods commonly consumed by the households in Ubeji Creek.
shows the population’s estimated THQ and Estimated Daily Intake (EDI) for the individual analyte and the total THQ from consumption of the contaminated foods. The THQ for the individual analyte and total THQ (i.e. BTEX THQ) values through consumption of any of the food analysed in this study are less than 1.0. This is an indication of a low hazardous exposure of the population to BTEX at the current rate of consumption of fish, shrimps, pawpaw, bitter leaf, cassava, and pineapple. The low probability of health risk for the population, based on THQ values of less than 1.0, does not nullify the fact that the population could still be at risk because these contaminated staple foods are usually consumed in large quantities by the Ubeji creek residents.
There are reports that prolong exposures to even low concentrations of the BTEX monoaromatic compounds can cause adverse effects in humans [Citation38–41]. In other words, the continued consumption of these foods is a possible exposure to BTEX, which may act as a potential risk factor for adverse health conditions for the individual/population of Ubeji creek. Similarly, exposure to BTEX is connected to its bioavailability in environmental matrices. Hence, the importance of conducting BTEX exposure risk assessment for the Ubeji Creek residents exposed to these staple foods.
3.2 Dietary BTEX exposure assessment and estimated food intakes
Studies have demonstrated that dietary practices that incorporate locally sourced foods place community residents at risk for exposure to environmental contaminants. Such studies include polychlorinated biphenyls PCBs exposure from fish consumption of community surrounding the Great Lakes, USA and the St. Lawrence River, Canada [Citation42]; the Akwesasne Mohawk Nation located on the St. Lawrence River [Citation2,Citation43–45]; the Native American communities who due to their culturally-based dietary patterns and subsistence consume more locally caught fish compared to the general population [Citation46–48].
The dwellers of the Ubeji community have dietary practices that depend on locally caught aquatic organisms (especially fish and shrimps) and locally harvested vegetables and fruits, which may place the community residents at risk for exposure to BTEX in the biota. In this current study, the population’s food consumption data was generated from reported food quantities consumed by each respondent in the administered FFQ. The calculated daily food intakes were then analysed with the @Risk software to generate fitted distribution mean, standard deviation, percentiles (50th, 95th, and 99th), maximum and minimum for each food ().
Table 6. Estimated daily usual food intakes for Ubeji Creek population
The mean total food intake was 0.0045 kg/kg bw/day corresponding to about 305 g of food consumed per day for a person of 67.5 kg average weight. However, for the same person, the food intake will be about 500 g of food consumed per day at the 99th percentile (0.0074 kg/kg bw/day). Furthermore, the results presented in indicate that fish and shrimps were the most consumed foods with mean values of 0.0019 kg/kg bw/day (0.0001–0.0037 kg/kg bw/day) and 0.0014 kg/kg bw/day (0.0000–0.0036 kg/kg bw/day) usual daily consumption respectively. On the other hand, the least consumed foods are pawpaw and pineapple with usual mean daily intakes of 0.0003 kg/kg bw/day (0.0000–0.0008 kg/kg bw/day) and 0.0002 kg/kg bw/day (0.0000–0.0008 kg/kg bw/day) respectively. The 99th percentile usual daily consumption was considered in order to cover the highest food intake scenario. In addition, 100% of respondents consumed fish daily, while about 52% of respondents consumed all foods combined daily.
3.2.1 Deterministic analysis for BTEX dietary exposure assessment
The deterministic analysis assessment method was first used to get an overview of the magnitude of the population’s BTEX exposure. The dietary intakes were calculated for each food and then for all foods combined. Fish (36.0%) and shrimps (29.0%) contributed the most; while cassava (4.0%) contributed the least to the intake of total BTEX of all the foods studied (). This high contribution of fish to total dietary BTEX intakes is connected to the high levels of BTEX observed in fish () coupled with the high consumption rate of fish by the people ( and ) compared to other foods.
The results of deterministic analysis of dietary intakes (mg/kg bw/day) of total BTEX and benzene are presented in . The mean dietary intakes of total BTEX is 0.0019 mg/kg bw/day (0.0004–0.0037 mg/kg bw/day). The mean dietary intakes of benzene is 0.001 mg/kg bw/day (0.0002–0.002 mg/kg bw/day).
Table 7. Deterministic analysis results of dietary BTEX intake (mg/kg bw/day)
Table 8. Deterministic analysis results of dietary benzene intake (mg/kg bw/day)
The deterministic analysis results of dietary intakes of benzene () shows that total dietary intakes of benzene at the 50th percentile (0.010 mg/kg bw/day) exceeds benzene oral reference dose (RfDo), minimum risk level (MRL), and maximum permissible risk (MPR) of 0.0040, 0.0050 and 0.0033 mg/kg bw/day, respectively [Citation37,Citation49–51].
Therefore, the deterministic analysis results indicate that a certain part of the population was exceeding the reference limits (RfDo, MRL, and MPR) for benzene; implying that benzene dietary exposures may pose a risk to the residents of the Ubeji Creek. Consequently, further analysis using the probabilistic assessment method was executed to investigate the dietary benzene intakes of the population. This method provides more accurate and detailed analysis than the probabilistic method.
3.2.2 Probabilistic analysis for BTEX dietary exposure assessment
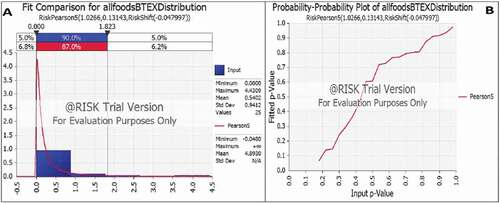
In the probabilistic analysis, the @Risk software was used through a first-order Monte Carlo simulation at 50,000 iterations to determine the mean and percentiles (50th, 95th, and 99th) of food consumption and BTEX concentrations data.The respective mean and percentiles (50th, 95th, and 99th) dietary BTEX intakes were then calculated. The distributions of benzene and BTEX concentrations and food consumption data were used to assess the population’s dietary intakes of the contaminants. The dietary contaminant concentrations and food consumption quantity data for each food were fitted to distributions using the @Risk software; before calculating the dietary intakes of the contaminants. The best fit distributions auto generated by the software and confirmed by the probability-probability (P-P) plot were used for the calculations. Normal distribution was the best fit distribution for food consumption of all foods combined as illustrated in . Exponential distribution was the best fit distribution for benzene concentration in all analysed foods as illustrated in . Pearson 5 was the best fit distribution for total BTEX concentration in all analysed foods as illustrated in .
Figure 2. Probabilistic distribution graph (A) and P-P plot (B) of all foods combined
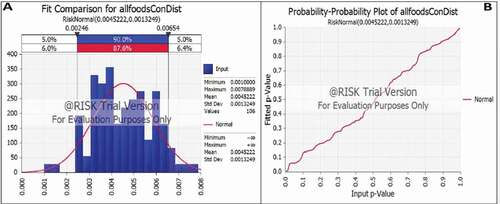
Figure 3. Probabilistic distribution graph (A) and P-P plot (B) of benzene distribution in all analysed foods
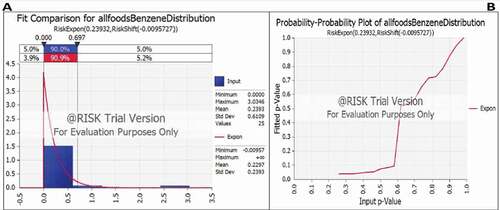
Figure 4. Probabilistic distribution graph (A) and P-P plot (B) of BTEX distribution in all analysed food
The probabilistic average values and percentiles (50th, 95th, and 99th) of food consumption, benzene, and BTEX concentrations were generated from their best fit distributions and used to calculate contaminant dietary intakes for fish, shrimps, and all foods combined (i.e. combination of fish, shrimps, pawpaw, bitter leaf, cassava, and pineapple). The total food (all foods combined; including fish, shrimps, pawpaw, cassava, bitter leaf, and pineapple) consumption was 0.0045 kg/kg bw/day corresponding to about 305 g of food consumed per day for a person of 67.5 kg average weight (). However, for the same person, the food intake will be about 510 g of food consumed per day at the 99th percentile (0.0076 kg/kg bw/day). This high percentile usual daily consumption was considered in order to cover the food intakes of highly exposed persons.
Table 9. Probabilistic analysis results of food consumption (kg/kg bw/day)
The probabilistic analysis results of benzene dietary intakes presented in shows that benzene intakes varied from 0.0010 mg/kg bw/day (mean) to 0.0083 mg/kg bw/day (99th percentile). This result indicates that dietary intakes of benzene at the 99th percentile (0.0083 mg/kg bw/day) exceeds the benzene oral reference dose (0.0040 mg/kg bw/day), MRL (0.0050 mg/kg bw/day) and MPR (0.0033 mg/kg bw/day). The intake of benzene at the 99th percentile (0.0083 mg/kg bw/day) is about two times the oral reference dose or MRL, and two and half times the MPR for benzene. Furthermore, benzene intakes at the 99th percentile reached 0.0033 mg/kg bw/day and 0.0030 mg/kg bw/day through consumption of fish and shrimps respectively. As in the deterministic results, the probabilistic assessment also shows that fish contributed a higher intake of benzene compared to other foods.
Table 10. Probabilistic analysis results of dietary benzene intake (mg/kg bw/day)
It can be remarked from the results, that deterministic dietary benzene intakes () were smaller than the probabilistic intakes (). Probabilistic mean benzene intake value is 0.0010 mg/kg bw/day, while the deterministic value is 0.0009 mg/kg bw/day. A similar trend is observed in the high (95th and 99th) percentiles.
The probabilistic analysis results of total BTEX dietary intakes presented in show that total BTEX intakes varied from 0.0221 mg/kg bw/day (mean) to 0.0869 mg/kg bw/day (99th percentile). The results indicate that the deterministic dietary BTEX intakes () were smaller than the probabilistic intakes (). Probabilistic mean BTEX intake is 0.0221 mg/kg bw/day, while deterministic mean BTEX intake is 0.0019 mg/kg bw/day. Similarly, the probabilistic BTEX intakes at the 95th (0.0154 mg/kg bw/day) and 99th (0.0869 mg/kg bw/day) percentiles are higher than the deterministic BTEX intakes at the 95th (0.0031 mg/kg bw/day) and 99th (0.0035 mg/kg bw/day) percentiles respectively.
Table 11. Probabilistic analysis results of dietary BTEX intake (mg/kg bw/day)
The deterministic and probabilistic analyses confirmed that the highest source of the population’s exposure to dietary BTEX in the Ubeji community is from the consumption of fish and shrimps from the Ubeji Creek. In the same vein, the highest BTEX exposure of the population is from benzene.
Therefore, it can be remarked that the residents of Ubeji Creek who subsist on the studied staple foods (especially fish and shrimps) in this present study may be exposed to some level of risk from dietary BTEX intakes.
4 Conclusions
This current study measured the concentrations of BTEX in locally sourced staple foods from Ubeji Creek. The study further conducted an assessment of the population’s dietary BTEX exposure from the consumption of these staple foods. Preliminary assessment of the population’s dietary BTEX exposure by the deterministic analysis method indicated that some of the population was exceeding the reference limits (RfDo, MRL, and MPR) for benzene. Further analysis by the probabilistic method confirmed that the highest BTEX exposure of the population is from benzene and the high consumption rates of fish and shrimps. The probabilistic analysis result showed that dietary intakes of benzene at the 99th percentile (0.0083 mg/kg bw/day) is about two times the oral reference dose (0.0040 mg/kg bw/day) or MRL (0.0050 mg/kg bw/day) and two and half times the MPR (0.0033 mg/kg bw/day). Consequently, it can be remarked that the residents of Ubeji Creek who subsist on the studied staple foods (especially fish and shrimps) in this present study may be exposed to some level of risk from dietary BTEX intakes.
This study suggests that the locally sourced staple foods from Ubeji Creek are contaminated with BTEX and the resident are at risk of exposure to BTEX from consumption of these contaminated foods. Therefore, there is need for a comprehensive pollution monitoring policy and strict regulatory enforcement of BTEX pollution control in the study area and the Niger Delta in general. Furthermore, we suggest further studies to analyse human bio samples for empirical validation of the obtained probabilistic population’s BTEX exposure and risks. In addition, epidemiological studies to explore associations between exposure of study area residents and certain BTEX related adverse health effects should be conducted.
Disclosure statement
No potential conflict of interest was reported by the author(s).
References
- Kiviranta H, Ovaskainen M-L, Vartiainen T. Market basket study on dietary intake of PCDD/Fs, PCBs, and PBDEs in Finland. Environ Int. 2004;30:923–932.
- Ravenscroft J, Schell LM, Environment ATFOT. Patterns of PCB exposure among Akwesasne adolescents: the role of dietary and inhalation pathways. Environ Int. 2018;121:963–972.
- Schell LM, Hubicki LA, DeCaprio AP, et al. Organochlorines, lead, and mercury in Akwesasne Mohawk youth. Environ Health Perspect. 2003;111:954–961.
- Sirot V, Tard A, Venisseau A, et al. Dietary exposure to polychlorinated dibenzo-p-dioxins, polychlorinated dibenzofurans and polychlorinated biphenyls of the French population: results of the second French total diet study. Chemosphere. 2012;88:492–500.
- Duarte-Salles T, Mendez MA, Morales E, et al. Dietary benzo (a) pyrene and fetal growth: effect modification by vitamin C intake and glutathione S-transferase P1 polymorphism. Environ Int. 2012;45:1–8.
- Labreche F, Goldberg MS, Valois M-F, et al. Postmenopausal breast cancer and occupational exposures. Occup Environ Med. 2010;67:263–269.
- Anisyah F, Nuri A, and Purwiyatno H. Tartrazine exposure assessment by using food frequency method in North Jakarta, Indonesia. Food Nutr Sci. 2011 Jul 5 ;2011.
- Björnberg KA, Vahter M, Grawé KP, et al. Methyl mercury exposure in Swedish women with high fish consumption. SciTotal Environ. 2005;341(1–3):45–52.
- Akinsanya B, Ayanda IO, Onwuka B, et al. Bioaccumulation of BTEX and PAHs in Heterotis niloticus (Actinopterygii) from the Epe Lagoon, Lagos, Nigeria. Heliyon. 2020;6(1):e03272.
- Saunders P, McCoy D, Goldstein R, et al. A review of the public health impacts of unconventional natural gas development. Environ Geochem Health. 2018;40:1–57.
- Yakubu OH. Addressing environmental health problems in Ogoniland through implementation of United Nations environment program recommendations: environmental management strategies. Environments. 2017;4:28.
- Assessment COR, Management R. Risk assessment and management in regulatory decision‐making. DC: US Government Washington; 1997.
- Commision CA. FAO, WHO: discussion paper on benzene in soft drinks. Codex Committee on … 2009.
- Organization W.H. Air quality guidelines for Europe. 2000.
- Rafiee A, Delgado-Saborit JM, Gordi E, et al. Use of urinary biomarkers to characterize occupational exposure to BTEX in healthcare waste autoclave operators. SciTotal Environ. 2018;631:857–865.
- Reid D, McDonald B, Khalid T, et al. Unique microbial-derived volatile organic compounds in portal venous circulation in murine non-alcoholic fatty liver disease. Biochim Biophys Acta Mol Basis Dis. 2016;1862:1337–1344.
- Lucius JE. Physical and chemical properties and health effects of thirty-three toxic organic chemicals. US Geological Survey (No. 87 - 428); 1987.
- Ata Mitra S, Roy P. BTEX: a serious ground-water contaminant. Res J Environ Sci. 2011;5(5):394–398.
- Njobuenwu DO, Amadi SA, Ukpaka PC. Dissolution rate of BTEX contaminants in water. Can J Chem Eng. 2005;83:985–989.
- Varona-Torres E, Carlton DD Jr, Payne B, et al. The characterization of BTEX in variable soil compositions near unconventional oil and gas development, advances in chemical pollution, environmental management and protection, Elsevier. 2017. pp. 321–351.
- Barton C. Benzene. In: Wexler P, editor. Encyclopedia of Toxicology. Third ed. Oxford: Academic Press; 2014. p. 415–418.
- Sirotkin AV. Reproductive effects of oil-related environmental pollutants. In: Nriagu J, editor. Encyclopedia of environmental health. Second ed. Oxford: Elsevier; 2019. p. 493–498.
- Epa U. Method 5021A, volatile organic compounds in various sample matrices using equilibrium headspace analysis. Washington (DC): US EPA; 2003. p. 1–31.
- Techniquea AP. Method 8260B volatile organic compounds by gas chromatography/mass spectrometry (GC/MS). 1996.
- Abbasi F, Pasalari H, Delgado-Saborit JM, et al. Characterization and risk assessment of BTEX in ambient air of a Middle Eastern city. Process SafEnviron Prot. 2020;139:98–105.
- Shabir GA. Step-by-step analytical methods validation and protocol in the quality system compliance industry. J Validation Technol. 2005;10:314–325.
- Thompson M, Ellison SLR, Wood R. Harmonized guidelines for single-laboratory validation of methods of analysis (IUPAC technical report). Pure Appl Chem. 2002;74:835–855.
- Mulligan AA, Luben RN, Bhaniani A, et al. A new tool for converting food frequency questionnaire data into nutrient and food group values: FETA research methods and availability. BMJ Open. 2014;4:e004503.
- Baert K, Francois K, and De Meulenaer B, et al. Risk assessment: a quantitative approach, predictive modeling and risk assessment. Springer, Boston, MA; 2009. p. 19–26.
- Lambe J. The use of food consumption data in assessments of exposure to food chemicals including the application of probabilistic modelling. Proc Nutr Soc. 2002;61:11–18.
- Regulations U.S.E.P.A.O.o.W. Assessing human health risks from chemically contaminated fish and shellfish. A Guidance Manual US Environmental Protection Agency, Washington, DC 20460; 1989.
- Amirah M, Afiza A, Faizal W, et al. Human health risk assessment of metal contamination through consumption of fish. J Environ Pollut Hum Health. 2013;1:1–5.
- Chien L-C, Hung T-C, Choang K-Y, et al. Daily intake of TBT, Cu, Zn, Cd and As for fishermen in Taiwan. SciTotal Environ. 2002;285(1–3):177–185.
- Francis O. Radiographic lumbar spondylosis: gender and age group prevalence in Nigeria. Ann Trop Med Public Health. 2017;10(5):1199.
- ATSDR. Toxicological profile for benzene, US department of health and human services, Public Health Service Atlanta … 2007.
- Organization W.H. Total dissolved solids in Drinking-water. Guideline Drinking Water Qual. 1996;2:0–1.
- Region III E. Risk based concentration table. 2006.
- Ahmed FE. Toxicology and human health effects following exposure to oxygenated or reformulated gasoline. Toxicol Lett. 2001;123(2–3):89–113.
- Bollati V, Baccarelli A, Hou L, et al. Changes in DNA methylation patterns in subjects exposed to low-dose benzene. Cancer Res. 2007;67(3):876–880.
- OEHHA C.E. Public health goal for Methyl Tertiary Butyl Ether (MTBE) in drinking water. California Environmental Protection Agency (Cal EPA), Office of Environmental Health Hazard Assessment (OEHHA), Sacramento, CA. 1999.
- Spitzer HL. An analysis of the health benefits associated with the use of MTBE reformulated gasoline and oxygenated fuels in reducing atmospheric concentrations of selected volatile organic compounds. Risk Anal. 1997;17:683–691.
- Stewart P, Darvill T, Lonky E, et al. Assessment of prenatal exposure to PCBs from maternal consumption of Great Lakes fish: an analysis of PCB pattern and concentration. Environ Res. 1999;80:S87–S96.
- Fitzgerald EF, Hwang S-A, Brix KA, et al. Fish PCB concentrations and consumption patterns among Mohawk women at Akwesasne. J Exposure Anal Environ Epidemiol. 1995;5:1–19.
- Fitzgerald EF, Hwang S-A, Bush B, et al. Fish consumption and breast milk PCB concentrations among Mohawk women at Akwesasne. Am J Epidemiol. 1998;148:164–172.
- Fitzgerald EF, Hwang S-A, Langguth K, et al. Fish consumption and other environmental exposures and their associations with serum PCB concentrations among Mohawk women at Akwesasne. Environ Res. 2004;94:160–170.
- Chan HM, Trifonopoulos M, Ing A, et al. Consumption of freshwater fish in Kahnawake: risks and benefits. Environ Res. 1999;80(2):S213–S222.
- Dellinger JA. Exposure assessment and initial intervention regarding fish consumption of tribal members of the Upper Great Lakes Region in the United States. Environ Res. 2004;95(3):325–340.
- Gerstenberger SL, Gerstenberger S, Dellinger JA, et al. Concentrations and frequencies of polychlorinated biphenyl congeners in a native American population that consumes Great Lakes fish. J Toxicol Clin Toxicol. 2000;38:729–746.
- Atsdr A. Toxicological profile for toluene. USDoHaH Services, editor. Atlanta: US Public Health Service; 2000. p. 1–357.
- Baars A, Theelen R, Janssen P, et al. Re-evaluation of human-toxicological maximum permissible risk levels. RIVM Report 711701 025. National Institute of Public Health and the Environment, Bilthoven, The Netherlands;2001:217–222.
- Substances AFT, Registry D. Toxicological profile for benzene (update). GA: US Department of Health and Human Services Atlanta; 2007.