
ABSTRACT
Purpose
A systematic review was conducted to analyze the inter-rater reliability, cross-informant consistency, test-retest reliability, and temporal stability of the Strengths and Difficulties Questionnaire (SDQ), and its ability to discriminate.
Method
We searched three databases for articles about the SDQ (parent, teacher, and self-report version), used samples of children up to age 18 and reported inter-rater reliability, cross-informant reliability, test-retest reliability, temporal stability, specificity, sensitivity, positive predictive value (PPV), and negative predictive value (NPV).
Results
Focusing on the TDS, inter-rater, and cross-informant reliability showed acceptable values, but respondent types (e.g., mothers and fathers) are not interchangeable. Test-retest reliability and temporal stability were also acceptable, and not excessively high. Specificity and NPV were acceptable but not sensitivity and PPV.
Discussion and Conclusion
Greater transparency is needed about who the respondent is when the term “parents” is used. The SDQ is an important supplement to service-as-usual assessments by social care professionals.
Introduction
Mental health difficulties are common among children in out-of-home care (OHC). About one out of every two children in foster care (Lehmann et al., Citation2013; McIntyre & Keesler, Citation1986; Sawyer et al., Citation2007) and about two out of three children in residential care (González-García et al., Citation2017; Jozefiak et al., Citation2016; Kjelsberg & Nygren, Citation2004; Schmid et al., Citation2008) fulfilled the symptom criteria of at least one mental disorder measured using a standardized screening instrument. The magnitude of symptoms is a strong indicator of need for support, and awareness of this need is a prerequisite for targeted and timely service to children in OHC. Comparisons of the screening ability of standardized psychometric instruments to that of service-as-usual assessments, in which needs are typically assessed by professionals based on others’ concerns and their own qualified observations of the children without the use of standardized screening instruments, show that the former indicated far more children in need of support (Jee, Conn, et al., Citation2010; S. H. Jee, Halterman et al., Citation2011; S. H. Jee, Szilagyi et al., Citation2010). For example, using the standardized instrument Ages and Stages Questionnaire to detect developmental delay among children aged 4 months to 5 years newly placed in foster care, S. H. Jee, Szilagyi et al. (Citation2010) found that the detection rate of developmental delay was nearly double (58%) that of service-as-usual assessments (29%). Use of the Ages and Stages Questionnaire Social Emotional indicated that 24% of the children aged 6 months to 5.5 years new to foster care had social-emotional problems compared to 4% as indicated by service-as-usual assessments (S. H. Jee, Conn et al., Citation2010). These large discrepancies between the two methods of assessment are of some concern. They indicate that social workers who use service-as-usual assessments may be aware of – and therefore able to help – fewer children in OHC with mental health difficulties. They also suggest that supplementing service-as-usual assessments with standardized psychometric evaluations will increase the number of children identified as in need of support.
Social work assessment has conventionally relied on a holistic approach (e.g., Chetkow-Yanoov, Citation1997; Pardeck, Citation1996; Payne, Citation2016), which is also evident in social work technology such as the Integrated Children’s System (Kufeldt & McKenzie, Citation2011). This approach draws on, for example, Bronfenbrenner’s ecological systems theory (Citation1979), which posits that individuals develop in different environmental contexts (systems). Such an approach calls for drawing upon observations from the different contexts in a child’s life. Therefore, from the perspective of routine professional practice, it is important to know how much different respondents agree in their assessments of a child, i.e., the instrument’s cross-informant consistency and inter-rater reliability. Further, if a child has been assessed by the social authorities for behavioral problems, one could reasonably expect greater attention to, and communication about, the child between observers in different contexts. This may lead to a greater agreement between observers, i.e., greater cross-informant consistency, or it may accentuate differences in perception. It is equally important to know how close repeated measurements with an instrument are to each other, i.e., the instrument’s test-retest reliability and temporal stability, in order to be able to measure the intended impact of interventions (e.g., Mason et al., Citation2012). Finally, it is important to know how well an instrument can distinguish between groups that it should theoretically be able to distinguish between, i.e., its ability to discriminate, and how accurate it is compared to a gold standard, i.e., its ability to correctly identify children with a high symptom load corresponding to a clinical diagnosis. These psychometric properties are of great relevance for the social worker’s assessment of the child and are to varying degrees implicit in service-as-usual assessments.
The aim of the review
The aim of this review is to synthesize studies examining the reliability and criterion validity (see ) of a standardized instrument, the Strengths and Difficulties Questionnaire (SDQ; R. Goodman, Citation1997, Citation2001), with reference to service-as-usual social care generally and out-of-home care more specifically. A brief, easy-to-use, and low-cost questionnaire, the SDQ is one of the most commonly used assessment tools for child mental health difficulties (Reiss, Citation2013). It has been used in both epidemiological and clinical studies in at least 89 different languages and its psychometric properties have been studied extensively (sdqinfo.org; Kersten et al., Citation2016; Stone et al., Citation2010). Similar to the large discrepancy between the two methods of assessment noted above, assessments using the SDQ have indicated twice as many children (54% vs. 27%) with mental health difficulties among foster children aged 11 to 17 years compared to service-as-usual assessment (S. H. Jee, Halterman et al., Citation2011).
Table 1. Definitions of the psychometric properties of the SDQ
The SDQ is gaining increasing acceptability as a screening instrument in social care. One indication is its mandatory use in child and youth welfare services for assessing mental health difficulties and follow-up in the United Kingdom (Cox & Bentovim, Citation2000; Department for Education & Department of Health, Citation2015) and its growing use in Denmark (e.g., Obel et al., Citation2016). Several studies of the SDQ’s ability to screen children in contact with social services have found that it is adequate for this purpose (Goodman & Goodman, Citation2012; S. H. Jee, Halterman et al., Citation2011; S. H. Jee, Szilagyi et al., Citation2011; Lehmann et al., Citation2013; Richards & Wood, Citation2006), though in some cases with reservations (Wright et al., Citation2019). Two previous comprehensive systematic reviews examined the structural validity and the internal consistency reliability of the SDQ (Kersten et al., Citation2016; Stone et al., Citation2010), with broadly similar results. They concluded that the five-factor structural validity of the SDQ was strong and that the internal consistency of the Total Difficulties Scale (TDS) was acceptable.
Kersten et al. (Citation2016) judged, for reasons that are unclear, that the TDS was inadequate for clinical decision-making using Cronbach’s alpha, which is the most commonly reported indicator of internal consistency reliability. There is a growing criticism of the use of alpha. For example, Cho (Citation2016) argues persuasively that alpha is most frequently used even though it is not the most accurate reliability coefficient (i.e., it is overused) and alpha’s use is unqualified if its assumptions are not examined (i.e., it is incorrectly used).
How the review builds on previous research
Our review extends the two previous reviews of the SDQ and adds a new perspective. First, in addition to parent and teacher reports, which were included in the previous reviews, it includes self-report versions of the SDQ. Second, it extends the age range from 3–12 years to 3–18 years. Third, it examines psychometric properties not only by informant type (e.g., parent) but, wherever possible, also by sample type, community (drawn from a normal population) or clinical (consisting of those categorized as affected by mental health difficulties). Fourth, it distinguishes test-retest reliability from temporal stability, an important distinction when tracking change over time. Fifth, it synthesizes studies to assess whether the multi-informant predictive algorithm proposed by Goodman (R. Goodman et al., Citation2000) has a higher ability to discriminate compared to prediction using single respondent types. Sixth, it synthesizes results for sensitivity and specificity, which both previous reviews found acceptable, though based on narrative summaries of single studies. Finally, it relates findings regarding the SDQ to its use among children in OHC. We choose those psychometric properties that are of relevance to practitioners in professional settings (see, e.g., Evers et al., Citation2013). For example, we look at the SDQ’s ability to discriminate between clinical and community samples using concepts such as sensitivity and specificity, which have direct relevance for professional social work with children in OHC.
To extend earlier reviews we formulate the following propositions in five areas of review (see also for detailed definitions of the terms used), based on our knowledge of social work and the psychometric literature. The reasoning behind these propositions is provided below in the “Strategies for statistical analysis” section.
-
Inter-rater reliability: We expect that informants of the same type (e.g., parents, specifically mothers and fathers) are not interchangeable (r <.90), but the correlations between their responses should be acceptable (r > .60).
-
Cross-informant consistency: Informants of different types (e.g., parents and teachers) are not interchangeable. However, the correlation between their responses should be above negligible (r > .30) to be acceptable.
-
Differences in cross-informant consistency in clinical and community samples: We expect that the magnitude of cross-informant consistency will differ between clinical and community samples.
-
Test-retest reliability and temporal stability: Correlation between responses for test-retest reliability (corresponding to an interval of under 31 days) should be above .70 and that for temporal stability (corresponding to an interval of 31 days or more) should be above 0.60, in both cases with .90 as an upper limit, to be considered acceptable.
-
Ability to discriminate: Sensitivity and PPV should be below 70%, and specificity and NPV should be above it, indicating the SDQ is better at ruling out difficulties than ruling them in. To improve the SDQ’s ability to discriminate an algorithm based on several informants was developed (R. Goodman et al., Citation2000). Here we assess the proposition that it does so.
Method
This review is part of a project, “Me and my foster family: Improving the lives of foster children,” which seeks to integrate the SDQ into Danish routine social work practice with foster children. It followed the Preferred Reporting Items for Systematic Reviews and Meta-Analyses (PRISMA) statement guidelines (Moher et al., Citation2009) to capture published studies reporting on reliability and/or validity of the SDQ-P/SDQ-T/SDQ-S. The review protocol is currently being processed for registration in the International Prospective Register of Systematic Reviews (PROSPERO; http://www.crd.york.ac.uk/prospero/). We specified eligibility (inclusion/exclusion) criteria using the population, instrument, sample, and psychometric indicators.
The Strengths and Difficulties Questionnaire
The SDQ is used for children aged 2–17 years through parent and teacher reports and for those aged 11–16 through self-reports. There are also self-report and informant versions for those 18 and above (sdqinfo.org). This brief screening questionnaire focuses on psychological attributes and comprises 25 items making up five scales of five items each. Responses are scored 0 (not true), 1 (somewhat true) and 2 (certainly true) and are summed to obtain scales ranging from 0 to 10 for Emotional Symptoms, Conduct Problems, Hyperactivity-Inattention, Peer Problems, and Prosocial Behavior (R. Goodman, Citation1997; R. Goodman et al., Citation1998). The first four of these scales can be summed to obtain a Total Difficulties Score (TDS) ranging from 0 to 40. A higher score on the scales indicates poorer adjustment except in the case of the Prosocial scale, which measures children’s positive characteristics and is reverse-coded.
An impact supplement containing eight items was added to the SDQ, enabling the informants to report on possible burden and distress (R. Goodman, Citation1999). The first item indicates whether the reported difficulties cause the child distress, the remaining items assess chronicity, distress, social impairment, and burden for others. Taken together, three dimensions can be deduced: Perceived difficulties (is there a problem?), impact score (does the problem impair the daily life of the child?), and a burden rating (do symptoms represent a liability?). Even though these supplementary items are not included in the scoring of the SDQ, they can be useful for professionals interested in assessing the effect of the child’s difficulties in different contexts (e.g., at home or at school).
Population
Children up to the age of 18 from all populations (not exclusively OHC populations). Studies were excluded if the study population had a serious neurological condition such as epilepsy, mental delay, cerebral palsy (e.g., Bjorgaas et al., Citation2013; Reilly et al., Citation2014) (see also , reasons for exclusion “neurological population”).
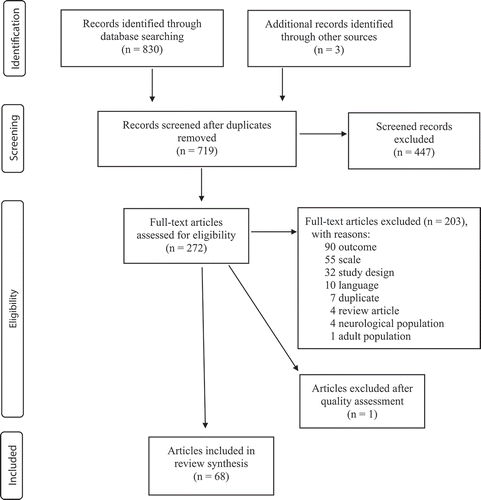
Figure 1. Literature review flowchart (modified PRISMA 2009 version, Moher et al., Citation2009)
Instrument
The paper or computerized parent, teacher, or self-report version of the Strength and Difficulties Questionnaire. Several studies of other instruments using the same abbreviation (SDQ), e.g., Shoulder Disability Questionnaire or Somatoform Dissociation Questionnaire were excluded (see also , reason for exclusion “scale”). Studies using informants other than parents, teachers, or self-report (e.g., counselors, Shevlin et al., Citation2012) were excluded (see also , reason for exclusion “study design”).
Sample
The community sample is drawn from the normal population, which means that it is not selected on any criteria but includes all naturally occurring variation in composition. The clinical sample had to be selected in one or more of four ways to be included (see , “Source of diagnosis”). First, the sample was diagnosed in a health practice. Second, the sample comprised attendees at out-patient or in-patient mental health clinics. Third, the sample consisted of children in OHC, and fourth, it had been assessed via a standardized diagnostic interview.
Table 2. Summary of articles included in the review
Table 3. Summary of inter-rater correlations (Pearson’s, Spearman’s, and ICC Coefficients)
Table 4. Summary of cross-informant consistency (Pearson’s, Spearman’s, and ICC coefficients)
Table 5. Summary of test-retest reliability and temporal stability (Pearson’s, Spearman’s, ICC coefficients)
Table 6. Summary of criterion validity: capacity to discriminate
Psychometric indicators
Studies that presented any of seven indicators describing reliability (inter-rater, cross-informant reliability, test-retest reliability, and temporal stability) and validity (specificity, sensitivity, positive predictive value (PPV), and negative predictive value (NPV) were included (see for definitions). Excluded were studies focusing on data reduction (mainly factor analysis, see , reason for exclusion “study design”) or reporting other outcomes for reliability and validity (see also , reason for exclusion “study design”).
Publication search and screening/eligibility
Wildcards, truncation, and abbreviation were used as specified by different databases (e.g., “SDQ*” OR “strength* and difficult* questionnaire*” AND psychometric* OR validat* OR validitity* OR reliability* OR test-retest* OR sensitivity OR specificity OR positive predictive value* OR negative predictive value*) in all search fields (title, abstract, full text, and keywords). The search for reliability and validity used the databases PsychINFO, EBSCOHOST, and PubMed. No date restrictions were set but articles not published in English or Scandinavian languages were excluded (see also , reason for exclusion “language”). The search included studies published up to February 2018. Hand searches of reference lists of relevant extracted articles were conducted.
We used Covidence (Covidence systematic review software, Veritas Health Innovation, Melbourne, Australia. Available at www.covidence.org) to screen articles and extract data. Two out of three reviewers (consisting of the two authors and a research assistant, N.F.) screened all titles and abstracts and, if necessary, the full article, to determine whether the article was eligible; any discrepancies were discussed until a consensus was reached. All studies were critically appraised by the authors.
Risk of bias and data extraction process
Risk of bias was assessed using the COSMIN (COnsensus-based Standards for the selection of health Measurement INstruments) quality score (excellent = 3, good = 2, fair = 1, poor = 0; high score indicates low risk of bias) by obtaining the lowest rating of any item in a box (i.e., “worst score counts”) (Terwee et al., Citation2012). All decisions were documented. We used a modified version of the standards presented by Terwee et al. (Citation2012; see Box B, p. 654), comprising seven questions:
-
Was the percentage of missing items indicated?
-
Was there a description of how missing items were handled?
-
Was the sample size included in the analysis adequate?
-
Were the administrations independent?
-
Were the children stable in the interim period on the construct to be measured?
-
Were the test conditions similar for both measurements, e.g., with respect to the type of administration, environment, and instructions?
-
Were there any important flaws in the design or methods of the study?
Data were extracted only from studies with a total quality score of at least 11 on a scale from 0 to 21. Any disagreements on the quality rating of individual studies were resolved by the authors. Data were then extracted from the included publications. All extracted data were checked by the authors in pairs and included first after reaching consensus. A research assistant conducted a separate check on all extracted data.
Data extraction and synthesis
Data were extracted for all the six SDQ scales measuring psychosocial attributes (including the Total Difficulties scale) and the Impact scale. In reporting the results, we use the term “SDQ scales” to refer to the six scales measuring psychosocial attributes. We report results separately for the Impact scale, which is derived from the Impact supplement and conceptually different from the SDQ scales.
Sample size-weighted averages and corresponding 95% confidence intervals were calculated for the four reliability indicators (see ). Correlation coefficients were transformed first into Fisher’s Z scores in order to enable the calculation of weighted correlations. The normally distributed Fisher’s Z-scores were weighted according to their sample size minus 3, and a weighted mean Fisher’s Z-score was computed by dividing the sum of the weighted Fisher’s Z-scores by the sum of their weights. The weighted mean Z-score was transformed back to a correlation coefficient r (Field, Citation2001).
Weighted mean correlations were reported separately by type of informant (in case of test-retest reliability and temporal stability) and by informant pairs (in case of inter-rater reliability and cross-informant consistency). Following Kersten et al. (Citation2016) Pearson’s and Spearman’s correlation coefficients and intra-class correlation coefficient (ICC) were considered equivalent for the purpose of computing summary statistics and combined. If a study reported more than one type of correlation coefficient (e.g., Pearson’s and Spearman’s (e.g., R. Goodman, Citation2001), or Pearson’s and ICC (e.g., Mieloo et al., Citation2012)) then only one was included in the analysis, with priority given to Pearson’s coefficient (the most frequently reported statistic) followed by Spearman’s coefficient. Relatively few studies reported the ICC. Owing to the possible heterogeneity of the groups and the different types of sample correlations involved, weighted summaries should be taken as indicative only. To be included in a table, there had to be a minimum of two studies in a particular category.
Studies have used different, and at times multiple, thresholds to identify a symptom load equivalent to the symptom criteria in psychiatric disorders in order to assess discriminative ability. Wherever possible we use the cutoff identifying the abnormal category. This corresponds most often to the 90th percentile (R. Goodman, Citation1997) but need not always do so (e.g., Malmberg et al., Citation2003; Silva et al., Citation2015; Sveen et al., Citation2016). Sample size-weighted means were reported separately by type of informant for four indicators of discriminative ability: sensitivity, specificity, PPV, and NPV.
Strategies for statistical analysis
We use the following reasoning in assessing whether results were acceptable (see for definitions). There is no universal standard for what is considered acceptable. Generally, the following rule-of-thumb is applied to the absolute magnitude of correlation: 0 – .30 indicates negligible correlation, .30 – .50 indicates low correlation, .50 – .70 indicates moderate correlation, .70 – .90 indicates high correlation, and .90–1.00 indicates very high correlation (Mukaka, Citation2012).
Inter-rater reliability
Criteria for an acceptable correlation for inter-rater reliability vary. A previous systematic review of the SDQ has used a criterion of .80 or higher for coefficients of reliability (Kersten et al., Citation2016). In comparison, the Encyclopedia of Research Design recommends a criterion of .70 or higher (Multon, Citation2010). Yet another influential source is the European Federation of Psychologists’ Associations (EFPA), whose Test Review Criteria were largely modeled on the form and content of the British Psychological Society’s (BPS) test review criteria and criteria developed by the Dutch Committee on Tests and Testing (COTAN) of the Dutch Association of Psychologists (NIP). The EFPA notes that the inter-rater reliability acceptability criterion is often .60 or higher (Evers et al., Citation2013). We have chosen to apply this (.60) criterion because a lower criterion of acceptability is needed when synthesizing different samples across varying perspectives (e.g., mother and father) but in the same general context (e.g., at home). Further, we add an upper limit (.90), reflecting the assumption that the ratings are not interchangeable. A very high correlation is a violation of this assumption. If raters were interchangeable, the assessment of any one type of rater would be sufficient.
Cross-informant consistency
Compared to inter-rater reliability, a lower criterion of acceptability needs to be applied to cross-informant consistency where respondents are reporting from different contexts (e.g., home and school). Stone et al. (Citation2010) apply a correlation of .27 as a benchmark of agreement between parents and teachers, citing the work of Achenbach et al. (Citation1987) and R. Goodman (Citation2001). We apply an acceptability criterion of .30 or higher on the grounds that the correlation should be higher than “negligible” (Mukaka, Citation2012).
Differences between clinical and community samples with respect to cross-informant consistency
In order to assess differences in cross-informant consistency between the clinical and community samples we compare the magnitudes of r using Fisher’s z-transformation (Bailey, Citation1981) and supplement it with a test of statistical significance.
Test-retest reliability and temporal stability
Evers et al. (Citation2013) note that test-retest refers to relatively short time intervals whereas temporal stability refers to longer intervals in which more change is acceptable. However, they do not specify the length of the interval. If the correlation is very high, the measurement is too stable; if it is very low, the measurement is too sensitive. According to the EFPA, an adequate level for test-retest reliability coefficients is .60 – .70 (Evers et al., Citation2013). A previous review of the SDQ has used .70 or higher as an acceptable level for test-retest (Stone et al., Citation2010) but does not distinguish between test-retest reliability and temporal stability. We use the minimum .70 criterion for test-retest reliability because the SDQ measures a state, which should exhibit little change in the short term (under 31 days). If the interim period is longer it is a question of temporal stability (Evers et al., Citation2013) and we use a lower acceptability criterion (.60). In both cases, we set an upper limit of .90, beyond which the instrument would be considered too stable.
Ability to discriminate: sensitivity, specificity, PPV And NPV
The ideal test would discriminate between individuals with and without problems with 100% accuracy, indicating a perfect relationship between a test and a criterion. But such a test is rare. Determining what is an acceptable ability to discriminate is challenging because most publications do not present reasons for their acceptability criteria for this property. One review (Stone et al., Citation2010) pointed out that the accuracy of the SDQ as a screening instrument varies with the prevalence rates in a certain population, implying that it would be inappropriate to set universal acceptability criteria. In contrast, another review of the SDQ (Kersten et al., Citation2016) uses the following acceptability criteria: sensitivity ≥80% and specificity ≥60%. For simplicity, we choose an acceptability criterion in between (70% or higher) for all four indicators: sensitivity, specificity, PPV, and NPV. Comparisons of the performance of the multiple-respondent algorithm to assessments made using single respondent types were made using z-test for differences between proportions (Glen, Citationn.d.).
Results
Description of articles included in the review
The search identified 830 possible references. After removing duplicates and screening abstracts we ended with 272 eligible full-text articles (see ). Examination of the eligible articles led to a further reduction to 68 articles (including one reprint) covering 61 studies (see ). The total sample in the studies (n) had a range of 26–63,615 in community samples and 93–494 in clinical samples. R. Goodman et al. (Citation2004) used the parts of a sample used in other publications and presented results from yet another sample not presented elsewhere in the included studies. Only two studies (S. H. Jee, Szilagyi et al., Citation2011; Lehmann et al., Citation2014) had a sample consisting of children in foster care. The total sample size was considerably smaller in the reliability and validity analyses presented in because unique sub-samples of the total sample were sometimes used for calculating the seven psychometric indicators. The age of the children was 1–18 years. All developmental stages in childhood from toddlers on are represented (toddlers, 1–3 years = five studies, preschoolers, 4–6 years = 29 studies, primary school-age children, 6–12 years = 54 studies, and teenagers 13–18 years = 38 studies). Most studies include more than one developmental stage. About two-thirds of the studies (n = 42) included children aged 11 and older, which is the recommended age for the self-rating scale.
The SDQ exists in three versions, giving the perspectives of three types of informants (parents, teachers, and the child itself) on the child (see ). Most studies (44%, n = 27) include two perspectives; 15 studies (25%) have one perspective. While the parental perspective dominates (87%, n = 53), the other perspectives are also included in more than half the studies (teacher 61%, n = 37; self-report 54%, n = 33).
The community population was the most commonly used source of informants (54%, n = 33,) and purely clinical samples were used only in 9 studies (15%) (see ). The studies have been conducted in 27 different countries. Most use a European population (59%, n = 36), but six other continents are also represented: Asia (21%, n = 13), Oceania (only Australia, 8% n = 5), North America (8%, n = 5), South America (only Brazil, 2%, n = 1), and Africa (only South Africa, 2%, n = 1). To categorize children into psychiatric diagnoses most studies (n = 34) used clinical interviews (50%, n = 17), and within this category used mainly the Development and Well-Being Assessment (DAWBA; 53%, n = 9).
Inter-rater reliability
This property was assessed only by studies using community samples (see ). Studies examining mother-father agreement ranged from 4 to 5. Inter-rater reliability was acceptable (.60 < r < .90) for only two out of the six scales (Hyperactivity and TDS), but the correlation was not very high. The mean weighted correlation ranged from .51 for the Peer and Prosocial scales to 0.64 for the Hyperactivity-Inattention scale. Inter-rater reliability for the Impact scale was reported by a single study (A.-M. Borg et al., Citation2012): .54 (n = 1,874).
One study (A.-M. Borg et al., Citation2012) examined agreement between teachers of 4–6-year-old boys and girls (n = 922–945) in daycare institutions. Inter-rater reliability ranged from .59 (Emotional symptoms) to .81 (Hyperactivity-Inattention; TDS) with only one unacceptable (≤ .60) correlation (Emotional symptoms).
Cross-informant consistency
The range of studies assessing cross-informant consistency of the SDQ scales was 3–19 and for the Impact scale, 0–4 (see ). The aggregated sample size for the SDQ scales ranged from 270 to 34,377 and for the Impact scale from 188 to 19,667.
Community samples
Consistency was acceptable (> .30) for all but one (Prosocial behavior) of the SDQ scales and the Impact scale in the parent-self-report set. It was also acceptable for all scales but two, Emotional symptoms and Prosocial behavior, in the parent-teacher set. In contrast, it was acceptable for only two of the SDQ scales (TDS and Hyperactivity-Inattention) in the teacher-self-report set. Overall, consistency was acceptable when the set included a parent as a respondent. Cross-informant consistency on the Impact scale was acceptable in all three sets.
Clinical samples
All six SDQ scales in all respondent sets met the acceptability criteria except two, TDS and Prosocial behavior, in the parent-teacher set and one, Prosocial behavior, in the teacher-self-report set. Regarding cross-informant consistency on the Impact scale, there was no study in the teacher-self-report set. Consistency was considered acceptable in only one of the remaining two sets, the parent-teacher category, but based on a single study (Emerson, Citation2005).
Differences between clinical and community samples with respect to cross-informant consistency
Comparisons were possible on 19 of a total 21 scales across all three respondent pairs. Comparisons on Impact scales for two respondent pairs (teacher-self and teacher-parent) were not possible because cross-informant consistency was not calculated for clinical samples. In 42% (8) of the possible comparisons, the clinical sample had a significantly higher r, as hypothesized. In another 42%, there was no significant difference between the two samples in the magnitude of r. In the remaining 16% (3 comparisons) the magnitude of r was significantly higher in the community sample. Two of these three comparisons were with respect to the TDS.
Test-retest reliability and temporal stability
Test-retest reliability was acceptable (r ≥ .70) for only three of the scales (TDS, Emotional symptoms, and Hyperactivity-Inattention) for parents and for self-reports (see ). In contrast, among teachers, all SDQ scales indicated acceptable test-retest reliability, with weighted mean correlations ranging from .78 to .88. Test-retest reliability for the Impact scale was reported by only one study (R. Goodman, Citation1999; n = , p. 34), using parent informants, and was unacceptable.
Temporal stability was acceptable (r ≥ .60) for all SDQ scales among parents and, with one exception (Emotional symptoms, mean = .60, C.I.: .57-.63), among teachers. In contrast, only one of the six scales among self-reports (TDS) had acceptable stability. Though two other scales (Emotional symptoms and Hyperactivity-Inattention) also had a weighted mean correlation at or above .60 the corresponding confidence interval went below the acceptable level.
Temporal stability of the Impact scale was unacceptable in all three informant categories. It should be noted, however, that results for teachers and self-reports are based on a single study (Stringaris & Goodman, Citation2013), in which four SDQ measurements were separated by year-long intervals, and which therefore maybe considered an outlier. The study is included three times in the parent category (compare “No. of articles” to “No of samples” in ), with correlations for three periods ranging from one to three years.
Ability to discriminate: sensitivity, specificity, PPV and NPV
Studies assessing ability to discriminate (see ) varied by the sample used, the method used for making predictions (individual scales or the multi-informant predictive algorithm), the cutoffs used to define the clinical threshold, the diagnostic tool (e.g., DAWBA, K-SADS) and the disorders predicted (e.g., any psychiatric disorder or a specific disorder such as CD, ODD, ADHD, anxiety). Most studies assessed the discriminative ability of the TDS.
Sensitivity was reported using parent and teacher responses and self-reports. None of the SDQ scales fulfilled the acceptability criterion (≥70%). Sensitivity of the Impact scale using parent reports was acceptable, with a weighted mean sensitivity of 75.54% (range: 16.20% −85%). There was no self-report study of the Impact scale. Sensitivity of the scale using teacher reports was unacceptable (weighted mean sensitivity: 53.39%).
For all the SDQ scales and for all three respondent groups specificity was acceptable (≥70%). The Impact scale showed acceptable specificity based on parent reports (weighted mean specificity: 87.35%) and teacher reports (weighted mean = 89.8%). There was no self-report study of the specificity of the Impact scale.
The PPV was unacceptable (<70%) for all the SDQ scales using parent report, self-report, or teacher report. PPV of the Impact scale using parent reports was acceptable (weighted mean = 81.24%) based on two studies, but no study reported PPV based on self-reports and teacher-reports.
With respect to the NPV, all six SDQ scales fulfilled the acceptability criterion (≥70%) regardless of respondent type. Only one study reported NPV of the Impact scale (72%; Lehmann et al., Citation2014).
Use of the multi-informant algorithm enhanced the discriminative ability to varying degrees. Using the TDS as a yardstick, the increases, expressed in percentage points, ranged from 11.58 to 28.03 for sensitivity, 1.58 to 6.29 for specificity, 2.74 to 11.74 for PPV, and 1.54 to 4.72 for NPV. The lowest enhancement is in regard to the parents and the highest is in regard to the self. All these increases were found to be statistically significant using the two-proportion z-test.
Discussion
The SDQ is one of the world’s most widely used measures of psychosocial attributes (Reiss, Citation2013) and its psychometric properties have been tested in several studies. Yet, few studies have focused on the practical use of SDQ in social care when discussing its measurement properties, even though the instrument is used in social care, including OHC. To remedy this gap, we synthesized, from an OHC perspective, the assessment of the properties of the six SDQ scales and the Impact scale in five areas by studies covering different age groups, samples, and countries.
We noted that the reviewed studies vary in quality. In line with Kersten et al. (Citation2016), we found that the quality of the studies could easily be raised if they reported the degree of non-response on single SDQ items and how researchers handled missing values (see the first two questions in the quality assessment of the included studies). In addition, we underscored that no study has reported clustering of missing values on any one specific item. We assume this indicates either an absence of such clustering or that the authors of these studies do not interpret such clustering to be a sign of systematic measurement error.
Our results showed that both the TDS and the Hyperactivity-Inattention scale produced acceptable values with respect to the first three areas of exploration. Regarding the fifth area of exploration, criterion validity, the TDS was the most frequently reported scale across the samples. Our synthesis of results for this scale was based on at least three samples, making them the most credible. In addition, Stone et al. (Citation2010) have already advised caution when using and interpreting the subscales of the SDQ separately. Therefore, the focus of following discussion is the TDS.
Inter-rater reliability
The first proposition stated that informants of the same type (here mothers and fathers) are not interchangeable but that the correlation between their ratings should be acceptable (> .60). We find that the correlation is acceptable. This finding is in line with a previous review (Kersten et al., Citation2016). Further, we note that our results indicate that mothers’ and fathers’ scores are not sufficiently consistent with respect to the child´s TDS. This suggests that, when assessing whether a child is above or below the clinical threshold, it is important to consider the type of respondent (mother or father) in the reference group (typically a normal population sample) that is used to determine the clinical threshold.
Most, if not all, articles used the term “parent” to describe the respondent. If the term parent is used, the proportion of mothers or fathers should be stated. If the respondent is mostly one of the parents (e.g., the mother), the result may not be generalizable to both parents. A strong research implication here is to be more transparent about which of the parents was the respondent. Separate analyses for mothers and fathers should be done if possible.
In addition, we question the interchangeability of teacher-respondents. Both Kersten et al. (Citation2016) and we found only one article showing acceptable correlation in this respondent group. This is inadequate for drawing any firm conclusions. However, one could ask, would a child’s subject teacher, for example, make the same SDQ assessment of a child as its class teacher (assuming they are different persons)? Probably not, because the child may interact differently with different teachers, and can also react differently to the subjects being taught in the classroom. More generally, there are likely more factors influencing a child’s well-being in a school context than in a home context, such as teachers, classmates, and subjects. Future research should examine more closely the interchangeability of teacher-respondents.
Cross-informant consistency
The second proposition states that informants of different types (e.g., parents and teachers) are not interchangeable, but the correlation between their responses should be above negligible. Our results indicate non-negligible correlations in both clinical and community samples in all three respondent sets (parent-self-report, parent-teacher, and teacher-self-reports), echoing the findings of the two previous reviews (Kersten et al., Citation2016; Stone et al., Citation2010). They are consistent with the explanation that parents and teachers see children in different contexts and interact with them in different ways (Bronfenbrenner, Citation1979). In addition, children can view themselves differently from the way their parents and teachers view them, even if they have overlapping contexts with both these informant types. This implies that when social work professionals assess children, they should strive to obtain the views of respondents from different contexts (home environment, intrapersonal context, and day-care/school context). Further, we found that cross-informant consistency was stronger in all respondent-sets that included a parent. This suggests that at least one of the assessments should be done by a parent. But the cautionary note by Stone et al. (Citation2010) and Kersten et al. (Citation2016) still stands: The results of an SDQ assessment by a single type of informant may not be generalizable to other contexts.
Differences between clinical and community samples with respect to cross-informant consistency
The third proposition, that cross-informant consistency should be different in clinical and community samples, receives only partial support if we examine all the scales. If we focus solely on the TDS, consistency was higher in two of three respondent-sets in the community samples. This finding lends support to the proposition that inter-informant differences are greater in clinical samples and underscores the need for social workers to maintain a holistic approach to obtaining SDQ assessments of their child clients.
Test-retest reliability and temporal stability
Regarding the fourth area of exploration, test-retest reliability and temporal stability, TDS values for all three respondent categories were acceptable (though with only one study of self-reports). This result is in line with those of both previous reviews (Kersten et al., Citation2016; Stone et al., Citation2010). However, neither of these reviews distinguished between test-retest reliability and temporal stability. Nor did they consider whether the SDQ was too stable. The threshold values of test-retest reliability and temporal stability should include both a lower value and a higher value.
This area of exploration has implications for the estimation of clinically meaningful change (Jacobson & Truax, Citation1991). Clinically meaningful change refers to the extent to which an intervention moves someone outside the range of a dysfunctional population or within the range of a functional population. One indicator of such change is the Reliable Change Index (RCI). The index shows whether the magnitude of change measured for a given individual is statistically reliable (Jacobson & Truax, Citation1991) and is calculated using a test-retest reliability coefficient. In their comparison of four indices of clinically meaningful change using SDQ parent-reports, Wolpert et al. (Citation2015) find that RCI may be best suited to use for individual case review of children’s mental health. Since children in OHC comprise a heterogeneous population, we recommend calculating the RCI using an aggregated reliability coefficient synthesized from several different study populations, selecting either an aggregated test-retest reliability coefficient or temporal stability coefficient depending on the length of placement in OHC or the duration of an intervention.
Ability to discriminate
With respect to the fifth area of exploration, our results support the proposition that the sensitivity and PPV would be unacceptable (i.e., the likelihood of correct positives is less than 70%) and that the specificity and NPV would be acceptable (i.e., the likelihood of correct negatives is more than 70%). This is in line with the results of Kersten et al. (Citation2016) with regard to sensitivity and specificity. In contrast, Stone et al. (Citation2010) concluded that the TDS had high sensitivity and specificity, indicating that the SDQ was a good screening instrument. However, both these reviews based their conclusions on narrative summaries.
Further, the previous two reviews neglected two other measures of diagnostic accuracy of the SDQ: its PPV and NPV. By also reviewing the PPV and NPV of the instrument, we consider its clinical relevance. Unlike sensitivity and specificity, the PPV and NPV of an instrument depend on the prevalence of the disorder it is used to screen for and are related to sensitivity and specificity through prevalence. Prevalence is defined as the number of cases in a defined population at a single point in time and typically expressed as a proportion. PPV is greater when prevalence is high, and when a disorder is rare (i.e., prevalence is low) a greater specificity is needed to achieve a higher PPV. NPV is greater when prevalence is low, and when a disorder is common (i.e., prevalence is high) a greater sensitivity is needed to achieve a higher NPV. In contrast, sensitivity and specificity are calculated from subgroups of subjects with and without the condition, respectively.
There is a relationship between the chosen clinical threshold of a test for defining caseness and its accuracy measured by sensitivity, specificity, PPV, and NPV. If the TDS has high sensitivity and PPV the test will, when negative, help to rule out the presence of a diagnosis. Conversely, if it has a high specificity and NPV, it will, when positive, help to rule a diagnosis in. The use of the 90th percentile, which is by far the most commonly used clinical threshold in the articles reviewed, sets a limit on the instrument’s ability to correctly identify children with and without a diagnosis. The chosen clinical threshold will alter the likelihood of high or low sensitivity and specificity (Silva et al., Citation2015). In general, the higher the sensitivity, the lower the specificity (Lalkhen & McCluskey, Citation2008). In a normal population, the prevalence rate of having a diagnosis, i.e., being in need of care for psychosocial problems, is low. However, in an OHC sample the prevalence rate is likely to be considerably higher (Bronsard et al., Citation2016). Therefore, it is important to prioritize specificity and NPV over sensitivity and PPV. When positive, a test with high specificity would help rule in a diagnosis.
In contrast to the previous reviews, we also assessed the multiple-informant algorithm. We view the algorithm as a way of formalizing the holistic approach in social work through the use of different types of respondents in making child assessments. R. Goodman et al. (Citation2004) conclude on the basis of a sample of looked-after children that the multi-informant algorithm could improve the SDQ’s ability to detect mental health difficulties. However, Lehmann et al. (Citation2014) do not recommend the use of the multi-informant algorithm among children in OHC. We are unable to contribute to this debate because there are too few studies and they do not implement the algorithm uniformly. We would argue that despite the inconsistent results from the algorithm, there is little to be lost by using it and much to be gained. The issue is not one of deciding whether to collect information about children in OHC from their different life contexts. This should be done in any case. Once such information is collected, it would be a waste of resources not to combine the information to enable more accurate assessment – and the algorithm would be a systematic and transparent way of doing so.
The SDQ is designed as a brief screening questionnaire and intended to work as a systematic risk marker. Validated and standardized risk markers such as the SDQ have the potential to enhance social workers’ ability to optimally allocate their resources among clients. Our recommendation is to use the TDS to screen for mental health difficulties, not focusing on specific diagnoses. More generally, we agree with Wright et al. (Citation2019) who suggest that the SDQ should be seen as a supplement to the service-as-usual assessment. The SDQ can be used to identify children where a clinical diagnosis is probably needed. However, it should be left to the social worker’s professional judgment whether to act on the basis of the SDQ as a systematic risk marker. A high number of symptoms indicated by the SDQ could equally accurately be interpreted as a natural reaction to a specific traumatic incident and as the indicator of a clinical diagnosis. In sum, the SDQ should not replace the service-as-usual assessment or the social worker´s professional judgment. Hopefully, it will, when used as a supplement, further stimulate the social worker’s professional curiosity about a child’s mental health.
Methodological considerations
Our study gives rise to at least three methodological considerations. First, it includes few studies of samples of children in OHC. The literature on children in OHC (e.g., Lehmann et al., Citation2013) indicates that while a substantial proportion of these children have mental health difficulties, many do not. This finding led us to include both clinical and community samples in our review. However, we cannot rule out the possibility that the population of children in OHC is different from our sample in domains other than mental health difficulties.
Second, our literature search was limited to a few databases recommended by a specialist librarian as the most likely sources of literature to test our hypotheses. These databases do not cover all the gray literature. Our review may be biased to the extent that the gray literature, other than that in Danish and Swedish, which we have searched, includes estimates of the seven psychometric indicators in focus in this review. To limit bias, we went through all previous reviews of the SDQ focusing on the same seven psychometric indicators and found two articles. Only one of these met our inclusion criteria in the full-text assessment for eligibility.
Third, the statistical literature does not identify universally acknowledged criteria for when a scale’s psychometric properties are acceptable with respect to the reviewed indicators. This means that the results of a review may vary depending on the chosen criteria. Unlike previous reviews, which have typically simply stated the acceptability criteria used, we have tried to be transparent in our reasons for choosing criteria (see, e.g., the section Strategies for statistical analysis).
Conclusion
Social care professionals should view the SDQ as an important supplement to service-as- usual assessment of children in OHC and as a marker of a need for further assessment of mental health difficulties. The use of different informants’ perspectives in assessing a child is a standard requirement of social work practice. This review supports this practice by providing evidence that combining informants’ perspectives is potentially rewarding and that informants are not interchangeable. Using the SDQ will, we hope, encourage social workers to investigate discrepancies between informants’ scores and contribute to a more systematic and transparent holistic approach to assessment. However, it cannot replace the professional social worker whose training and experience are indispensable for interpreting and acting on SDQ assessments.
Acknowledgments
We would like to thank specialist librarian Bente Larsen for assistance with the bibliographical search. We are also grateful to Nina Foltved for her assistance in screening the literature and to Siri Korsgaard Larsen for her help in extracting data and formatting.
Additional information
Funding
References
- Achenbach, T. M. , McConaughy, S. H. , & Howell, C. T. (1987). Child/adolescent behavioral and emotional problems: Implications of cross-informant correlations for situational specificity. Psychological Bulletin , 101(2), 213–232. https://doi.org/10.1037/00332909.101.2.213
- Aebi, M. , Kuhn, C. , Banaschewski, T. , Grimmer, Y. , Poustka, L. , Steinhausen, H.-C. , & Goodman, R. (2017). The contribution of parent and youth information to identify mental health disorders or problems in adolescents. Child and Adolescent Psychiatry and Mental Health , 11(1), 23. https://doi.org/10.1186/s13034-017-0160-9
- Aitken, M. , Martinussen, R. , Wolfe, R. G. , & Tannock, R. (2015). Factor structure of the Strengths and Difficulties Questionnaire in a Canadian elementary school sample. Assessment for Effective Intervention , 40(3), 155–165. https://doi.org/10.1177/1534508414560347
- Almaqrami, M. H. , & Shuwail, A. Y. (2004). Validity of the self-report version of the Strengths and Difficulties Questionnaire in Yemen. Saudi Medical Journal , 25(5), 592–601. https://doi.org/20030518
- Bailey, N. (1981). Statistical methods in biology (2nd ed.). Hodder and Stoughton.
- Becker, A. , Hagenberg, N. , Roessner, V. , Woerner, W. , & Rothenberger, A. (2004). Evaluation of the self-reported SDQ in a clinical setting: Do self-reports tell us more than ratings by adult informants? European Child & Adolescent Psychiatry , 13(2), ii17–24. https://doi.org/10.1007/s00787-004-2004-4
- Bekker, J. , Bruck, D. , & Sciberras, E. (2016). Congruent validity of the Strengths and Difficulties Questionnaire to screen for comorbidities in children with ADHD. Journal of Attention Disorders, 20(10), 879-888. doi: 10.1177/1087054713496462
- Bjorgaas, H. M. , Elgen, I. , Boe, T. , & Hysing, M. (2013). Mental health in children with cerebral palsy: Does screening capture the complexity? The Scientific World Journal , 7. https://doi.org/10.1155/2013/468402
- Boman, F. , Stafström, M. , Lundin, N. , Moghadassi, M. , Törnhage, C.-J. , & Östergren, P.-O. (2016). Comparing parent and teacher assessments of mental health in elementary school children. Scandinavian Journal of Public Health , 44(2), 168–176. https://doi.org/10.1177/1403494815610929
- Borg, A. M. , Kaukonen, P. , Joukamaa, M. , & Tamminen, T. (2014). Finnish norms for young children on the Strengths and Difficulties Questionnaire. Nordic Journal of Psychiatry , 68(7), 433–442. https://doi.org/10.3109/08039488.2013.853833
- Borg, A.-M. , Kaukonen, P. , Salmelin, R. , Joukamaa, M. , & Tamminen, T. (2012). Reliability of the Strengths and Difficulties Questionnaire among finnish 4–9-year-old children. Nordic Journal of Psychiatry , 66(6), 403–413. https://doi.org/10.3109/08039488.2012.660706
- Brøndbo, P. , Mathiassen, B. , Martinussen, M. , Heiervang, E. , Eriksen, M. , Moe, T. , Sæther, G. , & Kvernmo, S. (2011). The Strengths and Difficulties Questionnaire as a screening instrument for Norwegian child and adolescent mental health services, application of UK scoring algorithms. Child and Adolescent Psychiatry and Mental Health , 5(1), 32–41. https://doi.org/10.1186/1753-2000-5-32
- Bronfenbrenner, U. (1979). The ecology of human development: Experiments by nature and design . Harvard University Press.
- Bronsard, G. , Alessandrini, M. , Fond, G. , Loundou, A. , Auquier, P. , Tordjman, S. , & Boyer, L. (2016). The prevalence of mental disorders among children and adolescents in the child welfare system: A systematic review and meta-analysis. Medicine , 95(7), e2622–e2622. https://doi.org/10.1097/MD.0000000000002622
- Capron, C. , Thérond, C. , & Duyme, M. (2007). Psychometric properties of the French version of the self-report and teacher Strengths and Difficulties Questionnaire (SDQ). European Journal of Psychological Assessment , 23(2), 79–88. https://doi.org/10.1027/10155759.23.2.79
- Chetkow-Yanoov, B. (1997). Social work practice: A systems approach . Psychology Press.
- Cho, E. (2016). Making reliability reliable: A systematic approach to reliability coefficients. Organizational Research Methods , 19(4), 651–682. https://doi.org/10.1177/1094428116656239
- Cornes, A. J. , & Brown, P. M. (2012). Mental health of Australian deaf adolescents: An investigation using an Auslan version of the Strengths and Difficulties Questionnaire. Deafness & Education International , 14(3), 161–175. https://doi.org/10.1179/1557069X12Y.0000000009
- Cox, A. , & Bentovim, A. (2000). Framework for the assessment of children in need and their families: The family pack of questionnaires and scales . Stationery Office, Department of Health.
- Davé, S. , Nazareth, I. , Senior, R. , & Sherr, L. (2008). A comparison of father and mother report of child behaviour on the Strengths and Difficulties Questionnaire. Child Psychiatry and Human Development , 39(4), 399–413. https://doi.org/10.1007/s10578-008-0097-6
- Department for Education & Department of Health . (2015). Promoting the health and well-being of looked-after children. Statutory guidance for local authorities, clinical commissioning groups and NHS England . https://assets.publishing.service.gov.uk/government/uploads/system/uploads/attachment_data/file/413368/Promoting_the_health_and_well-being_of_looked-after_children.pdf
- Doi, Y. , Ishihara, K. , & Uchiyama, M. (2014). Reliability of the Strengths and Difficulties Questionnaire in Japanese preschool children aged 4-6 years. Journal of Epidemiology , 24(6), 514–518. https://doi.org/DN/JST.JSTAGE/jea/JE20140050
- Downs, A. , Strand, P. S. , Heinrichs, N. , & Cerna, S. (2012). Use of the teacher version of the Strengths and Difficulties Questionnaire with German and American preschoolers. Early Education and Development , 23(4), 493–516. https://doi.org/10.1080/10409289.2010.532082
- Du, Y. , Kou, J. , & Coghill, D. (2008). The validity, reliability and normative scores of the parent, teacher and self report versions of the Strengths and Difficulties Questionnaire in China. Child and Adolescent Psychiatry and Mental Health , 2(1), 8. https://doi.org/10.1186/1753-2000-2-8
- Emerson, E. (2005). Use of the Strengths and Difficulties Questionnaire to assess the mental health needs of children and adolescents with intellectual disabilities. Journal of Intellectual and Developmental Disability , 30(1), 14–23. https://doi.org/10.1080/13668250500033169
- Evers, A. , Hagemeister, C. , Høstmælingen, A. , Lindley, P. , Muñiz, J. , & Sjöberg, A. (2013). EFPA review model for the description and evaluation of psychological and educational tests: Test review form and notes for reviewers. Version 4.2, 6 . Brussels: EFPA Board of Assessment. http://www.efpa.eu/download/650d0d4ecd407a51139ca44ee704fda4
- Ezpeleta, L. , Granero, R. , de la Osa, N. , Penelo, E. , & Domènech, J. M. (2013). Psychometric properties of the Strengths and Difficulties Questionnaire3–4 in 3-year-old preschoolers. Comprehensive Psychiatry , 54(3), 282–291. https://doi.org/10.1016/j.comppsych.2012.07.009
- Field, A. P. (2001). Meta-analysis of correlation coefficients: A Monte Carlo comparison of fixed- and random-effects methods. Psychological Methods , 6(2), 161–180. https://doi.org/10.1037/1082-989X.6.2.161
- Glen, S. (n.d.). Z test: Definition & two proportion Z-test . Statistics HowTo.com: Elementary statistics for the rest of us! https://www.statistics-howto.com/z-test/.
- González-García, C. , Bravo, A. , Arruabarrena, I. , Martín, E. , Santos, I. , & Del Valle, J. F. (2017). Emotional and behavioral problems of children in residential care: Screening detection and referrals to mental health services. Children and Youth Services Review , 73, 100–106. https://doi.org/10.1016/j.childyouth.2016.12.011
- Goodman, A. , & Goodman, R. (2012). Strengths and Difficulties Questionnaire scores and mental health in looked after children. British Journal of Psychiatry , 200(5), 426–427. https://doi.org/10.1192/bjp.bp.111.104380
- Goodman, R. (1997). The Strengths and Difficulties Questionnaire: A research note. Child Psychology & Psychiatry & Allied Disciplines , 38(5), 581–586. https://doi.org/10.1111/j.14697610.1997.tb01545.x
- Goodman, R. (1999). The extended version of the Strengths and Difficulties Questionnaire as a guide to child psychiatric caseness and consequent burden. Journal of Child Psychology and Psychiatry , 40(5), 791–799. https://doi.org/10.1111/1469-7610.00494
- Goodman, R. (2001). Psychometric properties of the Strengths and Difficulties Questionnaire. Journal of the American Academy of Child & Adolescent Psychiatry , 40(11), 1337–1345. https://doi.org/10.1097/00004583-200111000-00015
- Goodman, R. , Ford, T. , Corbin, T. , & Meltzer, H. (2004). Using the Strengths and Difficulties Questionnaire (SDQ) multi-informant algorithm to screen looked-after children for psychiatric disorders. Eur Child Adolesc Psychiatry. 2004;13 Suppl 2:II25-II31. https://doi.org/10.1007/s00787-004-2005-3
- Goodman, R. , Ford, T. , Simmons, H. , Gatward, R. , & Meltzer, H. (2003). Using the Strengths and Difficulties Questionnaire (SDQ) to screen for child psychiatric disorders in a community sample. International Review of Psychiatry: A Decade of National Surveys of Psychiatric Epidemiology in Great Britain - 1990-2000 , 15(1–2), 166–172. https://doi.org/10.1080/0954026021000046128
- Goodman, R. , Meltzer, H. , & Bailey, V. (1998). The Strengths and Difficulties Questionnaire: A pilot study on the validity of the self-report version. European Child & Adolescent Psychiatry , 7(3), 125–130. https://doi.org/10.1007/s007870050057
- Goodman, R. , Renfrew, D. , & Mullick, M. (2000). Predicting type of psychiatric disorder from Strengths and Difficulties Questionnaire (SDQ) scores in child mental health clinics in London and Dhaka. European Child & Adolescent Psychiatry , 9(2), 129–134. https://doi.org/10.1007/s007870050008
- Gustafsson, B. M. , Gustafsson, P. A. , & Proczkowska-Björklund, M. (2016). The Strengths and Difficulties Questionnaire (SDQ) for preschool children—A Swedish validation. Nordic Journal of Psychiatry , 70(8), 567–574. https://doi.org/10.1080/08039488.2016.1184309
- Hawes, D. J. , & Dadds, M. R. (2004). Australian data and psychometric properties of the Strengths and Difficulties Questionnaire. Australian and New Zealand Journal of Psychiatry , 38(8), 644–651. https://doi.org/10.1111/j.1440-1614.2004.01427.x
- He, J.-P. , Burstein, M. , Schmitz, A. , & Merikangas, K. R. (2013). The Strengths and Difficulties Questionnaire (SDQ): The factor structure and scale validation in U.S. adolescents. Journal of Abnormal Child Psychology , 41(4), 583–595. https://doi.org/10.1007/s10802012-9696-6
- Hysing, M. , Elgen, I. , Gillberg, C. , Lie, S. A. , & Lundervold, A. J. (2007). Chronic physical illness and mental health in children. Results from a large-scale population study. Journal of Child Psychology and Psychiatry , 48(8), 785–792. https://doi.org/10.1111/j.1469-7610.2007.01755.x
- Indredavik, M. S. , Vik, T. , Heyerdahl, S. , Kulseng, S. , & Brubakk, A.-M. (2005). Psychiatric symptoms in low birth weight adolescents, assessed by screening questionnaires. European Child & Adolescent Psychiatry , 14(4), 226–236. https://doi.org/10.1007/s00787-005-0459-6
- Jacobson, N. S. , & Truax, P. (1991). Clinical significance: A statistical approach to defining meaningful change in psychotherapy research. Journal of Consulting and Clinical Psychology , 59(1), 12–19. https://doi.org/10.1037/0022-006X.59.1.12
- Janssens, A. , & Deboutte, D. (2009). Screening for psychopathology in child welfare: The Strengths and Difficulties Questionnaire (SDQ) compared with the Achenbach system of empirically based assessment (ASEBA). European Child & Adolescent Psychiatry , 18(11), 691–700. https://doi.org/10.1007/s00787-009-0030-y
- Jee, S. H. , Conn, A.-M. , Szilagyi, P. G. , Blumkin, A. , Baldwin, C. D. , & Szilagyi, M. A. (2010). Identification of social-emotional problems among young children in foster care. Journal of Child Psychology and Psychiatry , 51(12), 1351–1358. https://doi.org/10.1111/j.1469-7610.2010.02315.x
- Jee, S. H. , Halterman, J. S. , Szilagyi, M. , Conn, A.-M. , Alpert-Gillis, L. , & Szilagyi, P. G. (2011). Use of a brief standardized screening instrument in a primary care setting to enhance detection of social-emotional problems among youth in foster care. Academic Pediatrics , 11(5), 409–413. https://doi.org/10.1016/j.acap.2011.03.001
- Jee, S. H. , Szilagyi, M. , Conn, A.-M. , Nilsen, W. , Toth, S. , Baldwin, C. D. , & Szilagyi, P. G. (2011). Validating office-based screening for psychosocial strengths and difficulties among youths in foster care. Pediatrics , 127(5), 904–910. https://doi.org/10.1542/peds.2010-1350
- Jee, S. H. , Szilagyi, M. , Ovenshire, C. , Norton, A. , Conn, A. , Blumkin, A. , & Szilagyi, P. G. (2010). Improved detection of developmental delays among young children in foster care. Pediatrics , 125(2), 282–289. https://doi.org/10.1542/peds.2009-0229
- Johnson, S. , Hollis, C. , Marlow, N. , Simms, V. , & Wolke, D. (2014). Screening for childhood mental health disorders using the Strengths and Difficulties Questionnaire: The validity of multi-informant reports. Developmental Medicine & Child Neurology , 56(5), 453–459. https://doi.org/10.1111/dmcn.12360
- Jozefiak, T. , Kayed, N. , Rimehaug, T. , Wormdal, A. , Brubakk, A. , & Wichstrøm, L. (2016). Prevalence and comorbidity of mental disorders among adolescents living in residential youth care. European Child & Adolescent Psychiatry , 25(1), 33–47. https://doi.org/10.1007/s00787-015-0700-x
- Kersten, P. , Czuba, K. , McPherson, K. , Dudley, M. , Elder, H. , Tauroa, R. , & Vandal, A. (2016). A systematic review of evidence for the psychometric properties of the Strengths and Difficulties Questionnaire. International Journal of Behavioral Development , 40(1), 64–75. https://doi.org/10.1177/0165025415570647
- Kim, M. H. , Ahn, J. S. , & Min, S. (2015). Psychometric properties of the self-report version of the Strengths and Difficulties Questionnaire in Korea. Psychiatry Investigation , 12(4), 491–499. https://doi.org/10.4306/pi.2015.12.4.491
- Kjelsberg, E. , & Nygren, P. (2004). The prevalence of emotional and behavioural problems in institutionalized childcare clients. Nordic Journal of Psychiatry , 58(4), 319–325. https://doi.org/10.1080/08039480410005846
- Klasen, H. , Woerner, W. , Wolke, D. , Meyer, R. , Overmeyer, S. , Kaschnitz, W. , Rothenberger, A. , & Goodman, R. (2000). Comparing the German versions of the Strengths and Difficulties Questionnaire (SDQ-Deu) and the Child Behavior Checklist. European Child & Adolescent Psychiatry , 9(4), 271–276. https://doi.org/10.1007/s007870070030
- Koskelainen, M., Sourander, A., & Kalijonen, A. (2000). The Strengths and Difficulties Questionnaire among Finnish school-aged children and adolescents. European Child & Adolescent Psychiatry, 9(4), 277-284. doi:10.1007/s007870070031
- Kovacs, S. , & Sharp, C. (2014). Criterion validity of the Strengths and Difficulties Questionnaire (SDQ) with inpatient adolescents. Psychiatry Research , 219(3), 651–657. https://doi.org/10.1016/j.psychres.2014.06.019
- Kufeldt, K. , & McKenzie, B. (2011). Child welfare: Connecting research, policy, and practice (2nd ed.). Wilfrid Laurier University Press.
- Lai, K. Y. C. , Leung, P. W. L. , Luk, E. S. L. , & Wong, A. S. L. (2014). Use of the extended Strengths and Difficulties Questionnaire (SDQ) to predict psychiatric caseness in Hong Kong. Child Psychiatry and Human Development , 45(6), 703–711. https://doi.org/10.1007/s10578-014-0439-5
- Lai, K. Y. C. , Luk, E. S. L. , Leung, P. W. L. , Wong, A. S. Y. , Law, L. , & Ho, K. (2010). Validation of the Chinese version of the Strengths and Difficulties Questionnaire in Hong Kong. Social Psychiatry and Psychiatric Epidemiology , 45(12), 1179–1186. https://doi.org/10.1007/s00127-009-0152-z
- Lalkhen, A. G. , & McCluskey, A. (2008). Clinical tests: Sensitivity and specificity. BJA Education , 8(6), 221–223. https://doi.org/10.1093/bjaceaccp/mkn041
- Lappalainen, K. , Savolainen, H. , Sointu, E. T. , & Epstein, M. H. (2014). Cross-informant agreement and stability of the Strengths and Difficulties Questionnaire among Finnish mainstream and special education students. International Journal of School & Educational Psychology , 2(1), 24–34. https://doi.org/10.1080/21683603.2013.848177
- Lehmann, S. , Havik, O. , Havik, T. , & Heiervang, E. (2013). Mental disorders in foster children: A study of prevalence, comorbidity and risk factors. Child and Adolescent Psychiatry and Mental Health , 7(1), 39. https://doi.org/10.1186/1753-2000-7-39
- Lehmann, S. , Heiervang, E. , Havik, T. , & Havik, O. (2014). Screening foster children for mental disorders: Properties of the Strengths and Difficulties Questionnaire. PLoS ONE , 9(7), e102134. https://doi.org/10.1371/journal.pone.0102134
- Li, J.-B. , Delvecchio, E. , Di Riso, D. , Lis, A. , & Salcuni, S. (2017). Early evidence of the Italian parent-report Strengths and Difficulties Questionnaire (SDQ-P). Child Psychiatry and Human Development , 48(2), 335–345. https://doi.org/10.1007/s10578-016-0646-3
- Liu, S.-K. , Chien, Y.-L. , Shang, C.-Y. , Lin, C.-H. , Liu, Y.-C. , & Gau, S. S.-F. (2013). Psychometric properties of the Chinese version of Strength and Difficulties Questionnaire. Comprehensive Psychiatry , 54(6), 720–730. https://doi.org/10.1016/j.comppsych.2013.01.002
- Lukumar, P. , Wijewardana, K. , Hermansson, J. , & Lindmark, G. (2008). Validity and reliability of Tamil version of Strengths and Difficulties Questionnaire self-report. The Ceylon Medical Journal , 53(2), 48–52. https://doi.org/10.4038/cmj.v53i2.23
- Malmberg, M. , Rydell, A.-M. , & Smedje, H. (2003). Validity of the Swedish version of the Strengths and Difficulties Questionnaire (SDQ-Swe). Nordic Journal of Psychiatry , 57(5), 357–363. https://doi.org/10.1080/08039480310002697
- Mason, W. A. , Chmelka, M. B. , & Thompson, R. W. (2012). Responsiveness of the Strengths and Difficulties Questionnaire (SDQ) in a sample of high-risk youth in residential treatment. Child & Youth Care Forum , 41(5), 479–492. https://doi.org/10.1007/s10566-012-9179-5
- Mathai, J. , Anderson, P. , & Bourne, A. (2002). The Strengths and Difficulties Questionnaire (SDQ) as a screening measure prior to admission to a child and mental health service (CAMHS). Advances in Mental Health , 1(3), 1–12. https://doi.org/10.5172/jamh.1.3.235
- Mathai, J. , Anderson, P. , & Bourne, A. (2004). Comparing psychiatric diagnoses generated by the Strengths and Difficulties Questionnaire with diagnoses made by clinicians. The Australian and New Zealand Journal of Psychiatry , 38(8), 639–643. https://doi.org/10.1080/j.1440-1614.2004.01428.x
- McIntyre, A. , & Keesler, T. Y. (1986). Psychological disorders among foster children. Journal of Clinical Child Psychology , 15(4), 297–303. https://doi.org/10.1207/s15374424jccp1504_2
- Mellor, D. (2004). Furthering the use of the Strengths and Difficulties Questionnaire: Reliability with younger child respondents. Psychological Assessment , 16(4), 396–401. https://doi.org/10.1037/1040-3590.16.4.396
- Mellor, D. , Cheng, W. , McCabe, M. , Ling, M. , Liu, Y. , Zhao, Z. , Fan, J. , You, M. , Zhang, F. , Sun, J. , Byrne, L. , & Xu, Y. (2016). The use of the SDQ with Chinese adolescents in the clinical context. Psychiatry Research , 246, 520–526. https://doi.org/10.1016/j.psychres.2016.10.034
- Mellor, D. , Wong, J. , & Xu, X. (2011). Interparent agreement on the Strengths and Difficulties Questionnaire: A Chinese study. Journal of Clinical Child and Adolescent Psychology , 53(40), 890–896. https://doi.org/10.1080/15374416.2011.614580
- Mieloo, C. , Raat, H. , van Oort, F. , Bevaart, F. , Vogel, I. , Donker, M. , & Jansen, W. (2012). Validity and reliability of the Strengths and Difficulties Questionnaire in 5–6 year olds: Differences by gender or by parental education? PLoS ONE , 7(5), e36805. https://doi.org/10.1371/journal.pone.0036805
- Mieloo, C. L. , Bevaart, F. , Donker, M. C. H. , van Oort, F. V. A. , Raat, H. , & Jansen, W. (2014). Validation of the SDQ in a multi-ethnic population of young children. European Journal of Public Health , 24(1), 26–32. https://doi.org/10.1093/eurpub/ckt100
- Moher, D. , Liberati, A. , Tetzlaff, J. , & Altman, D. G. (2009). Preferred reporting items for systematic reviews and meta-analyses: The PRISMA statement. PLoS Medicine6 , (e1000097). https://doi.org/10.1371/journal.pmed.1000097
- Moriwaki, A. , & Kamio, Y. (2014). Normative data and psychometric properties of the Strengths and Difficulties Questionnaire among Japanese school-aged children. Child and Adolescent Psychiatry and Mental Health, 8 , 8(1), 1. https://doi.org/10.1186/1753-2000-8-1
- Mukaka, M. M. (2012). Statistics corner: A guide to appropriate use of correlation coefficient in medical research. Malawi Medical Journal: The Journal of Medical Association of Malawi , 24(3), 69–71.
- Multon, K. D. (2010). Interrater reliability. In N. J. Salkind (Ed.), Encyclopedia of research design (pp. 627–629). Sage. https://doi.org/10.4135/9781412961288.n194
- Muris, P. , Meesters, C. , Eijkelenboom, A. , & Vincken, M. (2004). The self-report version of the Strengths and Difficulties Questionnaire: Its psychometric properties in 8- to 13-year-old non-clinical children. British Journal of Clinical Psychology , 43(4), 437–448. https://doi.org/10.1348/0144665042388982
- Muris, P. , Meesters, C. , & van den Berg, F. (2003). The Strengths and Difficulties Questionnaire (SDQ): Further evidence for its reliability and validity in a community sample of Dutch children and adolescents. European Child & Adolescent Psychiatry , 12(1), 1–8. https://doi.org/10.1007/s00787-003-0298-2
- Niclasen, J. , Teasdale, T. W. , Andersen, A. M. , Skovgaard, A. M. , Elberling, H. , & Obel, C. (2012). Psychometric properties of the Danish Strength and Difficulties Questionnaire: The SDQ assessed for more than 70,000 raters in four different cohorts. PLoS ONE , 7(2), e32025. https://doi.org/10.1371/journal.pone.0032025
- Obel, C., Arnfred, J., Svendsen, K., Breinholm, N., Langkilde, L. & Poulsen, S.H. (2016). Måling af mental sundhed med spørgeskemaet SDQ: Anvendelse af SDQ i Skolesundhed.dk. Aarhus: Center for Sundhedssamarbejde, Health, Aarhus Universitet. [The measurement of mental health with the SDQ questionnaire: Use of the SDQ in Skolesundhed.dk.]
- Pardeck, J. (1996). An ecological approach for social work intervention. Family Therapy , 23(3), 189–198.
- Payne, M. (2016). Modern social work theory (4th ed.). Oxford University Press.
- Posserud, M. B. , Ullebo, A. K. , Plessen, K. J. , Stormark, K. M. , Gillberg, C. , & Lundervold, A. J. (2014). Influence of assessment instrument on ADHD diagnosis. European Child & Adolescent Psychiatry , 23(4), 197–205. https://doi.org/10.1007/s00787-013-0442-6
- Reilly, C. , Atkinson, P. , Das, K. B. , Chin, R. F. , Aylett, S. E. , Burch, V. , … Neville, B. G. (2014). Screening for mental health disorders in active childhood epilepsy: Population-based data. Epilepsy Research , 108(10), 1917–1926. https://doi.org/10.1016/j.eplepsyres.2014.09.028
- Reiss, F. (2013). Socioeconomic inequalities and mental health problems in children and adolescents: A systematic review. Social Science & Medicine , 90, 24–31. https://doi.org/10.1016/j.socscimed.2013.04.026
- Richards, L. , & Wood, N. (2006). The mental health needs of looked after children in a local authority permanent placement team and the value of the Goodman SDQ. Adoption and Fostering , 30, 43–52. https://doi.org/10.1177/030857590603000206
- Rimvall, M. K. , Elberling, H. , Rask, C. U. , Helenius, D. , Skovgaard, A. M. , & Jeppesen, P. (2014). Predicting ADHD in school age when using the Strengths and Difficulties Questionnaire in preschool age: A longitudinal general population study, CCC2000. European Child & Adolescent Psychiatry , 23(11), 1051–1060. https://doi.org/10.1007/s00787-014-0546-7
- Ruchkin, V. , Koposov, R. , Vermeiren, R. , & Schwab-Stone, M. (2012). The Strengths and Difficulties Questionnaire: Russian validation of the teacher version and comparison of teacher and student reports. Journal of Adolescence , 35(1), 87–96. https://doi.org/10.1016/j.adolescence.2011.06.003
- Salayev, K. , Rustamov, I. , Gadjiyeva, N. , Salayev, R. , & Sanne, B. (2016). The discriminative ability of the Azeri version of the Strengths and Difficulties Questionnaire in outpatient practice. Community Mental Health Journal , 52(8), 1106–1112. https://doi.org/10.1007/s10597-014-9791-y
- Samad, L. , Hollis, C. , Prince, M. , & Goodman, R. (2005). Child and adolescent psychopathology in a developing country: Testing the validity of the Strengths and Difficulties Questionnaire (Urdu version). International Journal of Methods in Psychiatric Research , 14(3), 158–166. https://doi.org/10.1002/mpr.3
- Sawyer, M. G. , Carbone, J. A. , Searle, A. K. , & Robinson, P. (2007). The mental health and wellbeing of children and adolescents in home-based foster care. Medical Journal of Australia , 186(4), 181–184. https://doi.org/10.5694/j.1326-5377.2007.tb00857.x
- Schmid, M. , Goldbeck, L. , Nuetzel, J. , & Fegert, J. M. (2008). Prevalence of mental disorders among adolescents in German youth welfare institutions. Child and Adolescent Psychiatry and Mental Health , 2(1), 2. https://doi.org/10.1186/1753-2000-2-2
- Sharp, C. , Venta, A. , Marais, L. , Skinner, D. , Lenka, M. , & Serekoane, J. (2014). First evaluation of a population-based screen to detect emotional-behavior disorders in orphaned children in Sub-Saharan Africa. AIDS and Behavior , 18(6), 1174–1185. https://doi.org/10.1007/s10461-014-0739-6
- Shevlin, M. , Murphy, S. , McElearney, A. , O’Kane, D. , Tracey, A. , & Adamson, G. (2012). Confirmatory factor analysis of adolescent self- and informant ratings of the Strengths and Difficulties Questionnaire. Irish Journal of Psychology , 33(1), 17–28. https://doi.org/10.1080/03033910.2011.649569
- Silva, T. B. F. , Osório, F. L. , & Loureiro, S. R. (2015). SDQ: Discriminative validity and diagnostic potential. Frontiers in Psychology , 6(6), 811. https://doi.org/10.3389/fpsyg.2015.00811
- Stone, L. L. , Otten, R. , Engels, R. C. M. E. , Vermulst, A. A. , & Janssens, J. M. A. M. (2010). Psychometric properties of the parent and teacher versions of the Strengths and Difficulties Questionnaire for 4- to 12-year-olds: A review. Clinical Child and Family Psychology Review , 13(3), 254–274. https://doi.org/10.1007/s10567-010-0071–2
- Stringaris, A. , & Goodman, R. (2013). The value of measuring impact alongside symptoms in children and adolescents: A longitudinal assessment in a community sample. Journal of Abnormal Child Psychology , 41(7), 1109–1120. https://doi.org/10.1007/s10802-013-9744-x
- Sveen, T. H. , Berg-Nielsen, T. S. , Lydersen, S. , & Wichstrom, L. (2013). Detecting psychiatric disorders in preschoolers: Screening with the Strengths and Difficulties Questionnaire. Journal of the American Academy of Child and Adolescent Psychiatry , 52(7), 728–736. https://doi.org/10.1016/j.jaac.2013.04.010
- Sveen, T. H. , Berg-Nielsen, T. S. , Lydersen, S. , & Wichstrøm, L. (2016). Screening for persistent psychopathology in 4-year-old children. Pediatrics , e20151648(4). https://doi.org/10.1542/peds.2015-1648
- Terwee, C. B. , Mokkink, L. B. , Knol, D. L. , Ostelo, R. W. , Bouter, L. M. , & de Vet, H. C. (2012). Rating the methodological quality in systematic reviews of studies on measurement properties: A scoring system for the COSMIN checklist. Quality of Life Research , 21(4), 651–657. https://doi.org/10.1007/s11136-011-9960-1
- van den Heuvel, M. , Jansen, D. E. M. C. , Stewart, R. E. , Smits-Engelsman, B. C. M. , Reijneveld, S. A. , & Flapper, B. C. T. (2017). How reliable and valid is the teacher version of the Strengths and Difficulties Questionnaire in primary school children? PLoS ONE , 12(4), 1–12. https://doi.org/10.1371/journal.pone.0176605
- van Widenfelt, B. M. , Goedhart, A. W. , Treffers, P. D. A. , & Goodman, R. (2003). Dutch version of the Strengths and Difficulties Questionnaire (SDQ). European Child & Adolescent Psychiatry , 12(6), 281–289. https://doi.org/10.1007/s00787-003-0341-3
- Wolpert, M. , Görzig, A. , Deighton, J. , Fugard, A. , Newman, R. , & Ford, T. (2015). Comparison of indices of clinically meaningful change in child and adolescent mental health services: Difference scores, reliable change, crossing clinical thresholds and ‘added value’ – An exploration using parent rated scores on the SDQ. Child and Adolescent Mental Health , 20(2), 94–101. https://doi.org/10.1111/camh.12080
- Wright, H. , Wellsted, D. , Gratton, J. , Besser, S. J. , & Midgley, N. (2019). Use of the Strengths and Difficulties Questionnaire to identify treatment needs in looked-after children referred to CAMHS. Developmental Child Welfare, 2 , 159–176. https://doi.org/10.1177/2516103218817555
- Yao, S. , Zhang, C. , Zhu, X. , Jing, X. , McWhinnie, C. M. , & Abela, J. R. Z. (2009). Measuring adolescent psychopathology: Psychometric properties of the self-report Strengths and Difficulties Questionnaire in a sample of Chinese adolescents. Journal of Adolescent Health , 45(1), 55–62. https://doi.org/10.1016/j.jadohealth.2008.11.006