
 ?Mathematical formulae have been encoded as MathML and are displayed in this HTML version using MathJax in order to improve their display. Uncheck the box to turn MathJax off. This feature requires Javascript. Click on a formula to zoom.
Abstract
Objective
To evaluate the early stages of the setting process of chemically activated restorative glass-ionomer cements (GICs).
Material and methods
Five GICs were evaluated (n = 5): Equia Forte (GC), Equia Forte HT (GC), Ketac Universal (3M ESPE), Maxxion R (FGM) and Riva Self Cure (SDI) by Thermography, Fourier Transform Infrared Attenuated Total Reflectance Spectroscopy (FTIR-ATR) and Gillmore needle indentation mechanical testing. The FTIR-ATR spectra showed the formation of metal carboxylates within the cements and enabled the stabilization time (ST) to be determined and the thermographic camera measured the temperature field images in the sample. Data were statistically analyzed by ANOVA and Tukey–Kramer (α = 5%).
Results
The Gillmore needle test showed that the order of hardening was opposite to the order of ST values determined by FTIR. The results with the thermographic camera showed two stages of temperature variation, which coincided with the evolution of specific infrared bands. The exception was Maxxion R, which showed only a single step change in temperature.
Conclusion
The early stages of the GIC setting reaction show temperature changes, both endothermic and exothermic, at specific times, confirming the occurrence of individual chemical reactions. The early setting involves reactions other than carboxylate formation.
Significance: This study gives further detail of the early stages of the setting of GICs, and past research regarding the setting reaction of GIC.
1. Introduction
Glass-ionomer cements (GICs) have been widely used in dentistry since their introduction in the early 70 s [Citation1]. Their main advantages include biocompatibility towards tooth tissue [Citation2], fluoride release [Citation3,Citation4], adhesion to dental structure [Citation5,Citation6], and low coefficient of linear thermal expansion [Citation7].
The GIC was developed essentially by combining the type of glass powder used in the dental silicate cement with the polyacrylic acid solution used the zinc polycarboxylate [Citation8]. However, the invention was not the result of straightforward mixing of the individual components, mainly because the dental silicate glass is not basic enough to form a viable cement with polyacrylic acid [Citation8,Citation9]. Instead, it needed a series of innovative steps, the first of which was to create a more basic glass. This was followed quickly by the discovery that including tartaric acid in the mixture led to cement with a sharp set and good mechanical properties [Citation8].
The initial reaction, after cement mixing, is an acid-base reaction between an aqueous polymeric acid solution and an ion-leachable basic glass powder [Citation10,Citation11]. When mixed with the liquid, the glass powder degrades so that Ca2+ or Sr2+ and Al3+ ions are released. These ions interact with carboxylate groups on the polymer chain, causing cross-linking and initial hardening. The setting reaction occurs rapidly, usually in the first minutes [Citation12]. The final cement includes a substantial amount of unreacted glass particles acting as reinforcing fillers in the polymer matrix [Citation10,Citation13]. There is a further possibility for improving the properties of these materials to make them still more competitive compared with other restorative systems. Knowledge of the sequences of the setting reaction in dental cements is therefore crucial, as they will affect the handling and final physical properties of the cements [Citation13].
According to ISO 9917-1 [Citation14], restorative GICs should have hardening times in the range of 1.5–6 min. However, the fact that hardening occurs in a short period of time, does not mean that the material has reached full chemical stability. Although the formation of metal carboxylate groups seems to be complete relatively quickly, that is, around 150 min [Citation6], there are additional longer-term reactions that lead to the gradual development of improved mechanical properties [Citation12]. There is also a change in translucency over this time, as well as an increase in the ratio of bound to unbound water.
In recent years, the setting, maturation, and structure of glass-ionomers have been studied with sophisticated techniques such as TeraHertz spectroscopy [Citation15], quasi-elastic neutron scattering [Citation16,Citation17], and micro-computed tomography [Citation16,Citation18]. These have indicated that there is a gradual increase in hydration of the polyacrylic component with time within the freshly set cement, and also a gradual reduction in pore size [Citation16,Citation17]. This latter is an important observation and may be one of the reasons for the improvement in mechanical strength with maturation. Strength is influenced by the presence of pores, and as cements fail, cracks grow by linking the pores until a complete fracture occurs [Citation19]. Hence, any process that reduces the overall size of the pores will cause improvements in strength.
Despite the importance of these longer-term effects, the major variation in the material is generally considered to occur just after its preparation. The fact that the reactions occurring at this stage are fast imposes limitations on the ability to follow the setting chemistry, especially in the first few seconds of the process. The present study addresses this problem by examining the very early stages of the dynamics of the cement setting process (i.e. down to about 20 s after the beginning of mixing). It focuses on the stabilization time of the metal carboxylate bonds formed within the GICs and their relationship with hardening time. This is of clinical relevance as the stabilization time is related to the overall speed of setting, and setting speed influences the strength of the set material, with more rapidly setting materials generally being stronger [Citation11]. In its turn, the strength affects the longevity of the restoration, so this aspect is of importance in determining the clinical success of these materials. The null hypothesis is that the stabilization time of the metal carboxylate bonds formed within the GICs is coincident with its hardening time.
2. Materials and methods
2.1. Specimen preparation
Measurements were performed in vitro using 5 commercially available restorative GICs (n = 5) (). The encapsulated materials were handled in a mechanical mixer (SDI, Victoria, Australia) for 10 s. After this time, it took approximately 10 s to start the measurements. In order to maintain the same stirring standards and mixing time, MR powder and liquid were inserted into a capsule, maintaining the same ratio recommended by the manufacturer.
Table 1. Brands and composition of restorative GICs tested (data provided by manufacturers).
2.2. Thermographic camera
A thermographic camera (7300, Infratec, Dresden, Germany), which operates in the wavelength range from 2 to 5.7 µm, was mounted upright and the sample was positioned in its lens focal position of 25 cm. Possible temperature measurements of this camera range from −40 °C to 300 °C, with a resolution of ±0.002 °C. Measurements were performed at room temperature, around 25 °C. The samples were placed on a waterproof paper suitable for GIC handling (SDI, Victoria, Australia). It took approximately 20 s from the starting time of the beginning of the powder/liquid mixture to the first data acquisition. The measurement of each material lasted 30 min with each image taken in intervals of 0.3 s, using the IRBIS® 3 software (Infratec, Dresden, Germany). The same software calculated the average temperature variations of the samples (n = 5) of each material.
2.3. Fourier transform infrared attenuated total reflectance spectroscopy (FTIR-ATR)
The GICs spectra and their precursors, powder and liquid, were obtained using a Fourier Transform Infrared Spectrometer (FTIR) with Attenuated Total Reflectance attachment (ATR) (Vertex 70v, Bruker Optik GmbH, Ettlingen, Germany) with a diamond ATR crystal. Samples of each material (n = 5) were placed directly on the crystal and the first spectrum was also collected approximately 20 s after the starting time of the beginning of the powder/liquid mixture. After that, each spectrum was collected every 10 s for 30 min, with 10 scans, resolution of 4 cm−1, and the spectral region of 4000–400 cm−1, without vacuum.
2.3.1. Principal component analysis (PCA)
PCA is a multivariate analysis tool that was applied to the FTIR-ATR spectra in order to reduce the dimensionality of a data set [Citation20]. FTIR-ATR spectra were baseline corrected, treated using the first derivative with the first-order polynomial procedure, and applied to PCA using a computer code developed in the software Mathematica 7.0 (Wolfram Research, Illinois, USA). A multivariate statistics package was used for a simplified and comprehensive two-dimensional view of the process dynamics of chemical bonding of GICs.
2.3.2. Chemical bond stabilization time
Chemical bond stabilization time (τ) for the metal carboxylate groups was obtained by the first component of PCA analysis of the FTIR-ATR spectra with an exponential decay function (EquationEquation (1)(1) ):
(1)
In which y(t) is the FTIR-ATR spectral variation as a function of time after the beginning of the reaction, obtained by the PCA method. Here, y0 is spectral variation value when the material reached stabilization, y(t) the spectral variation with time, t the instant times of the measurements, and τ the characteristic decay time representing the instant t when the spectral variation values decay to 1/e (approximately 37% of y(0) value).
2.4. Hardening time
GICs hardening time measurements followed the recommendation of the ISO 9917-1:2007 standard [Citation14]. A stainless-steel matrix with an 8 mm diameter central hole was placed on waterproof paper and positioned under a 400 ± 5 g Gillmore needle. The cement was inserted into the matrix and, after 90 s, the indentator was carefully lowered onto the cement surface and left there for 5 s. The indentations were performed at 30 s intervals and, as the cement began to harden, the intervals between indentations were reduced to 10 s. Hardening time was determined when no circular marks were observed on the material surface (n = 5).
2.5. Statistical analysis
Comparison between different glass-ionomer cements temperatures, stabilization of chemical bonds, and hardening time was analyzed by ANOVA and Tukey–Kramer (α = 5%).
3. Results and discussion
The null hypothesis was rejected once materials with shorter hardening times measured by mechanical test had longer stabilization times of metal carboxylate bonds formed within the GICs evaluated by Spectroscopy.
Initially, to compare the compositions of different GICs, the precursor (powder and liquid) spectra for each material assessed by FTIR-ATR technique are shown in Supplementary Figure 1. The GIC liquid is a solution of polymeric acid with carboxylic acid functional groups (–COOH). This is shown by the intensity of the band at 1700 cm−1. The most widely used acid in GICs is polyacrylic acid [Citation11], though a variety of other polymers have been studied since this acid was first reported [Citation21], and a number of commercial materials employ acrylic/maleic acid copolymer [Citation11]. These polymers are typically used in solution, though some may also be present in the powder along with the glass. Setting requires any such polymer powder to dissolve in the aqueous phase in order to undergo reaction and tartaric acid may also be present in the aqueous component. The presence of these compounds is identified in the spectra.
The spectra of the powders demonstrate intensive absorption bands in the region of 900–1400 cm−1, which generally represents a superposition of some bands situated close to each other and assigned to the stretching vibration of SiO4 tetrahedral [Citation22]. The essential properties of glasses for use in GICs are that they must be basic and able to react with acid aqueous solutions [Citation23].
This basicity can be explained in terms of the random network model [Citation24], where the glass is considered to be a random assembly of SiO4 tetrahedra, which are joined at the corners. When silica is the only component, the resulting structure is electronically neutral and has no basic character. However, when alumina is present, this changes. In the presence of sufficient silica, alumina is forced to adopt the tetrahedral geometry of the SiO4 units. However, since aluminum possesses only three positive charges compared with four for silicon, as a consequence the resulting structure has an overall negative charge [Citation25]. To overcome this charge deficiency, additional positive ions (Na+, Ca2+) are needed. These render the resulting glass susceptible to acid attack, as required for their role in glass-ionomer cements [Citation12,Citation23,Citation25].
Next, tests that allowed the monitoring of changes of chemical bonds over time were performed, showing that the GICs spectra are changed after mixing the precursors (powder and liquid) and during the hardening process shown in . These curves represent the spectra at 20 s and 1800 s, at the beginning and final recorded times of the reaction, respectively. The insert represents the whole spectral change with time for the EF cement. The respective dynamics of the spectral changes for all five cements are shown in Supplementary Videos 1–5. It is noted that, although the powder and liquid spectra show essentially similar behaviors between the different materials (), after mixing, the arrangement of the samples in the plot shows that the cement spectra presented significant differences. The loading of PC1 for HT cement represents the regions responsible for the largest variation during the setting process. It was possible to identify the bands that contributed most to the spectral variation as a function of time () [Citation6,Citation21,Citation22,Citation26,Citation27].
Figure 1. FTIR-ATR spectral variation of different GICs obtained as a function of the reaction time: (A) at 20 s and (B) at 1800 s, the load spectrum of the first main component PC1 is shown below, which shows the region that most contributed to the spectral variation as a function of time. Respective PC1 X PC2 scores (C, D) are shown on the right side. The insert shows an example for the whole spectral change with time, between 1800 and 900 cm−1, for the EF cement.
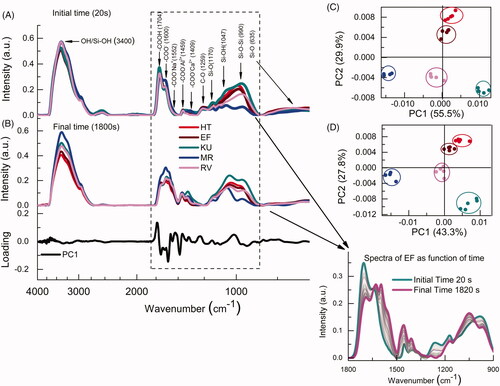
The plot of PC1 × PC2 scores representing the overall statistical difference between the spectra of the five studied cements are shown in . The plots of PC1 × PC2 scores () at 1800s confirm that despite the final spectra differed significantly from the initial ones for all GICs, each group remained clustered, showing low relative variability of the five measurements in each material. In summary, although visually similar, the samples are statistically discriminated in the PCA technique, both for the initial time (20 s) and for the final time (1800s). The setting reaction tends to a reduction in the number of –COOH groups (1704 cm−1) as they set and reorganize as COO− groups (1550–1640 cm−1) [Citation28]. It is possible to observe through the loading graph that these two bands change considerably during the setting. The cement should be placed in the cavity during the initial stage of setting while there are still free carboxylic acid groups present. At this stage, the cement is plastic and can be deformed into shape, and sufficient acid groups are remaining to all a chemical bond to form between the cement and the tooth [Citation6].
The time evolution of PC1 values is shown in , which represents an average of five measurements in each material. The curve fitting using EquationEquation (1)(1) allowed us to obtain the time in which chemical bonds stabilize. It can be seen that the RV reaction presented different behavior at the beginning of the curves compared with the other studied cements. After a slow initial behavior, RV has a faster chemical bonds stabilization time (τ) in seconds (393 ± 58), followed by MR (632 ± 94), EF (709 ± 36), HT (740 ± 35), and KU (747 ± 92).
Figure 2. (A) Curve representing the time evolution for the values of PC1 in the PCA analysis calculated from the FTIR-ATR. Each curve is an average of five independent measurements (n = 5). The exponential fitting with EquationEquation (1)(1) provided the stabilization time of chemical bonds (τ) of the GICS; (B) Comparison between the hardening times and the stabilization times.
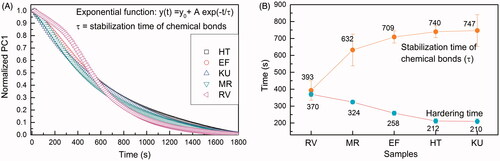
The hardening times evaluated by the Gillmore needle indentation test can be seen in . Indentations tests are usually used to evaluate the setting characteristics of the cements. However, these methods evaluate the initial superficial strength of the cements once they assess the point when the setting cement has sufficient resistance to indentation [Citation14]. It is important to note that the ability of the cement to resist indentations has a limited clinical relevance once indentation from a small area point load cannot reflect the forces applied to the material used to restore a dental cavity and do not provide insight into the kinetics of the setting reaction.
The opposite tendency with time was observed for all five cements studied (). It is worth noting that the hardening time of material evaluated employing indentations tests and presented in the package by the manufacturer (setting time) is different from the time to reach chemical bonds stability (completely reacted), which was measured by τ in the present study. From the clinical point of view, the faster the material sets, the less susceptible it will be to fracture by early mastication on it.
The differences between these two test results may be explained by the occurrence of an ion-based secondary setting process that is not detectable in the infrared region. This reaction was first proposed several years ago [Citation29] and has been confirmed by the fact that cements having strength and insolubility can be prepared from either acetic (ethanoic) or lactic acids reacting with ionomer glasses [Citation29,Citation30]. In fast-setting cements, this inorganic network forms more rapidly and interferes with the diffusion of the necessary species for the later part of the organic setting reaction, that is, carboxylate formation. This results in a longer stabilization time. Conversely, in a slow setting cement, the inorganic network forms more slowly, and the reaction of the organic components remains unhindered for longer. Consequently, stabilization time is shorter.
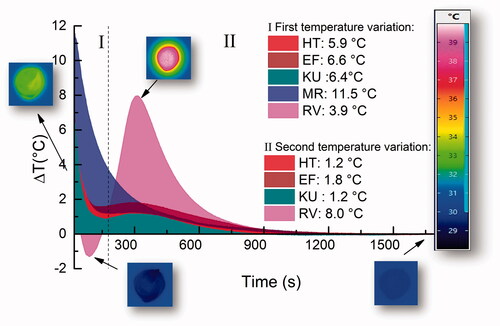
The variation in temperature as a function of time obtained using the thermographic camera is presented in . Each curve represents a mean of five samples. The materials RV, EF, HT, and KU showed two stages of temperature variation, while MR showed only one. MR was the material that gave the largest temperature variation (11.5 °C), which then slowly decreased, while the other glass-ionomers had temperature variations between 3.9 °C to 6.6 °C at the first stage, followed by a rapid decrease. This was followed by a second event, which started after about 3 min and gave a temperature rise of up to 8 °C, followed by a gradual decrease. The dynamics of the changes in temperature (thermographic images) for all five cements are shown in the respective inset of Supplementary Videos 1–5.
Figure 3. GICs temperature variation as a function of time. The inserts exemplify images obtained by the thermographic camera at specific instants of the reaction.
shows both the temperature variation for RV obtained with the thermographic camera and the most significant FTIR-ATR bands change provided by the PC1 loading. Supplementary Figures 2–5 show these results for the other four materials. In this way, it was possible to evaluate simultaneously the variation in temperature and the occurrence of chemical reactions at each specific time interval to form the GIC.
Figure 4. (A) Comparison between the temperature variation of RV and the evolution of the bands as a function of time; (B) schematic illustration of possible sequences of the reaction. (I) First stage of the reaction, which is the acid hydrolysis on the glass particles surfaces; (II) second stage representing the ion release to the matrix.
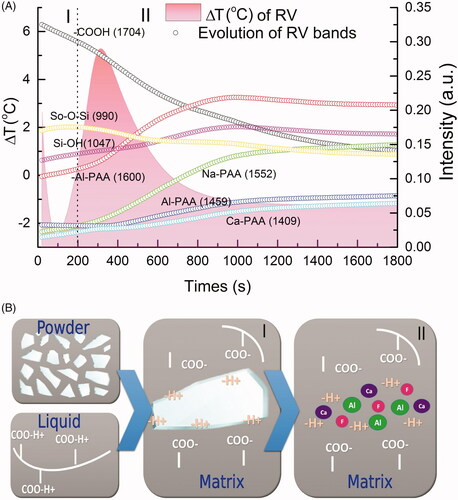
These results suggest that the initial setting reaction of the GICs occurs in two stages. These are illustrated in . These stages are as follows: First, immediately after mixing, the cement liquid dissolves the outer layer of the glass particles by acid hydrolysis [Citation11], leading to the observed changes at 1700 cm−1 (–COOH) and 990 cm−1 (Si–O), notably the reduction in the peak at 990 cm−1. The change in intensity of the band at 1047 cm−1 is further evidence of the decomposition of the glass network [Citation26]. In this stage, the temperature goes down due to the endothermic process of breaking bonds between ions on the glass surface. This stage lasts between 100–200 s, depending on the material ().
Next, the second stage occurs. This involves the ions released from the glass binding to the carboxylate groups on the polymer. This results in the formation of carboxylate salts and these show infrared bands in positions that are diagnostic [Citation31]. The bands of interest are due to the asymmetric carbonyl stretch and they are as follows: 1552 cm−1 (sodium carboxylate), 1459 cm−1 (aluminum carboxylate), 1550 cm−1 (strontium carboxylate) and 1409 cm−1 (calcium carboxylate), depending on the composition of the glass [Citation6,Citation32]. This ion-binding process is exothermic, and so there is a rise in temperature recorded for most materials. Once this process is complete, the material gradually cools down again ( and ).
In the case of MR, it seems that the two stages overlap and that this is the reason that there is a single temperature rise only. The fact that it is larger than the ones recorded for the other materials suggests that the formation of the carboxylate salts is particularly exothermic, which must be due to there being a relatively higher number of such groups formed in the available time.
It has also been shown that water is an important component in the setting reaction of GICs. The presence of water is important in the chemical reaction as it aids in the movement of ions from the glass surface to form compounds with the carboxylic groups of acid [Citation11]. During the setting of the GIC, the amount of bound water in the matrix also increases. The matrix contains a degree of unbound water, hence the necessity for avoiding dehydration or desiccation in the first minutes [Citation33]. The cement obtained at the end of the reaction has in its constitution glassy particles coated with a layer of silica gel that is present in the formed polyacrylate salt matrices [Citation13].
The results we have obtained show that the different cement samples have different stabilization times for their metal carboxylate bonds (). The setting speed and final resistance of GICs to dissolution are influenced by the molecular weight of polymer or copolymer, polymer concentration, and powder/liquid ratio [Citation34]. Previous studies have shown that when the particle size of glass is reduced, particle reactivity increases considerably [Citation10,Citation35]. The reduced particle size and high powder/liquid ratio cause the cement to be considered ‘high viscosity’. In the present study, MR is the only material that is not high viscosity GIC (1.5:1 P/L ratio), and this may be why it sets differently in terms of temperature profile and speed of bond stabilization.
GICs, after mixing, go through a rapid initial setting reaction but continue to undergo changes in internal chemistry for some time [Citation12]. In our study, the hardening-time correlated with the time for the aluminum carboxylate peak (1459 cm−1) to appear, suggesting that aluminum carboxylate plays a key role in the hardening of the cements. Early release of aluminum from the glass appears necessary for faster setting times [Citation11,Citation25], a finding that is consistent with the fact that higher levels of alumina give more basic glasses [Citation23].
Our studies have also considered the temperature changes that occur with the setting. Results indicate that, for most of the cements examined, there are two distinct steps in the early stages of setting. One is characterized by an endotherm and is attributed to an attack on the glass surface leading to disruption of the network and release of ions. The other is characterized by an exotherm and is attributed to the formation of predominantly ionic bonds in the form of metal carboxylate units. These steps can be correlated with the infrared spectra and their timings related to the bond stabilization times observed. To our knowledge, this is the first time that these steps have been related, and also the first indication that the initial step of the reaction is endothermic.
4. Conclusion
Our studies have shown that the time for the carboxylate bond formation to stabilized in setting glass-ionomers is inversely correlated with setting time as determined by the Gilmore Needle indentation test. The latter is effectively a rheological test and measures the time to the setting of the overall cement. When this is rapid, bond stabilization is slow and, conversely, when it is slow, stabilization is rapid. We attribute this discrepancy to the occurrence of an additional setting reaction that does not show in the region of the infrared spectrum examined. This has previously been identified as the formation of an inorganic network from species leached from the glass, of which phosphate appears the most important in forming hard, insoluble cements. Early formation of such a network causes clear setting as determined by indentation, but reduces the mobility of the organic components within the cement, thereby extending stabilization time for metal carboxylate bonds. Temperature changes that occur with the setting are generally consistent with the setting being a two-step process. The initial step is an attack on the glass by the protons from the acid, leading to extraction of key ions, and is endothermic. The second step is a reaction of these liberated metal ions with carboxylate groups to form metal carboxylates, an exothermic process. These distinctive steps and their associated energy changes have not been identified previously.
Supplemental Material
Download MP4 Video (431.6 KB)Supplemental Material
Download MP4 Video (677.4 KB)Supplemental Material
Download MP4 Video (452.6 KB)Supplemental Material
Download MP4 Video (540.2 KB)Supplemental Material
Download MP4 Video (466.5 KB)Supplemental Material
Download JPEG Image (4.1 MB)
Supplemental Material
Download JPEG Image (3.7 MB)
Supplemental Material
Download JPEG Image (4 MB)
Supplemental Material
Download JPEG Image (3.7 MB)
Supplemental Material
Download MS Word (190.3 KB)Disclosure statement
No potential conflict of interest was reported by the author(s).
Additional information
Funding
References
- Wilson AD, Kent BE. A new translucent cement for dentistry. The glass ionomer cement. Br Dent J. 1972;132(4):133–135.
- Sidhu SK, Schmalz G. The biocompatibility of glass-ionomer cement materials. A status report for the American Journal of Dentistry. Am J Dent. 2001;14(6):387–396.
- Wiegand A, Buchalla W, Attin T. Review on fluoride-releasing restorative materials-Fluoride release and uptake characteristics, antibacterial activity and influence on caries formation. Dent Mater. 2007;23(3):343–362.
- Khudanov BO, Abdullaev JR, Bottenberg P, et al. Evaluation of the fluoride releasing and recharging abilities of various fissure sealants. Oral Heal Prev Dent. 2018;16:195–202.
- Nicholson JW. The history and background to glass-ionomer dental cements. In: Sidhu SK, editor. Glass-ionomers in dentistry. Cham (Switzerland): Springer; 2016. p. 1–24.
- Yamakami SA, Ubaldini ALM, Sato F, et al. Study of the chemical interaction between a high-viscosity glass ionomer cement and dentin. J Appl Oral Sci. 2018;26:e20170384.
- Collado-González M, Pecci-Lloret MR, Tomás-Catalá CJ, et al. Thermo-setting glass ionomer cements promote variable biological responses of human dental pulp stem cells. Dent Mater. 2018;34(6):932–943.
- Wilson AD. A hard decade’s work: steps in the invention of the glass-ionomer cement. J Dent Res. 1996;75(10):1723–1727.
- Nicholson JW. Adhesion of glass-ionomer cements to teeth: a review. Int J Adhes Adhes. 2016;69:33–38.
- De Caluwé T, Vercruysse CWJ, Fraeyman S, et al. The influence of particle size and fluorine content of aluminosilicate glass on the glass ionomer cement properties. Dent Mater. 2014;30(9):1029–1038.
- Sidhu S, Nicholson J. A review of glass-ionomer cements for clinical dentistry. J Funct Biomater. 2016;7(3):16.
- Nicholson JW. Maturation processes in glass-ionomer dental cements. Acta Biomater Odontol Scand. 2018;4(1):63–71.
- El Cheikh A, Pellen F, Le Jeune B, et al. Monitoring the curing kinetics of glass ionomer cements by modeling the temporal correlation of speckle images. Appl Opt. 2019;58(28):7878–7883.
- International Organization for Standardization. Dentistry – water based cements. Part 1: powder/liquid acid-based cements. Geneva (Switzerland): ISO; 2007. (ISO 9917-1:2007).
- Tian KV, Yang B, Yue Y, et al. Atomic and vibrational origins of mechanical toughness in bioactive cement during setting. Nat Commun. 2015;6:8631.
- Benetti AR, Jacobsen J, Lehnhoff B, et al. How mobile are protons in the structure of dental glass ionomer cements? Sci Rep. 2015;5:8972.
- Berg MC, Benetti AR, Telling MTF, et al. Nanoscale mobility of aqueous polyacrylic acid in dental restorative cements. ACS Appl Mater Interfaces. 2018;10(12):9904–9915.
- Berg MC, Jacobsen J, Momsen NCR, et al. Water dynamics in glass ionomer cements. Eur Phys J Spec Top. 2016;225(4):773–777.
- Tian KV, Nagy PM, Chass GA, et al. Qualitative assessment of microstructure and Hertzian indentation failure in biocompatible glass ionomer cements. J Mater Sci Mater Med. 2012;23(3):677–685.
- Varmuza K, Filzmoser P. Introduction to multivariate statistical analysis in chemometrics. Oxfordshire (UK): Taylor & Francis; 2009.
- Young AM. FTIR investigation of polymerisation and polyacid neutralisation kinetics in resin-modified glass-ionomer dental cements. Biomaterials. 2002;23(15):3289–3295.
- Fareed MA, Stamboulis A. Nanoclay addition to a conventional glass ionomer cements: influence on physical properties. Eur J Dent. 2014;08(04):456–463.
- Hill RG, Wilson AD. Some structural aspects of glasses used in ionomer cements. Glas Technol. 1988;29:150–159.
- Zachariasen WH. The atomic arrangement in glass. J Am Chem Soc. 1932;54(10):3841–3851.
- Nicholson JW, Czarnecka B. Review paper: role of aluminum in glass-ionomer dental cements and its biological effects. J Biomater Appl. 2009;24(4):293–308.
- Crisp S, Pringuer MA, Wardleworth D, et al. Reactions in glass ionomer cements: II. An infrared spectroscopic study. J Dent Res. 1974;53(6):1414–1419.
- Menezes-Silva R, de Oliveira BMB, Fernandes PHM, et al. Effects of the reinforced cellulose nanocrystals on glass-ionomer cements. Dent Mater. 2019;35(4):564–573.
- Talal A, Tanner KE, Billington R, et al. Effect of ultrasound on the setting characteristics of glass ionomer cements studied by Fourier transform infrared spectroscopy. J Mater Sci Mater Med. 2009;20(1):405–411.
- Wasson EA, Nicholson JW. New aspects of the setting of glass-ionomer cements. J Dent Res. 1993;72(2):481–483.
- Nicholson JW, Tawfik H, Czarnecka B. A study of cements formed by aqueous lactic acid and aluminosilicate glass. J Mater Sci Mater Med. 2002;1:417–419.
- Mehrotra RC, Bohra R. Metal carboxylates. New York (NY): Academic Press; 1983.
- Deb S, Nicholson JW. The effect of strontium oxide in glass-ionomer cements. J Mater Sci Mater Med. 1999;10(8):471–474.
- Okada K, Tosaki S, Hirota K, et al. Surface hardness change of restorative filling materials stored in saliva. Dent Mater. 2001;17(1):34–39.
- Algera TJ, Kleverlaan CJ, Prahl-Andersen B, et al. The influence of environmental conditions on the material properties of setting glass-ionomer cements. Dent Mater. 2006;22(9):852–856.
- Prentice LH, Tyas MJ, Burrow MF. The effect of particle size distribution on an experimental glass-ionomer cement. Dent Mater. 2005;21(6):505–510.