
ABSTRACT
While the COVID-19 crisis is taking an economic toll, none of us know the magnitude of it. The objective of this paper is to provide some ballpark estimates for declines in sales taxes by simulating business revenue change in two subsectors most harshly hit during the crisis, retails, and food and accommodations. We apply for municipal governments in Ohio based on detailed locational information from the InfoGroup Historical Business Data. While every metropolitan area, as well as nonmetropolitan area, has winning and losing cities, smaller places dependent on apparel or automobile outlets, restaurants, and tourism can suffer as much as a half of sales tax. In the meantime, the largest cities seem to be affected moderately.
Introduction
The novel coronavirus disease (COVID-19) crisis is taking a huge economic toll. However, none of us can know the magnitude of it. We know that it will be, at least, an unprecedented scale. Already, unemployment claims reached 26 million in the 4 weeks up to 18 April 2020 (NYTimes, Citation2020). That figure itself will make the unemployment rate at 15.9% (Bureau of Labor Statistics [BLS], Citation2020). If we add the already unemployed 3.4% in January 2020, the minimum unemployment rate will be 19.3%.
In addition to this direct employment issue, cities and states will soon suffer from indirect effects, as their revenue will fall substantially. But how much? For instance, Keith Feber, the Auditor for the State of Ohio, told local governments to examine their finances and prepare for cuts of up to 20% (WOSU, Citation2020). This ratio may be a reasonable start. However, we do not know the magnitude of it, and it is urgent for policy makers of cities and states to know what their jurisdiction should be expecting. Notably, we should anticipate that some cities will be hit more than others. What kind of cities are more vulnerable, and how much of a cut should they expect? Any framework or ballpark will be helpful.
One way to examine is based on industrial composition. Recent data, albeit imperfectly, report that the retail and tourism sectors are most severely hit. Then, will cities with major shopping centers like Emeryville, California, across from San Francisco and between Oakland and Berkeley, be one of those vulnerable cities? Or Tyson’s Corner, Virginia, a small unincorporated city just outside of Washington, DC?
An analysis by Pagano and McFarland (Citation2020) was timely. By analyzing the 139 largest cities in the country, they proposed that cities with more reliance on elastic sources, such as income and sales tax, would suffer more, but cities with more reliance on property taxes would not. By identifying high-risk industries,Footnote1 they presented a rank of cities with immediate fiscal impacts. Interestingly, four of the top five cities with the most immediate fiscal impact are in Ohio: Columbus (1), Cincinnati (2), Toledo (4), and Cleveland (5). In particular, 76% of Columbus’s general fund comes from income-related taxes. The share of sales tax in general fund revenue in Oklahoma City is 54%. Other cities with heavy reliance on sales tax include Tulsa, Oklahoma; Lincoln, Nebraska; and Denver, Colorado.
While this analysis of the nation’s largest cities is important, those cities share similar traits. By definition, they have a large tax base and multiple industrial activities. A change in industrial activities, such as those in the retail and tourism sectors mentioned above, will not differentiate them substantially. They are the primary city of a metropolitan area defined by the Office of Management and Budget, and a geographic analysis of central versus outer cities becomes irrelevant.
We offer a more systematic analysis of various cities within a state in this article. We focus on Ohio, a state with 11.7 million inhabitants with multiple midsize metropolitan areas such as Cleveland, Columbus, and Cincinnati, small metropolitan areas such as Dayton, Toledo, and Youngstown, as well as rural areas. The presence of multiple metropolitan areas allows us to examine the context of central versus suburban.
As a background, the State of Ohio had a total revenue of 29.5 billion USD in the fiscal year 2019 (Ohio Department of Taxation, Citation2019). The largest source according to the Ohio Department of Taxation (Citation2019) was state sales tax (39.5% of revenue), along with local sales tax (8.9%). The next largest source was personal income tax at 31.5%, and the rest is from substantially smaller sources, such as commercial activity tax (6.6%), motor vehicle fuel tax (6.2%), and tobacco tax (3.1%). Therefore, a combined 45.4% of the general revenue comes directly from sales tax, and a decline in business revenue will substantially affect both the state and local governments.
Method
In order to simulate effects on business sales, we first use the data about changes in revenue by industrial sectors provided by the Department of Commerce.Footnote2 Between February and March 2020, the retail sector overall (codes 44–45 in NAICS) declined by 8.7%. However, there are distinctions within retail: clothing and accessory stores declined most (50.5%), along with furniture (26.8%) and motor vehicles (25.6%). In contrast, food and beverage stores gained 25.6%. General merchandise, which includes both traditional department stores, such as Macy’s and JC Penny, and newer big-box retailers with food items, such as Walmart and Target, also gained 6.4%. The other severely hit sector is accommodation and food (72 in NAICS). Food services (or restaurants) declined 26.5%, and accommodation (hotels) also declined 31.0%.Footnote3 At the same time, it is important to keep in mind that large subsectors in terms of sales are motor vehicles ($40 billion), food and beverage ($27 billion), building materials ($21 billion), and then food and drinking places ($20 billion). A breakdown of all subsectors is listed in under the column “% change.”
Table 1. Subsector breakdown
Our second step in simulating effects on business sales is to use InfoGroup’s Historical Business Data for the Ohio context. One of the most comprehensive private business databases, InfoGroup lists each establishment’s street-level address, eight-digit-level NAICS code, and an estimate of employment and revenue. The 2019 data in Ohio listed 81,265 establishments for the sectors of retail (44–45) and accommodation and food services (72), with an estimate of 1.2 million in employment and 189 USD billion in revenue or sales.Footnote4
The figures for the decline were only between February and March, and we unfortunately have no prospective information about the rest of the year. The outlook will most likely be worse for April and possibly May and later, but it is possible to see some recovery in later months. Here, we simply assume the rate of decline in March for the annual revenue of 2020. Our objective here is to set a benchmark to estimate a ballpark, not with precision. As we apply the changes by subsectors for the annual data, we project 9.7% decline in sales and a 14% decline in employment at the aggregate state level. With the detailed geographic information of the InfoGroup data, we then apply the data to the municipal level to observe the heterogeneity between them.
Analysis
As a background, we first assess the level of reliance on these two potentially high-risk subsectors (retail: 44–45, and food and accommodation: 72) over all business activities by places. Of 1,362 identified municipalities in Ohio,Footnote5 74 municipalities (5.5%) have no establishments in these two high-risk sectors, and an additional 429 (31.5%) have no business establishments at all. This leaves 858 municipalities for our analysis. There are 500 places (58.3%) with less than 20% dependence on these two subsectors and another 305 places (35.5%) with between 20% and 50% reliance. However, 53 places (6.2%) have more than 50% reliance, and they could potentially be vulnerable places ().
Figure 1. Histogram with cities reliant on retail (44–45) and food/accommodation (72) sectors
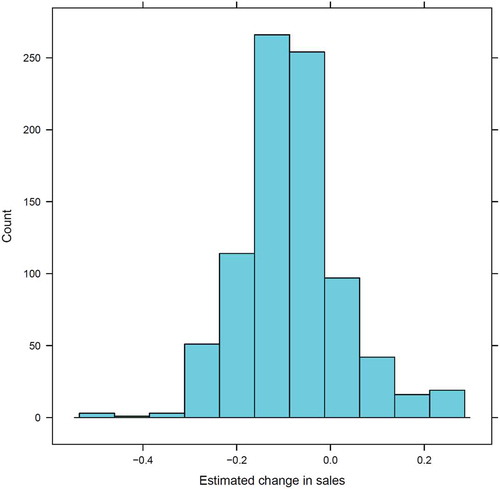
As we apply the subsector level change, the vast majority, 699 municipalities (81.5%), are projected to experience a revenue decline between 0.2% and 50.5%. Two municipalities will have no change in revenue. At the same time, 157 municipalities (18.3%) are projected to have a revenue increase, up to 25.6% if an area only has food and beverage stores. shows this distribution in a histogram.
Figure 2. Histogram of city sales change
Where are those cities with major declines or increases in revenue? lists the 10 worst declines, 10 highest increases, and 6 largest cities in Ohio. The severely damaged places, which may experience a 30–50% decline, are dispersed in different metropolitan and nonmetropolitan areas. All of these are very small municipalities with a population of less than 3,500. Most of these municipalities may have low household income around 30,000–40,000, USD while there are two villages with high household income: Bratenahl ($89,000) and Moreland Hills ($136,000), both of them around Cleveland. With the exception of Bratenahl, all other municipalities are relatively distant from the metropolitan center, 13–44 miles distant.
Table 2. Municipalities with most declines, highest increases, and largest cities in Ohio
The 10 places that may experience the most gain are also small places, with only grocery shops in retail activities, found in different metropolitan areas and nonmetropolitan areas; the Cincinnati and Dayton metropolitan areas have multiple of those. The population of these small places is less than 1,000, except for Pepper Pike near Cleveland (population 6,242) and Elmwood Place near Cincinnati (1,907). They may be only 10–12 miles from the metropolitan center, or as far as 60–80 miles. These places range from low household income in the 30,000 USDs, medium income in the 60,000 USDs to income as high as 193,000 USD (Pepper Pike). At the same time, the six largest cities with a population of over 100,000 are situated in the middle, with between 9.7% and 12.5% decline.
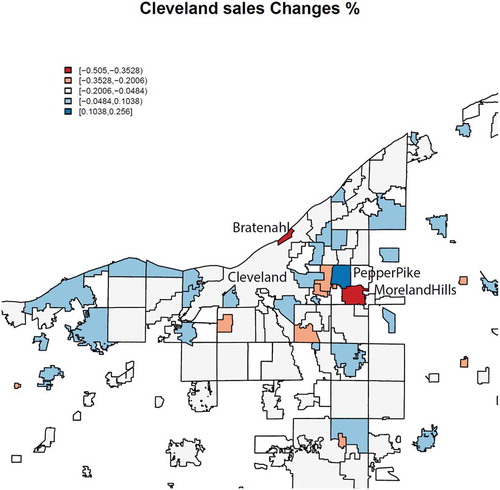
As an example, is a map of sales changes in the Cleveland area. As mentioned, Bratenahl and Moreland Hills in red are projected to experience a severe decline. Ironically, Pepper Pike next to Moreland Hills is one of those areas with the most increased sales. Other areas with a modest decline or increase are spread throughout the region.
Figure 3. Sales changes in the Cleveland area
There is no notable correlation between sales change and some of the key city features, such as population size, density, and household income, which is understandable given the mixture of increases and decreases in small to midsize places, as well as low- and high-income areas ().
Table 3. Correlations of key city features and sales change
Discussion and implications
While we may not have a single, clear formula to estimate the magnitude of decline or increase in revenue, there are some emerging patterns. First, as the previous section demonstrated, small places will likely face extreme swings, either an increase or a decrease in revenue and therefore revenue from sales tax. The fate of increase or decrease depends on the composition within the retail, food, and accommodation sectors. The places with grocery shops and big-box retailers will gain, while places dependent on apparel or automobile outlets, restaurants, and tourism can suffer as much as a half of sales tax.
Second, the largest cities seem to be affected moderately compared to others. These cities have a range of business activities including thriving grocery shops and suffering restaurants, clothing stores, and motor vehicle dealerships. Those end up with a modest decline with a narrow range from 9.7% to 12.5%.
Third, every part of the state, including metropolitan and nonmetropolitan areas, seems to have winners and losers. Those winning and losing small places seem to exist close to the center of a metropolitan area, such as within 15 miles, as well as distant locations as far as 60–80 miles. So far, our simulation does not indicate a possibility in which poorer places will be hit harder with this crisis. While this may sound like a relief, this simulation is only based on revenue change. As the income tax is the second largest source of government revenue, it is possible that poorer places will suffer more as employment for the poorer population, such as retail, restaurant, and other low-skill service jobs, will decline substantially.
These findings offer a few policy implications. First, while small places, by definition, have a small population, some of those cities will face an extremely difficult situation during this COVID-19 crisis. Each city, township, and village should assess the situation carefully based on their sectoral composition. Additionally, the magnitude of the crisis will be extreme for some of them, possibly irrecoverable in the short term, and they will require more assistance from the state or federal government.
Second, we conclude that the request by Ohio’s auditor to prepare for a 20% revenue decline seems reasonable, as the median of sales change was −8.8% with the standard deviation of 11%, as long as the crisis does not exacerbate the level of decline in the coming months. At the moment, it is a reasonable warning for large cities. However, the situation is completely different for some small municipalities, which may have to face as much as a 50% decline.
As with any simulation, this study has many limitations. The most important assumption was the rate of decline in March applying for the rest of the year. Those figures are still premature, and we need to keep observing the development for the rest of the year. Second, this simulation is entirely based on revenue change to governmental jurisdictions, not considering multiple effects in the overall economy. For instance, the decline in sales revenue causes layoffs of workers in severely hit businesses. Their income will shrink substantially, which affects the revenue for state income tax, as well as demand for retail and other business activities at the next level. Thus, this simulation underestimates effects for cities that are based largely on tourism. For example, Sandusky is a city 60 miles west of Cleveland on Lake Erie, with major hotel chains and attraction businesses. This city has a population of 25,000 and 40 grocery shops. However, as the demand for tourism declines, the spending on grocery shops by tourists will also decline. In the long run, we need to assess all those complex factors. However, we hope that this article can provide a few more guidelines and ballpark estimates of the magnitude of this crisis.
This COVID-19 crisis is affecting every city and community in the world, but unevenly. While every city and state must prepare for the budget shortfall, a blanket preparation for a 20% budget cut, though reasonable for the moment, is insufficient as it comes down to the city level, because some cities, particularly small ones, will be hit severely, depending on their sectoral compositions. We recommend to simulate fiscal impact at a finer scale than states, and to identify and prepare for vulnerable cities, which could face up to 40–50% decline in sales revenue. While this is a simulation based on the March 2020 data, the first severely affected month, more updated analysis, such as by every quarter, can better prepare state and city governments for this unprecedented crisis.
Acknowledgments
The author would like to thank Harvey Miller, Adam Porr, and Katie Phillips for brainstorming this project, Joshua Sadvari for parts of data collection, and Beth Chapple for copyediting.
Disclosure statement
No potential conflict of interest was reported by the author.
Notes
1. Their high-risk industries are mining (NAICS code 21), transportation (48), employment services (5613), travel arrangements (5615), and leisure and hospitality (71–72).
2. While various media started to report this news on 15 April 2020, such as NPR, New York Times, Business Insider, and Market Watch, we are unable to locate the original report from the Department of Commerce on its website. Since the figures reported by different media match, we assume that their reported numbers came from a reliable source. We use the numbers reported by Business Insider, which had the most comprehensive sectoral breakdown.
3. We are unable to find the data for the accommodation sector from the report by the Commerce Department. Here, we use 31% from the Washington Post (18 March 2020), which cited a forecast from the U.S. Travel Association.
4. In 2017, the latest available year, the Economic Census reported $198 billion for sales in these sectors, which was only 3.2% different from that of InfoGroup data in 2018, $192 billion.
5. Like many other states, Ohio has a complex system of municipal governments. For our analysis, there are 248 cities, 683 villages, and 282 townships. According to the Ohio law, villages have a population of less than 5,000, while cities have 5,000 or higher population (State of Ohio, Citation1953), albeit with exceptions. Townships are not defined by the size of population and can range from 13 to 34,557. We include all the three types, because there are villages and townships that are also affected substantially, as we will demonstrate later.
References
- Bureau of Labor Statistics (BLS). (2020). Unemployed persons by reason for unemployment. Retrieved from https://www.bls.gov/news.release/empsit.t11.htm
- NYTimes. (2020, April 23). Jobless numbers are eye-watering but understate the crisis. Retrieved from https://www.nytimes.com/2020/04/23/business/economy/unemployment-claims-coronavirus.html
- Ohio Department of Taxation. (2019). Annual report: Fiscal year 2019. Author. Retrieved from https://www.tax.ohio.gov/Portals/0/communications/publications/annual_reports/2019AnnualReport/AR2019.pdf
- Pagano, M. A., & McFarland, C. K. (2020, March 31). When will your city feel the fiscal impact of COVID-19? Brookings Institute: The Avenue. Retrieved from https://www.brookings.edu/blog/the-avenue/2020/03/31/when-will-your-city-feel-the-fiscal-impact-of-covid-19/
- State of Ohio. (1953). Ohio revised code. Columbus, OH: Ohio General Assembly.
- WOSU. (2020, April 15). State auditor warns local governments of tough fiscal times ahead. Retrieved from https://radio.wosu.org/post/coronavirus-ohio-state-auditor-warns-local-governments-tough-fiscal-times-ahead#stream/0