
 ?Mathematical formulae have been encoded as MathML and are displayed in this HTML version using MathJax in order to improve their display. Uncheck the box to turn MathJax off. This feature requires Javascript. Click on a formula to zoom.
Abstract
Additive Manufacturing (AM) has triggered development of advanced materials and supply chain strategies. Almost all newly launched metallurgical processing routes had initial technical limitations arising from the fact that their process-property-performance relationship is not well-explored. In the same context, understanding the ramifications of the transition from “conventional” to “additive” manufacturing, requires knowledge of the physical mechanisms associated with technical challenges. The latter becomes bolder when processing of multi-metallic components is addressed. The first half of the article is devoted to the status and recent progress in AM processing practices. We emphasize on the role of processing parameters and instrumentation-material interaction in various AM methods with focus on multi-metallic materials. The second half addresses material development and performance perspectives with emphasis on multi-metallic configurations. Crucial factors for structural integrity are introduced and specific technical challenges are demonstrated, considering engineering materials for multi-metallic components. It is also demonstrated how various cooling rates measurement techniques can be utilised for assessing the cooling rates in AM. Post processing challenges associated with the corrosion performance of bimetallic components and the effect of heat treatment on AM components are also included. Finally, the role, origin and detection of residual stresses in AM components are addressed.
1. Introduction
The technology or set of technologies that are the scope of this article are categorized under the broad additive manufacturing (AM) or 3D-printing family. AM is one of the most important and emerging technologies of the current industrial revolution (Industry 4.0). The basic concept behind AM is to quickly build physical tridimensional prototypes directly from digital models designed and developed in a CAD/CAM environment. Since this idea resembles a printing process taking place in three dimensions, it was immediately named ‘3D-printing’. Modern manufacturing requires fully functional prototypes used for testing, safety, and design checks, which together with other pre-production engineering tasks may contribute to fast product development procedures. Global competition for improved and creative design in the 90s made rapid prototyping an important trend in the industrial global market.
Since the inception of AM, several new methods and approaches have been introduced. The materials science and technology of AM was primarily benefited from classical technical knowledge in plastics, metals, alloys, and compounds. Thus, the AM methods were classified according to how premium the processed material is and subsequently AM of metals and alloys are regarded as attractive choices. The solid market drive for developing specific classes of materials coincided with the digital manufacturing evolution and encouraged the industrial community to create newer classes of materials, instead of putting effort in optimizing existing ones. However, the original invention of the technology owes to advances in robotics, which facilitate processing of materials and ensure reproducibility.
In the above context, scientists are recently focusing on using AM as a facilitator and key enabling technology in processing of new materials. Opportunities such as co-extrusion, multi-metals, elemental powder blending, structurally optimized meta-materials and even products that defy the established rules of physics are among the creative resolutions that contribute to paving the path towards a breakthrough.
For this to take shape, robotics in AM requires an engineered combination of tools and sensors with higher level of autonomy and newer capabilities. Moreover, understanding and linking the physics of materials to the science of robots seems to be the most viable way to develop the field of AM beyond the state-of-the-art. The intention of this article is to lift the new opportunities for metal processing in the spotlight, not only in the context of rapid prototyping, but also in terms of novel material designs and towards developing better and more efficient products.
In Section 2, we focus mainly on DED, starting by outlining the subclasses of the DED technologies with special attention to the interoperability between robots and the actual process. DED processing together with other AM technologies such as laser beam powder bed fusion (PBF-LB) will be discussed in Section 3, within a materials perspective and especially from a bimetallic or functionally graded materials point of view. Direct metal AM is a high temperature processing method and therefore, it is important to understand thermal cycling. Thus, available technologies for measuring cooling rates and the associated advantages or disadvantages for each method are reviewed in Section 4. In section 5, post-processing of multi-material components and their effect on the residual stresses are laid out.
Except for some data in the form of figures, charts, tables, and equations, which spring from existing literature, this paper contains original results the authors obtained within a period of more than 10 years. Although a review of AM systems is provided in section 2, our intention was not to produce a manuscript focusing on AM technology and methods. There is already a large volume of high-quality published articles and books covering this topic. We chose instead to focus on fundamental aspects in the processing of multi-metallic parts using relevant AM methods and the subsequent performance of these parts. In this context, PBF technology is not yet mature enough as it is lacking relevant technical functionalities for this purpose. The limited applicability of PBF methods in the manufacturing of multi-metallic components justifies the extensive citation of DED methods in the manuscript. We clarify this with a relevant paragraph at the end of Section 3.3.1.
2. DED additive manufacturing technologies
According to the ASTM Committee F42 on Additive Manufacturing Technologies (ASTM-International, F2792–12, Citation2012), directed energy deposition (DED) is defined as an additive manufacturing process in which, focused thermal energy (e.g. laser, electron beam plasma arc etc.) is used to fuse materials by melting as they are being deposited. These technologies are the major playground for advanced robotic systems that use automatons or manipulators for processing materials. Depending on the type of thermal energy source, the feedstock material can be in form of powder or wire, each of which offering advantages and disadvantages. In the following sub-sections, various DED methods are discussed.
2.1. Wire-arc additive manufacturing (WAAM)
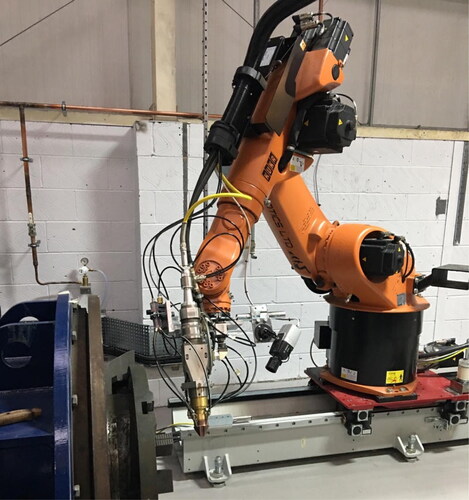
WAAM is based on a metal processing platform that shares a lot in common with conventional robot welding. Advancements in the field of welding date back to 1920s, when the first patent on arc welding was filed by Baker (Ralph, Citation1925). Ever since, this field has continuously been under evolution and with the birth of ‘Industry 4.0’ recently, an unprecedented development towards automatization of this process has taken place. During the past decade and alongside the growth of AM market, WAAM has been recognized as one of the key techniques in the field. The major advantage of WAAM is its relatively inexpensive instrumentation, as a result of a century long technological track record. The WAAM process is among the techniques that can potentially build very large components, thanks to the high deposition rate and utilization of mobile equipment. shows a typical configuration of a WAAM robotic cell.
Figure 1. Configuration of a WAAM platform.
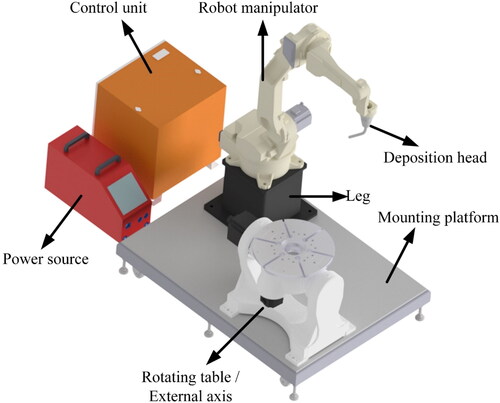
The intense heat source and large availability of the wire feedstock allow WAAM to become a suitable technology for factory floors of not only large but also small to medium enterprises (SMEs). Among the technology hallmarks, low equipment investment and maintenance cost, flexibility, ease of operation and high production capacity are the factors that contribute to the expansion of the WAAM application field. The technical characteristics of WAAM facilitate large-scale production of metallic components and shorten the time to market for innovative products, whilst its flexibility enables processing of multi-metal and functionally graded materials (Liu et al., Citation2013; Shen et al., Citation2016).
Ding et al. (Ding et al., Citation2016) showed that progress in automation of path design, welding parameter selection, improved machining code and program code generation, as well as final deposition and machining of the component, signify that WAAM is capable of producing metal components from CAD models.
However, welding is a demanding and complex process associated with various technical challenges. A wide range of scientific factors play important roles throughout the entire process. These range from robotics to material science factors such as heat and mass transport phenomena, molten metal shielding and electric arc (gas breakdown and ionization) mechanisms, deposition torch positioning, fluid flow, phase transformations, dimensional distortion, development of residual stresses, and so on. WAAM processing of bulk components with larger dimensions than a welded region is technically challenging as it can lead to accumulated errors. Using the same set of technical parameters as in classic welding technologies is not adequate, technical limits need to be pushed, existing knowledge must be revisited and existing state-of-the-art must be advanced.
Processing of geometrically accurate and defect-free components requires a high-level interoperability among the initial model, process control and process monitoring systems. The most used process monitoring systems are electric arc signal recordings, CCD cameras with special filters, infra-red cameras, and laser sensors for geometrical detection.
The WAAM process starts with the arc ignition and therefore, understanding the arc regimes and processing windows are of crucial importance.
The concepts of both gas tungsten arc welding (GTAW) and gas metal arc welding (GMAW) can be used in WAAM. illustrates schematically the major differences between the two technologies.
Figure 2. Schematic presentation of differences between GMAW and GTAW.
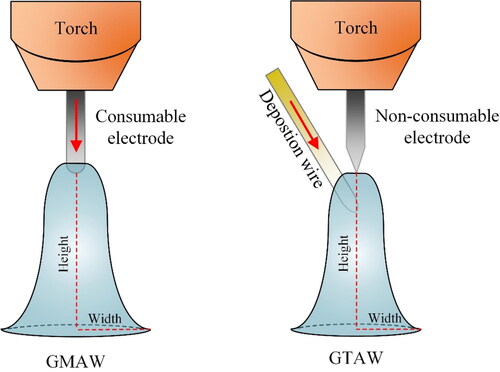
Arc Welding is a fusion welding process that requires an arc ignition between the anode (+ polarity) and the cathode (–polarity)Footnote1 (Richardson et al., Citation2000). In GMAW, the anode electrode is usually consumable and is fed continuously into the molten pool. Shielding gas flows with a certain rate and prevents excessive amounts of certain gas species (e.g. O2, N2 and H2) in the air reaching the molten pool (Svensson, Citation1994). Thus, the molten pool is protected from oxidation and diffusion of gas atoms with deleterious effects, causing degradation or loss of properties. On the contrary, the electrode in GTAW is not consumable and it is usually made from a tungsten-based material (melting point of tungsten is above 3400 °C). In this case, the wire material is fed from the side into the arc where it is fused and deposited on the substrate.
The advantage of GMAW is that can be automatized since the arc stability is controlled by both torch and wire movements.
The shielding gas consists of inert or active gases, which can be either pure or blended. It is responsible for producing ionized or dissociated atoms in arc plasma temperature for cascading free electrons in the gaseous column. The gaseous column is believed to be mainly made of ionized atoms in addition to the vaporized metal from the deposited and substrate material (Jeffus, Citation2002). Argon (Ar) and helium (He) are the most common inert shielding gases. N2, CO2 and O2 are active gases, which are normally added in portions to an inert gas, making it active. CO2 is seldom used as pure shielding gas because it dissociates into C and O2 in the arc environment. Carbon increases the contamination level of the weld metal and O2 oxidizes the reactive elements. Oxygen cannot be used alone either, because of its oxidizing nature. Nitrogen is considered as an alloying element in small quantities for many alloys and its presence in the weld metal may affect the properties of the material adversely. In general, the choice of gases is strongly dependent on the type of the material being deposited.
As mentioned in the previous paragraph, arc ignition takes place as a consequence of shielding gas ionization under the electrical potential difference between positive and negative electrodes. This process is also known as gas breakdown. When arc ignition takes place, in the very first moments, molten metal droplet does not transfer from the electrode to the substrate. This happens within a time frame that hardly exceeds a few milliseconds depending on the arc characteristics. As a result, understanding the behaviour of pure or blend gases during the ignition phase is crucial for gaining control over the process. The plasma jet consists of ionized gas, molten metal, slag, and vaporized metal. The arc formation depends on the gas physical properties. Some of these properties are given in . The basic properties of shielding gases have been fundamentally described and reviewed elsewhere (Dillenbeck & Castagno, Citation1987; Hilton & Norrish, Citation1988; Larson & Meredith, Citation1990; Liu et al., Citation1993; Schnick et al., Citation2012; Shackleton & Lucas, Citation1974; Stenbacka & Persson, Citation1989). The following paragraphs summarize the main of them:
Table 1. Characteristic parameters of different gases. (*) Dissociation and recombination energies of active gases (17).
Atomic/molecular weight represents the weight of a gas atom or a molecule, which is indicative of the total number of sub-atomic particles such as electrons, which play a significant role in the overall properties of the shielding gas.
Ionization energy of an atom is the minimum required energy to remove an electron from the electron orbital cloud. As a result, an atom possesses n ionization energy, n being equal to the number of electrons. Under equilibrium condition, the number of electrons and protons are equal. Theoretically, in a mass of gaseous atoms, the second ionization will not take place unless the last atom of that mass completes the first ionization process. Atoms with lower ionization potential will be easily ionized unlike those with lower atomic weight and higher ionization potential. In WAAM, use of gases with higher ionization potential may be challenging for the arc ignition phase. The arc voltage will provide the required energy for ionization in the plasma column. For example, the required ignition voltage is higher for He than for Ar, because the first ionization potential of He is larger. On the other hand, heat generation increases because of the higher voltage required for the ionization of helium.
Triple point and critical point are specifying the thermodynamic conditions of a gas. They describe the boundaries at which, the gas will undergo a phase transformation to liquid (critical point) or to either solid or liquid (triple point). This assumes increased importance when using WAAM to make components in extreme operating conditions such as outer space or underwater. Knowledge of these values is important to specify the operating pressure and temperature ranges for using a gas without changing its state to liquid or solid. For instance, the boiling temperature of CO2 at 5.2 bar is about −57°C, while this temperature rises to about 10 °C at 50 bar (Iota & Yoo, Citation2001).
Thermal conductivity of a gas is indicative of the easiness to conduct heat to the periphery, resulting in radial heat dissipation. Depending on the thermal conductivity of the used gas, the geometry of the deposited bead may vary. Gases with lower thermal conductivity leave the core of the ionization column hotter than the surrounding. In argon, it results in a specific geometry of the deposition bead known as ‘argon finger’, that can penetrate deeper to the substrate due to the hot core of the arc. The deposition bead geometry in WAAM can be adjusted by combining different gases with designed proportions. In addition to the bead geometry, thermal conductivity affects the dilution of the deposited layer with the underlaying material. More specifically, the gas thermal conductivity affects the height of the deposited material and subsequently influences the layer-by-layer deposition. This necessitates that the initially determined layer height in the CAD model should be modified. Therefore, thermal conductivity plays an important role in regulating the slicing parameters.
Dissociation and recombination are properties of molecular gases such as the active multi-atomic gases N2, O2, CO2 and H2. When these gases are heated to extremely high plasma temperatures, the atomic bonds break, and ions are generated. The dissociated ions are at higher energy state and once reaching the cold substrate, they recombine and release heat. The area over which recombination takes place is relatively large, and the weld bead will be wider. The dissociation and recombination energies of O2 and CO2 are listed in , and marked with asterisks (*).
Oxidation potential of active gases like CO2 and O2 not only changes the arc plasma physics, but also causes alloying element loss in the deposited alloy. Mg, Si and Ti are the most prone constituents in steels and Al alloys, which show losses proportional to the percentage of active gases in the flow.
Addition of active gases into the inert shielding gas may improve the arc plasma stability since the dissociation energies of the active gases are lower than the first ionization energies of the commonly used inert gases (Jeffus, Citation2002). However, it can alter the alloying element proportion in the deposited metal and cause oxidation and loss of reactive elements. For this reason, the feedstock has compensating levels of elements, allowing active gas to be used without affecting the final composition of the deposited material.
In some cases, active gases can have beneficial effects in terms of microstructural evolution. For instance, it is documented that the presence of oxide precipitates in the deposited ferritic steels as a result of using active gases in the welding process, promotes formation of acicular ferrite (Nishiyama et al., Citation1985), which improves the toughness of the processed alloy (Homma et al., Citation1987).
The polarity of the electrode also affects the depth of penetration and dilution of the deposited bead. The bead cross section becomes shallower if the polarity is alternating between the electrode and the substrate and it gets even shallower if the wire has a negative polarity. In the latter case, the cascade of the electrons will be towards the electrode tip and therefore, the substrate will not experience extreme temperature gradients (Karadeniz et al., Citation2007).
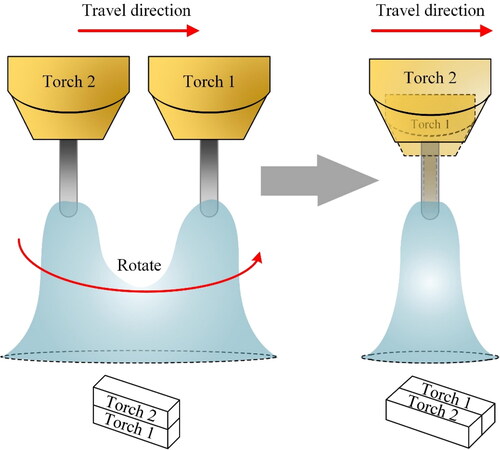
The welding techniques developed towards increased productivity such as dual wire, tandem and hybrid systems can be implemented for AM, but they are not readily applicable in WAAM. In these methods, the deposition head does not have radial symmetry and some of the toolpath manoeuvres cannot be easily realized. shows how 90° rotation of the tandem deposition head nominally affect the deposited geometry. This rotation is inevitable for achieving a continuous toolpath in WAAM, especially when the beads are being deposited side-by-side. This has also been mentioned by other researchers (Williams et al., Citation2016).
Figure 3. Effect of deposition head rotation in a tandem torch setup. Tandem wire polarities can be (+/−), (+/+), (−/−) or (+/AC) to make the arc fusion from two sources different.
2.1.1. Challenges with wire feedstock production
The wire used in WAAM is usually produced by hot drawing, the formability of which is influenced by variations in material chemistry, surface conditions and the through-process strength of some materials.
The following formula describes the required work for wire forming:
(1.1)
(1.1)
where Wd is the required ideal work for material deformation, which is equal to the total work produced when the material is subjected to tension, WF is the required work to overcome the friction between the wire and the die and WR is the work spent on the redundant (unwanted) deformation in the process. Based on theoretical calculations, the maximum reduction of area per each pass of wire drawing cannot exceed 63% of the original cross sectional area (Hosford & Caddell, Citation2011). Since most of the WAAM wires are approximately 1–1.2 mm in diameter, it is fair to assume that the material should experience several passes of reduction.
Determining the exact values of WF and WR is not straightforward. As the diameter of the wire reduces, WF increases and WR decreases because the ratio between the total surface to cross sectional area increases. However, for long wire lengths, the increasing rate of WF is more than that of WR, resulting in a substantial increase of the required work for wire drawing (W).
When the wire passes through several hot reduction stages, various microstructural phenomena transpire. Some alloys, such as high-strength Al alloys are susceptible to hot cracking. If the original billet contains microscopic solidification cracks, the drawing operation can be jeopardized. Surface scrap, pores, inclusions, spills, and protuberances are possible defects that affect the wire drawing process in the small diameter scales.
Ko and Kim (Citation2000) showed that central burst defects can form in Al alloys. These defects depend on the die design and structural damage and deteriorate the mechanical properties, causing breakage upon processing.
In some age-hardenable Al alloys, evolution of GP zones and precipitation or dissolution of the η/η’ phase during prolonged drawing at a high temperature are also reported as factors affecting the material strength (Höno et al., Citation1986; Karabay, Citation2008; Ku et al., Citation2018).
Deposition of some alloys is also quite challenging in terms of maintaining the chemistry and composition of feedstock in the processed material. For instance, 7XXX Al-alloys owe their superior mechanical properties to the zinc and magnesium content, which play a central role in the aging process. Due to the low vapor pressure of Zn and Mg, their content reduces below the effective limit during an AM processing step. The Zn and Mg content can only be slightly increased in the original cast alloy to compensate for the elemental loss, since Zn and Mg expand the mushy zone of the alloy, making it more susceptible to hot cracking, increasing the breakage risk during the subsequent hot wire drawing process.
The deposition rate and productivity increase as the cross section of the wire becomes larger. However, due to the heat balance in the arc plasma column, there is a theoretical limit to the maximum achievable deposition rate. Nonetheless, increasing the wire diameter to improve productivity has consequences on the process automation, as the bead geometry changes.
2.1.2. Mass transfer
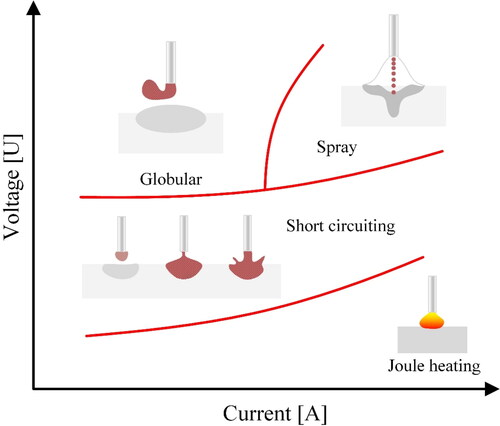
In WAAM, the mass transfer mode plays an important role in the process stability. illustrates the effect of process current and voltage on the type of mass transfer. According to Ampere’s law, a current carrying wire produces a magnetic field around it. This electromagnetic field creates a force field around the wire that interferes with the molten droplet at the tip of the wire. Depending on the surface tension of the droplet and the electromagnetic forces (EMF), the material will be transferred under different regimes. In general, the current value determines the size of the formed droplets since it defines the EMF around the wire. Launch of the molten droplets through the plasma column is therefore determined by the EMF rather than gravity and consequently, positional deposition of the material becomes possible. Moreover, the magnetic field has an inverse relationship with the diameter of the wire. If large wire diameters are selected for improved productivity, the process current (I [A]) must be increased in the same order to achieve the same EMF effect.
Figure 4. Mass transfer mode from deposition wire to the substrate, affected by the arc settings in the WAAM process.
The energy input associated with the process and its effect on the material, is expressed using the classical heat input (HI) definition:
(1.2)
(1.2)
where η is the process efficiency, U and I are the process voltage and current respectively and v is the travel speed of the moving heat source. In general, processes with lower HI are preferable since they prevent grain coarsening, reduce compositional inhomogeneity (dilution) and formation of unwanted precipitates or phases.
It must be noted that the established HI parameters is just an indicative value and shall not be used as a sole factor in assessing the welding and AM conditions. Arguably, different combination of U, I and v may result in the same HI value. It is proven that each of the above parameters (U, I and ν) alone can have a more pronounced effect on the material performance than when combined in the form of HI.
In addition to heat input, the Marangoni effect plays a central role in the shape and stability of the WAAM process. In the formed molten pool, the liquid metal being closer to the surface has a different surface tension than the rest of the liquid inside the governing temperature gradient. This gradient in the pool results in melt agitation known as Marangoni convection. This phenomenon is quantified via the Marangoni number Mα given by the formula below:
(1.3)
(1.3)
where ∂γ/∂T is the temperature coefficient of surface tension, ΔT is the temperature difference between the centre and edge of the molten pool on the surface, L is the radius of the molten pool on the surface, µ is the dynamic viscosity and α is the thermal diffusivity.
When the power of the heat source increases, Ma increases owing to increasing of both ΔT and L. When the arc (plasma column) diameter reduces, ΔT increases significantly, especially when the thermal conductivity of the material is low, causing a subsequent increase in Ma. Both the thermal conductivity of the gas and the deposition wire diameter affect the Marangoni convection in the molten pool (Arora et al., Citation2009; Wei et al., Citation2009).
In addition to the shape of molten pool and deposition bead, the Marangoni effect influences the transport of oxides and high temperature phases in the material. illustrates two major convection modes in WAAM deposition. Outward convection will be beneficial for materials forming stable native oxides, such as Al and Cr containing alloys (Lu et al., Citation2004). The Marangoni effect also affects the distribution of the deposition stresses in the material (Goldak et al., Citation1990; Vasantharaja et al., Citation2015) and therefore affect the structural integrity of the WAAM processed component.
Figure 5. Marangoni convection in the melt pool and its effect on the geometry of the deposited wall structure.
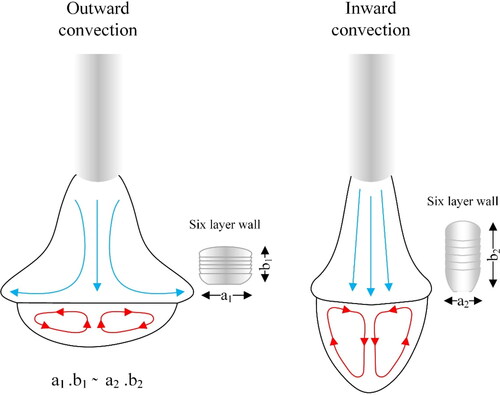
In welding, the formed molten pool is surrounded by the solid material. Therefore, the Marangoni convection can affect the evolution of compressive or tensile stresses at the borders of the melt pool. However, if the objective is to make a wall structure using WAAM, the flow in the melt should be limited to prevent liquid metal flow on the sides, especially if the material has low flow stress properties at elevated temperatures (Oyama et al., Citation2019). In such conditions, inward convection can facilitate building of a wall structure (see ).
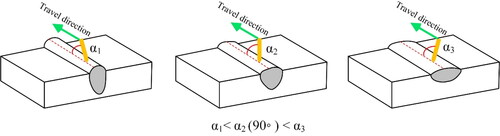
The angle of the deposition wire with respect to the travel direction is another important factor that affects the deposited bead shape in robotic WAAM. illustrates three deposition angles with respect to the travel direction. If the robot is programmed to make an acute angle (α1), also known as “pull”, the depth of penetration and dilution will be higher. A perpendicular angle (α2) will make a near round cross section and an obtuse angle (α2), also known as ‘push’, will reduce the dilution and widen the bead. Each of these techniques should be utilized in different occasions, while special caution is required in selecting shielding gas and process parameters to prevent combinations that may cause loss of deposition control. For instance, using argon and ‘pull’ strategy, overexpresses the depth of the deposited bead. This should be avoided as it may lead to unwanted heating and subsequent microstructural changes threatening the structural integrity of the built item. In this context, if the substrate chemistry is slightly different than the deposition material, during the first bead deposition, an obtuse angle or ‘push’ strategy would be a smart choice against excessive dilution.
Figure 6. The effect of welding wire angle with respect to the travel direction on the deposited bead shape.
In all mass transfer modes, the electrode is constantly moving towards the molten pool created by the arc heat on the substrate. However, not all these modes are applicable for all types of materials. For example, soft materials with low flow stress at relatively low temperatures, such as aluminium and its alloys, are not suitable for transfer regimes in which, wire feeding requires a push force (e.g. short circuiting). For this reason, the pulsed mode was introduced. In this process, the current and voltage are pulsating based on a given and predefined waveform (Kah et al., Citation2013). Under such conditions, the arc phase is close to being extinguished and therefore, the temperature rise is not sufficient to soften the wire. A more advanced procedure is introduced later (see next section), which became one of the leading technologies in today’s WAAM operations.
2.1.3. The Cold Metal Transfer (CMT) process
According to Williams et al. (Citation2016), gas metal arc welding (GMAW) is the process of choice for WAAM since the deposition material is the arc electrode, and its co-axiality with the welding torch results in an intuitive tool path planning process. The Edison Welding Institute (EWI) (Uziel, Citation2016) has established the pulsed gas metal arc welding process (GMAW-P) as a suitable method for layer-by-layer processing of large-scale stainless steel parts. Gas tungsten arc welding (GTAW) and plasma arc welding (PAW) are other options for WAAM (Ding et al., Citation2015), despite the limitations originated from the wire feeding mechanism (Williams et al., Citation2016). Application of these methods requires rotation of the torch (deposition head) on the bends and corners, which complicates robot programming (see ).
Experience has shown that amongst the various modes of GMAW, cold metal transfer (CMT), is the most effective process. illustrates the operational principle of CMT and shows the behaviour of current, voltage and power.
Figure 7. a) Schematic representation of the CMT process (adapted from (Magalhães, Citation2012)) and (b) Oscillograms of voltage, current and power for the CMT mode after (Dutra et al., Citation2015)).
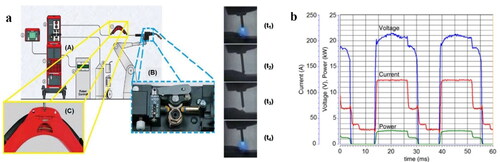
The power source (A)) generates a controlled current (I) waveform. The filler wire is continuously fed into the melt pool and the arc retains a stable arc length (t1)). At a programmed frequency, the current is reduced, and the wire-melting rate becomes lower than its feeding rate. Consequently, the wire tip touches the pool (shortcuttingt2)) and the voltage assumes a value close to zero (arc extinguishes). During the short-circuiting phase, the current decreases further. In sequence, under a programmed frequency, the wire feed speed is reversed by a motor gear at the torch (B)) and the wire gets retracted and stops being in contact with the pool (t3)). To avoid spattering, the current reduces again upon the wire retraction, and immediately increases back to its nominal value for re-establishing the arc (voltage is high again), as shown in t4). There is a need to keep a constant distance between the wire and workpiece according to the desired current and regardless of the wire feed speed, a factor that further complicates process control. In addition, there are combinations of waveforms to improve the self-sufficiency of the CMT process for special conditions. shows implemented waveform combinations compared against the conventional CMT (). For instance, the introduction of an interlacing pulsed period () increases the wire melting rate. The alternation of polarity (), increases the melting rate without affecting the heat transferred to the pool, whilst allowing for wire surface cathodic cleaning during the negative polarity period.
Figure 8. Arc current and voltage waveforms of CMT. (a) conventional; (b) CMT pulse; (c) CMT Advanced (alternate current); (d) CMT Pulse-advanced (after).
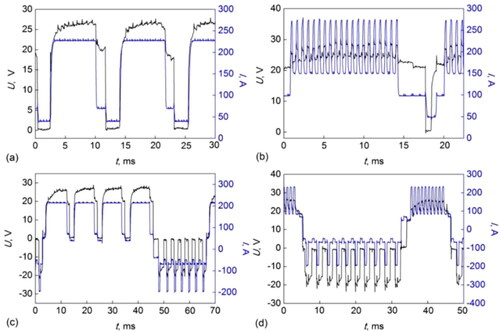
CMT is described by Pickin et al. (Citation2011) as a technology that partially decouples the arc electrical transients from the wire feed rate. Although the process relies on the wire short circuit for material transfer, sufficient energy () can be realized to melt the base material and the filler wire by controlling both the cycle arcing phase and the wire feed rate. As a result, material transfer can be achieved at the short circuit point with a low arc energy () and hence with a reduced heat input to the weldment. Complementary research on CMT by Dutra et al. (Citation2015) showed that using a special motor on the deposition head enables control of the speed and direction of the wire feed, in addition to controlling the waveform of the current.
Deposited beads with excellent quality, lower thermal heat input and spatter free process are amongst the main advantages of the CMT process. The low heat input makes CMT a suitable AM method. Since the arc plasma is small in volume, the arc pressure exerted on the pool is also limited. In addition, heat transfer to the material occurs recurrently. These two characteristics imply that the melt pool is under control, as required in the WAAM process.
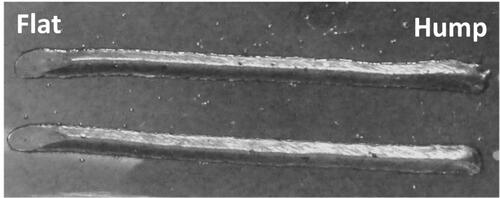
Nonetheless, CMT-WAAM has some setbacks. Poor accuracy and surface finish limit the applications of wire-fed AM technology. Despite being a low heat input process, CMT may result in building high residual stresses and subsequent distortions in the produced parts. In wall shape structures, the material will face a low heat dissipation capacity, and a great amount of the metal will shrink upon cooling. It has been reported that the ends of the deposition beads create a profile that is somewhat higher than the rest of the bead. This phenomenon is known as “humping” in welding science (see ) (Adebayo et al., Citation2012), and it can be a challenge for tool path planning in the WAAM processes.
Porosity and grain coarsening hinder the broader use of WAAM, especially in applications utilizing aluminium alloys. Both phenomena can severely worsen the mechanical performance of the processed components. Bai et al. (Citation2016) found that the average ultimate strength and elongation of an additively manufactured 2219-Al alloy are remarkably lower than those of the parent material. They attributed the degraded strength of the material to the absence of precipitation occurring upon component manufacturing and subsequently lack of precipitation strengthening. The material exhibited an isotropic behaviour with respect to its tensile properties.
Gu et al. (Citation2014) have discussed solidification cracking as a part of challenges with WAAM of Al alloys, but they still rank porosity as the main problem in aluminium alloys. Porosity is attributed to traces of hydrogen exceeding the concentration threshold for nucleating bubbles in the molten pool. In their studies on an additively manufactured Al-6.3%Cu alloy, Cong et al. (Citation2015). found that the deposit porosity is significantly influenced by the arc mode type of the CMT process (). Conventional CMT is not suitable for additive manufacturing, as it produces a large amount of gas pores, even in a single layer deposit. CMT Pulsed and Advanced (PADV) proved to be the most suitable process for depositing aluminium alloys owing to its excellent performance in controlling porosity. With proper control of the heat input, this process may produce porosity free walls. Cong et al. interpreted the porosity elimination in parts produced by CMT-PADV as the result of low heat input, formation of fine equiaxed grains, and effective removal of wire oxide via cathodic oxide cleaning at the end of the aluminium wires. According to Gu et al. (Citation2014), cathodic cleaning as a result of alternating current, reduces the amount of hydrogen content in the oxidation layer, and subsequently prevents hydrogen entering the molten pool.
Cong et al. (Citation2015) also studied the effect of the CMT arc mode type on the columnar grain structure. A mixture of fine columnar and equiaxed grain structure was observed using CMT-ADV, but the finest equiaxed grain structure was obtained using CMT-PADV settings. They attributed grain refinement to the lower heat input (HI) employed as compared to other CMT process variants. In addition, because of the lower HI in CMT-ADV and CMT-PADV, particles in the filler wire, such as Al3Ti and Al3Zr, can survive melting and thus act as heterogeneous nucleation sites, promoting grain refinement. Gu et al. (Citation2014) claimed that the Ti, Zr elements exist mainly in intermetallic phases, but some of them dissolve into the aluminium matrix during the wire production process. Owing to the high melting point of the particles and the low HI of CMT-PADV, it is likely that more particles will be retained in the solidified molten pool, compared to traditional welding methods. Consequently, these particles act as near perfect heterogeneous nucleation sites due to their similar crystal structures and lattice parameters compared to the aluminium matrix, causing grain refinement.
2.1.4. Path planning and process control
The deposition sequence affects the quality of the deposited material and therefore deposition strategy and planning are important for additive manufacturing in the following perspectives:
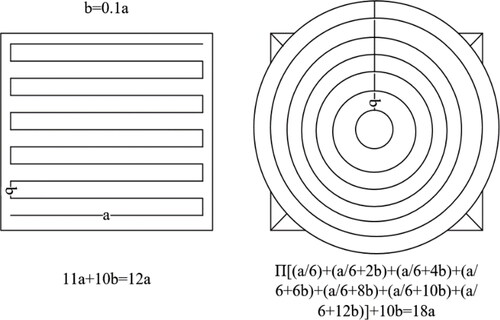
Productivity: The deposition sequence has a substantial role in idling time between two deposition beads or layers and subsequently the process productivity as more material can be deposited in a shorter time (Ding et al., Citation2014; Oyama et al., Citation2019). In the initial stages of additive manufacturing, the model is sliced into layers and the CAD geometry is transformed from the ‘model domain’ into the ‘layer domain’, based on which, the toolpath planning and the overlapping regions are defined (Ding et al., Citation2015). Toolpath differences are demonstrated in where two paths can cover a similar surface area. At constant speed, the required travel durations for the deposition tool from start to stop in the shown paths are clearly different. This is reflected in differences in productivity which become more pronounced for multilayer components and for geometries that are complex in the model domain (Kulkarni et al., Citation2000).
Figure 9. Differences in the length of the toolpaths by choosing various strategies. The concentric circular movement will cover the same area in almost 30% longer travel length.
Quality: The concept of inter-pass temperature is a widely used factor for optimizing and controlling the weld metal microstructural development and ensuring similar quality throughout the deposition. Depending on the material, optimization of the cooling rate and the inter-layer temperature are necessary to achieve thermodynamic stability of the phases and eliminate phases that may degrade the mechanical properties (Brandl et al., Citation2012).
Residual stresses and distortion: Many studies (Ding et al., Citation2011; Citation2015; Michaleris, Citation2014) showed that deposition planning is critical for the extent of residual stress development throughout the geometry, Therefore, control of residual stresses by appropriate toolpath design will be beneficial for the structural integrity and the magnitude of distortion.
Process monitoring and post-deposition treatments: Various sensors, monitoring systems and non-destructive equipment have been developed and can be used in WAAM, both online and offline, with operando monitoring being more challenging. Most of the monitoring tools and sensors should be mounted onto the robot in the vicinity of the deposition head. One example that demonstrates the complication level is recording the molten pool shape using a CCD camera. The camera should be positioned correctly with respect to the deposition wire so that changes in the pool shape should be captured in real time, whilst the robot movements during the deposition should not be limited because of the camera location. Post-process treatments such as shot or hammer peening, laser surface treatments etc. are also robotic operations that require suitable toolpaths. Re-melting of the surface and subsequent microstructural modification may occur upon surface laser treatment (Chong et al., Citation2003). Therefore, the selected toolpath should cover the entire surface with a minimum overlapping to prevent re-melting in the hatching zone.
The arc control in robotic WAAM is of paramount importance. An electrical arc is defined by its unique current-voltage characteristic. In order to have a stable arc plasma, the power source should satisfy the following requirements:
The deposition current must be maintained constant upon fluctuations of the plasma volume and the distance between the deposition wire tip and the substrate.
The deposition voltage should be controlled in a way that responds quickly to changes in the process current. For example, utilize model reference adaptive control (MRAC), instead of the proportional-integral-derivative (PID) approach.
In case of short circuiting, the current must remain low.
The open circuit voltage (when there is no arc) should comply with the settings and should be neither much higher than the setpoint, which may result in sparking and wild start, nor much lower, which can result in a challenging arc ignition.
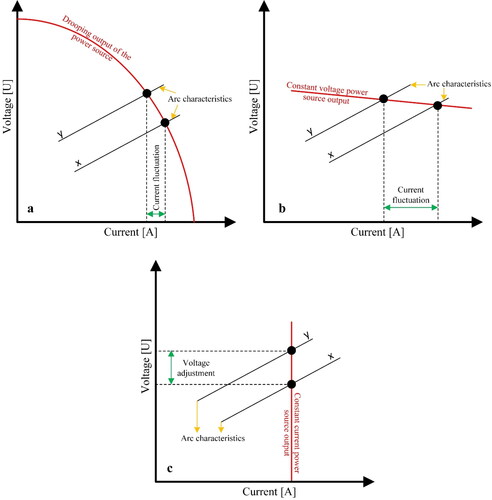
Therefore, the WAAM power suppliers should have certain current-voltage output such as variable (drooping), constant current (mostly used for GTAW type) or constant voltage to comply with the abovementioned requirements.
shows arc control strategies for different power source settings. The drooping system reduces the voltage if the arc current increases and therefore, the delivered power per unit volume of the deposited material will be constant under different settings. However, if the substrate surface is uneven, or the robot accuracy is insufficient, the distance between the wire and the substrate may vary, resulting in current variations. The power supply should therefore be able to deliver the same voltage to bring about a decreased melting rate and recovery of the arc current. This control method is used in GMAW under constant feeding rate of the deposition wire. Constant current is used for GTAW where the fed wire is not electrified. In the CMT process, control is applied both on the power source and the wire feeder. The wire feeder registers the controller input from specific signs in the current waveforms.
Figure 10. Arc control methods for (a) drooping power source output, (b) constant voltage power source output and (c) constant current power source output.
2.1.5. Advanced control options
It was described above that control under classic deposition conditions () can be achieved through monitoring and application of a constant current. Therefore, in an ideal condition, the current will maintain the setpoint as soon as the arc ignites.
Figure 11. Arc start and finish regimes (a) classical mode, (b) intense start mode and (c) arc stabilization mode.
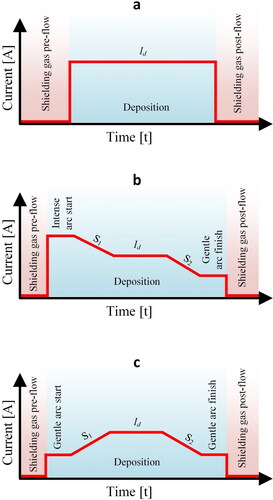
However, there are several phenomena that may cause inconsistencies in the geometry of the deposition beads. Deposition of materials with high thermal conductivity such as Al and Cu alloys can be challenging in the ignition phase as the material conducts the heat away from the arc region and defers molten pool formation. Such conditions inhibit substrate melting and if the wire feed rate is constant, dilution will decrease, and the fed material will form a hump in the start. Towards the arc extinguishing phase, material is heated, and the molten pool size becomes larger than in the ignition phase. Therefore, dilution will be high, and constant wire feed rate will result in bead flattening. shows the ignition hump and flat end in a single bead deposition geometry.
Figure 12. Hump and flat segments of the deposition beads.
In such conditions, heat input should be more intense in the ignition phase and less intense in the finish phase and the process current should vary accordingly to achieve this. shows a setting where intense start and gentle finish conditions are provided.
In other applications, a gentle start and a gentle finish may be required (). If the processing material has a high melting temperature or the shielding gas has a high ionization (or dissociation) energy, the ignition phase can be quite unstable. Although metal vapor and gas ions contribute to the formation of a stable plasma column, dynamic conditions under high heat input can create an unstable arc and drive the parameters away from the steady-state condition. Therefore, a gentle start will stabilize the deposition process, followed by a linear current rise towards the process setpoint.
Although for robotic deposition, the classical mode is preferred to limit process complications, layer-by-layer deposition would require a higher level of arc control to achieve a consistent bead shape. A case of building a thin wall structure can be taken as example. If the location of the start and finish points coincide, the ignition hump and finish flat segments will acquire a slant shape. The angled top layer will result in a varying electrode stick-off and create an unstable condition that is not suitable for automated/autonomous conditions. Thus, depending on the conditions, we need to choose between intense or gentle start modes.
2.2. Laser metal deposition (LMD)
Light Amplification by Stimulated Emission of Radiation (LASER) is an optically amplified coherent (in-phase) ray of light that was first built and demonstrated in 1960 (Hecht, Citation1992).
The laser pump has a special design to reflect the generated photons for stimulated emission. The entire gain medium is encapsulated in a partially reflective or reflective parallel mirrors to provide light oscillation. The medium can be in any state of matter; solid, liquid, gas, or plasma, which defines the type of the laser and its energy. Since the exiting photon elevates the energy level of the atom as much as it loses upon photon emission, the incident light and the emitted light have the same wavelength and thus, the same colour. On the other hand, due to the unidirectionality of the incident and emitted photons, the photons are travelling along near parallel vectors. Therefore, the laser light is monochromatic and of low divergence by nature.
Since the transmitted cross section of the laser ray can be focused by optics and the emitted photons are at the same wavelength, the target material at the laser beam incident point will receive immense energy. This can raise the temperature and cause local melting, the extent of which depends on the type of material and its interaction with the laser light (i.e. absorption, reflection and transmission properties).
Lasers are categorized according to the lasing medium of the pump. Five industrial leading categories are: (i) solid state, (ii) gaseous state, (iii) liquid state, (iv) chemical and (v) semiconductor (diode) lasers. summarizes the laser classes and the active medium types that belong to each class.
Table 2. Different laser classes and their active medium used for emitting the laser light.
Laser light has a special cross section pattern depending on the design of the waveguide (the matter that the laser light passes through with a minimum loss). In transverse electromagnetic modes (TEM), there is no externally applied electrical or magnetic field in the direction of propagation, meaning that all fields are transverse (Dickey, Citation2014). As an example, a coaxial wire guides electricity (free electrons) in an externally applied transverse electromagnetic wave, generated by the outer layer of wire net. The cross section can either be circular or rectangular, which will create different shapes, as illustrated in .
Figure 13. Laser cross section (a) TEMpl modes, where p and l are integers for the radial and angular mode orders, respectively, and (b) TEMmn modes, where m is the number of half-wave patterns in the width of the waveguide and n is the number of half-wave patterns in the height of the waveguide.
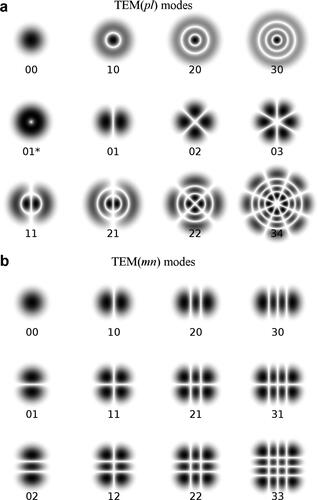
The TEM00 mode (see ) is preferred since the distribution of the incident photon energy is a Gaussian, which means that the energy is highly concentrated in the centre. However, other modes can be chosen depending on the application and the required processing conditions.
Tseng and Aoh (Citation2013) reported results of simulation studies regarding the effect of laser cross section shapes on heat distribution during the cladding (LMD) process. They showed that selecting the cross-section shape from the TEM00, TEM01 and TEMmixed modes for a constant laser power output, creates considerably different molten pool shapes, affecting the heat distribution in the solid material. The size of the molten pool in the TEM00 mode was larger than the other selected modes. However, the resulting temperature gradient in the processed material was reduced to a great extent by selecting the other two modes.
In the above context, an opportunity arises to control the process, not only by regulating the output power but also by selecting the cross-section shape of the incident beam on the material. This enables us to mitigate the temperature distribution on the material, something that is specifically useful for materials requiring special solidification and growth modes in the processing phase.
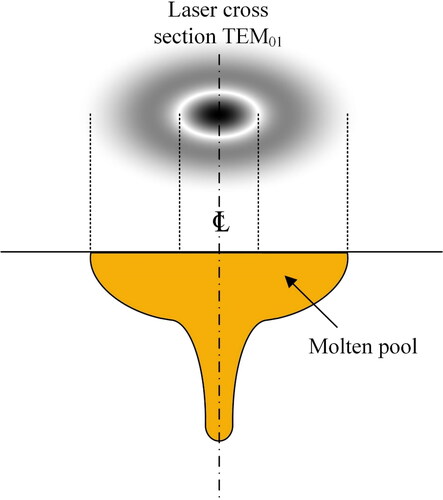
TEM10, TEM20 and TEM30 in the pl modes are quite interesting for LMD, where the tool travelling speed is relatively slow. The outer rings in these modes deliver a somewhat lower laser power to the material in the front of the molten pool, which causes preheating prior to the molten pool generation by the high intensity core of the laser beam. As soon as the high intensity region passes over a spot, the low intensity ring at the back outer rings of the moving laser beam will reduce the cooling rate. This can resolve problems with respect to preheating and post heating of sensitive materials. schematizes the effect of laser cross section TEM01 on the cross-section geometry of the molten pool.
Figure 14. Effect of laser cross section TEM01 on the cross section of the molten pool.
2.2.1. Laser-material interactions
When a material is exposed to an incident laser beam, light will be reflected (R), absorbed (A) or transmitted (T), depending on its wavelength, its incident angle with respect to the material surface, the surface roughness, the oxides present on the surface and the temperature of the material. Following energy conservation, the sum of R, A and T fractions will always equal to unity. This means that taking measures to reduce light reflection and transmission will contribute to increasing absorption and consequently the process efficiency as light absorption will result in heating and subsequently material melting. The behaviour of materials exposed to a spectrum of wavelengths can be measured using spectrophotometry. In this technique, monochromatized light from a light source is used as an incident beam to the material and the absorption and reflection is measured against the values of a reference substance (usually Teflon).
depicts the absorption of a few materials in a broad range of wavelength. The two vertical lines indicate the characteristic wavelength of the most popular lasers used in materials processing: Nd:YAG and CO2.
Figure 15. Absorption of various metals exposed to different laser wavelengths.
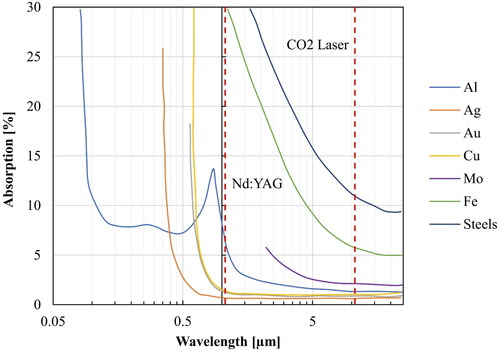
The chart clearly indicates that different laser sources are required for maximizing the absorption for each material.
As mentioned before, the surface conditions (roughness) and type of material (solid or powder) influence the interaction mechanism between the laser light and the material to be processed. In addition to these factors, Foroozmehr et al. (Citation2016) have shown that the packing density of the powder material has a direct impact on the optical penetration depth (OPD) and therefore, it affects the laser light absorption mechanism. Gusarov et al. (Citation2009) composed a numerical model that couples the radiation transfer with thermal diffusion to provide a local temperature field when the incident laser light interacts with the powder material. Even though their model assumed that the powder has the highest packing density, they included boundary conditions for the powder density in order to make it practically applicable for the LMD processes. King et al. (Citation2015) proposed a model describing the interaction between laser and powder material that considers powder as a low density, low-strength solid. They also verified their model and reported a good compatibility between simulation results and experiments. Devesse et al. (Citation2015) employed a ray-tracing algorithm to split the laser beam into multiple rays of light, which is partly reflected and absorbed by the particles and the workpiece. They also used a Monte Carlo particle tracing method for modelling the powder particle trajectories in the LMD process. They concluded that particle size distribution significantly influences the absorbed particle energy pattern, while the effect on the laser beam attenuation is less pronounced.
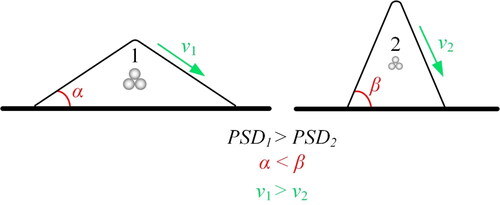
In addition to the physics behind the laser-powder interaction, particle size distribution (PSD) and average morphology are also important. Spreading of the powder is a key element in packed powder bed AM processes, which determines the quality of the feedstock and, consequently, affects the quality of the processed component. According to Escano et al. (Citation2018), reducing the average particle size will increase the repose angle and decrease the surface flow speed. shows how particle size distribution affects the repose angles (α and β) and surface velocities (ν1 and ν2).
Figure 16. Effect of particles size distribution on powder kinetics.
One of the crucial aspects of the interaction of a laser with the powder particles and the substrate in laser metal deposition (LMD) and laser beam powder bed fusion (PBF-LB) is the cross-section shape of the single track. In the PBF-LB and PBF-EB processes, the powder melts, and fuses recursively in an evenly coated layer of powder. Moreover, the layer thickness is small, in the range of 30–50 µm. On the other hand, in the LMD process, the bed geometry is a function of various parameters, making the process more vulnerable for the toolpath planning. Laser power, powder feed rate, powder morphology, substrate quality, tool travel speed, laser spot size and inclination angle are among the influential parameters determining the cross-section shape of the deposited beads.
Ayoola et al. (Citation2017) found that for a given beam diameter, increasing the heat input, increases the penetration depth (dilution) almost linearly. On the contrary, the deposited bead width seems to be only affected by the beam diameter rather than the general heat input.
Beams with smaller diameters suffer from larger energy losses. These losses stabilize when the spot size increases beyond 3 mm in diameter. Lasers with small spot sizes, interact with a small material volume and therefore, a smaller fraction of energy is absorbed. This results in a minimal rise of the substrate temperature. Heat conduction is a time dependent phenomenon and therefore, the temperature of the surrounding material does not increase immediately upon exposure to laser light (transient heat transfer), resulting in loss of energy.
The effect of laser parameters on the bead shape and dilution is a complex phenomenon and it varies with the type of material, laser, and its wavelength. A few approaches have been suggested but most of them fail to predict the molten pool geometry when the boundary conditions are not within the calibrated framework. The bead shape geometry formulations are mostly calibrated for bead-on-plate deposition tracks, and if a bead is deposited on top of another bead to form a wall structure, the boundary conditions are invalidated. Therefore, it is more reliable to use a parametric approach that is trained based on the actual bead shapes.
Azar et al. (Citation2012) proposed a discrete heat source model to approximate the shape of a deposited cross-section. In this model, the heat source is assumed as an array of point heat sources, as shown in , moving conformally along the deposition direction. The array is along two perpendicular directions, and the movement of the heat source array takes place along the third direction.
Figure 17. Positioning of the arrayed heat source for a bead-on-plate deposition.
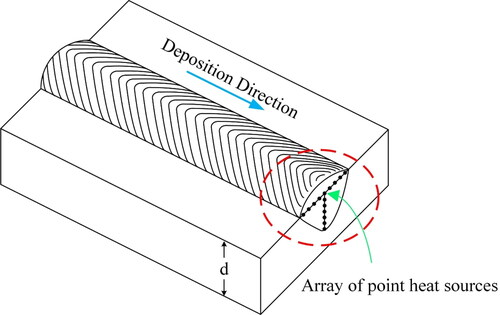
Under adiabatic conditions, there is no heat flow between the adjacent heat sources and the only dominant heat-conducting medium is the substrate, assuming that the surfaces of the substrate plate are impermeable to heat.
The transient heat emitted from the point heat sources flows through the substrate thickness (d) and increases the temperature locally. Since the surfaces are adiabatic, the heat reaching the surfaces should be reflected to the bulk, unless an infinite plate thickness is assumed. Then, instead of multiple reflections on surfaces, an imaginary pattern can be introduced according to which, heat is emitted at distances equal to multiples of the thickness.
and illustrate the relative positioning of the imaginary heat sources and distributed point sources. Transverse and perpendicular separations are depicted with ε and δ respectively. A reasonable number of points are required to resolve the heat distribution in a smooth manner. Cumulative heat emission from all sources should satisfy EquationEq. (1.4)(1.4)
(1.4) :
(1.4)
(1.4)
where q0 is the total heat flux, qt and qp are the heat flux from each transverse and perpendicular point source respectively, η is process efficiency factor (typically 60% for LMD), P is laser power and i is the respective heat source number.
Figure 18. Method of imaginary heat sources displaced along the y-axis. ni is the respective symbol for each point and Rref is the reference vector from point of observation P to n0.
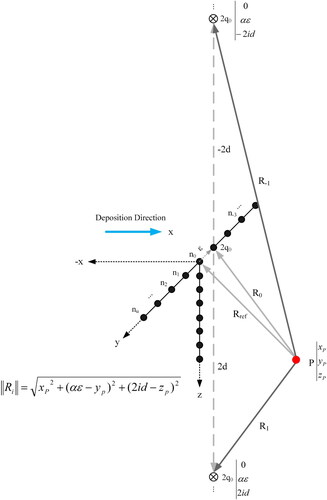
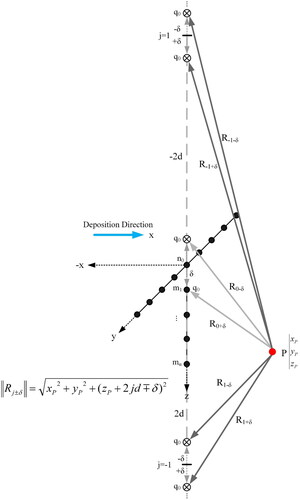
Figure 19. Method of imaginary heat source displaced along the z-axis. mj is the respective symbol for each sub-surface point.
The contribution of all transversely arrayed heat sources and respective images is given by EquationEq. (1.5)(1.5)
(1.5) :
(1.5)
(1.5)
where k is the heat conductivity, v is the tool traveling speed, x is the lateral distance from the y-z plane, a is the thermal diffusivity, and Ri is the distance vector from the observation point P to any transversely arrayed point heat source. The size of Ri vector can be defined as below:
(1.6)
(1.6)
where (xp, yp and zp) is the Cartesian coordination of the observation point P, ε is the lateral distance between transverse point sources and d is the plate thickness.
The contribution of all perpendicular heat sources and respective images is:
(1.7)
(1.7)
where Rj±δ is the distance vector from the observation point P to any perpendicular point heat source. The size of Rj±δ is:
(1.8)
(1.8)
where δ is the lateral distance between any perpendicular point source and surface.
The temperature rise at point P is the sum of all arrayed and imaginary heat sources:
(1.9)
(1.9)
where T0 is the preheating temperature and η is the process efficiency factor.
shows the calibrated isotherms for high and low laser power processing of a carbon steel. In order to calibrate the isotherms, the laser parameters were assumed constant, identical to values used in the experiments. The rest of the parameters can be found through a few trial-and-error iterations to improve the degree of fit between the simulated isotherms and actual microstructure.
Figure 20. Calibrated isotherms for the deposited bead shapes for high (a) and low (b) laser powers. The material is carbon steel.
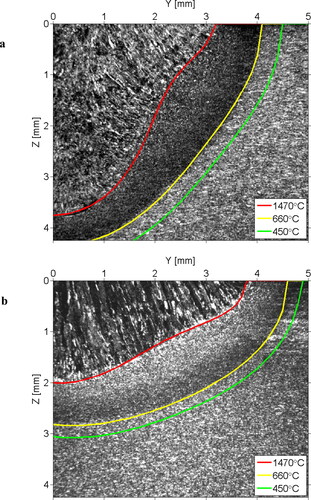
The calibrated parameters such as efficiency, cumulative heat generation and temperature profile can be used as input to other computationally implemented models such as a double ellipsoid heat source (Goldak et al., Citation1984).
2.2.2. Robotic LMD cell setup
illustrates a typical LMD cell. The robot is mounted on a linear track to extend the robot reach and facilitate processing of large AM components. The figure also shows a mounted camera for monitoring the formation and development of the molten pool at the process focal point. Such monitoring systems are usually mounted on an on-axis setup, using an available port on the deposition head. These cameras can be equipped with infrared (IR) sensors to measure the melt pool temperature. This will enable better process control through adaptive adjustment of the laser power to maintain a given molten pool size. Lower heat input is beneficial as it reduces distortion of the deposited material, thus decreasing the risk for cracking.
Figure 21. Robotic LMD setup integrated by CNC Robotics Ltd. Robot is mounted on a linear motion track, equipped with laser cladding head and a process monitoring camera.
In recent years, the tendency of processing highly accurate geometries through AM brought about advanced machines that combine near-net shaping (LMD) with conventional CNC machining, commonly referred as hybrid manufacturing. These setups do not use industrial robot manipulators due to the low accuracy and stiffness of the robots in performing the milling operation. There are several large-scale research programs around the world focusing on designing mechanical devices to address these challenges.
2.3. Electron beam additive manufacturing (EBAM)
Electron beam is a cascade of accelerated electrons that transform into thermal energy which can cause melting when interacting with a solid and therefore, can be used for AM. The electrons are thermionically generated by tungsten (W) or field emission filaments upon applying ultra-high potential differences (up to 60 kV). The efficiency of the process depends on the quality of surrounding vacuum, since atmospheric gas atoms attenuate the accelerated electrons before they coincide on the target surface. Therefore, the process operates under high vacuum conditions (10−4–10−5 mbar). Such vacuum creates an unrivalled condition for safe processing of reactive metals that are sensitive to the oxygen content in the atmosphere or alloys that can take up gaseous species such as nitrogen and hydrogen from the surrounding air.
Absence of atmospheric gas atoms or molecules may create electrostatic charging (smoke events) that could result in spattering of the molten metal due to accumulated charge at the sharp corners. One preventive measure to reduce electrostatic charging is to apply up to 10−3 mbar of helium gas in the vacuum chamber (Kahnert et al., Citation2007; Sigl et al., Citation2006).
Typically, electron beam melting utilizes beam currents between 1 and 50 mA resulting in a maximum beam power of about 3 kW (Körner, Citation2016). The beam diameter is affected by the accelerating voltage, especially for tungsten filaments. This can be a major challenge for the electron beam powder bed fusion processes. However, for electron beam additive manufacturing (EBAM), the conditions are still sufficiently acceptable. Similar to welding, EBAM establishes a larger melt pool compared to the electron beam melting (powder bed) process.
An EBAM system can operate with a beam current range 1–1500 mA, generated by accelerating voltages up to 60 kV, which correspond to a beam power of approximately up to 90 kW. Beam current, focus (through magnetic lenses), accelerating potential, and tool travelling speed are important variables for a given metal to be processed by EBAM.
In EBAM, the feedstock is in wire form since feeding powder material can be challenging for mainly two reasons. First, because the powder particles are normally carried in a gas stream, something that is not compatible with the high vacuum requirement for EBAM. Second, in the presence of powerful magnetic lenses the powder particles can be levitated in the generated magnetic field or even enter the lens system through the slit. This can also cause challenges for processing of materials that have relatively high vapor pressure at elevated temperatures.
illustrates the physics behind the solid - electron beam interaction within the interaction volume the dimensions of which depend on the incident beam characteristics. The incidence of the electron beam can sputter atoms, generate exited particles, bounce back electrons elastically, generate characteristic X-ray of the material and more importantly generate heat. Thus, it is important to understand these phenomena in more detail in order to adjust the beam characteristics in an optimum way and successfully safeguard the work environment from ionizing radiation (e.g. X-ray).
Figure 22. Incident electron beam on the surface of a matter and schematic presentation of the interaction volume and the aftermath effects.
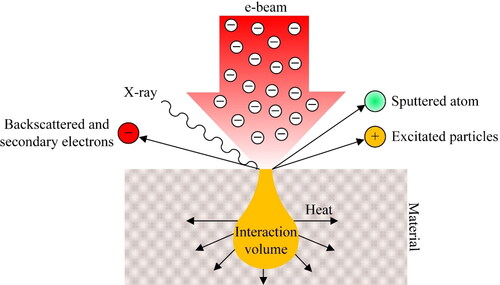
The depth of the interaction volume where X-rays are generated from, is a function of the material properties (atomic number, mass, and density), and the accelerating voltage. It can be determined by the Castaing’s formula below:
(1.10)
(1.10)
where:
Zm is the depth of penetration, E0 is the accelerating voltage (kV), EC is the minimum emission voltage (keV), A is the atomic mass, ρ is the density (kg/m3) and Z is the atomic number.
Owing to elastic scattering phenomena, the electron beam energy should exceed the critical ionization energy (EC) of the element(s) by a factor of 1.5–3 to efficiently excite X-ray line(s). This requirement was considered in the Castaing’s approximation. The depth of penetration (Zm) for given processing settings can be calculated using nomograms as that in , which is demonstrated for the Inconel 718 alloy as an example.
Figure 23. Nomogram for calculating the depth of material along which the x-ray is generated. Case study Inconel 718.
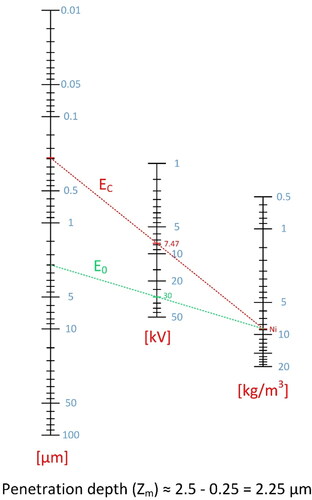
The EC values of most of the metallic elements is above 5 kV. This is an accelerating voltage level above which, most of the electron beam additive manufacturing methods operate. Therefore, emission of x-rays becomes inevitable, making the process and the involved machinery more stringent in terms of radiation safety.
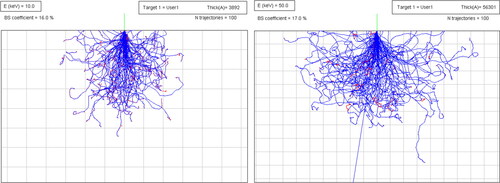
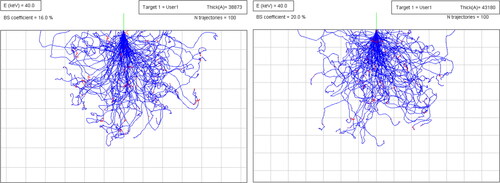
The intensity of emitted x-rays is proportional to the interaction volume size, which is a function of the material state, electron beam current and accelerating voltage. compares the interaction volume of the beam from 10 and 50 keV sources for the Inconel 718 alloy. The former condition penetrates almost 3.9 microns in the material, while the latter condition can penetrate 5.6 µ of the same material.
Figure 24. Comparing the penetration depth of 10 keV and 50 keV electron beam in the Inconel 718 material. The Monte Carlo simulations performed by the eiss3 module. Each square is 1 × 1 µm.
shows how the penetration depth is density dependent and how it is affected upon melting. The depth is simulated using a 40 keV electron beam on solid and molten Inconel 718. The depth increases by 11% when the material transforms from the solid to the liquid state. The number of backscattered electrons (elastic bouncing) increases by 4% upon melting, suggesting that the electron beam becomes slightly inefficient once the molten pool is formed.
Figure 25. Comparing the penetration depth of 40 keV electron beam in the solid and molten Inconel 718 material. The Monte Carlo simulations performed by the eiss3 module. Each square is 1 × 1 µm.
Selecting the correct process parameters or developing a set of viable processing conditions is a demanding task for AM applications. Therefore, a tool is required to translate the accelerating voltage into beam power in terms of kW and to make EBAM more comparable to the laser-based processes.
According to Coulomb’s law, 1 ampere = 6.242 × 10¹⁸ electrons per second. Using the Einsteinian definition of the photoelectric effect (E = hν), the energy of electrons under different accelerating voltages can be calculated:
At 10 kV, the energy of each electron is 1.6333 × 10⁻¹⁵ JouleFootnote2
At 50 kV, the energy of each electron is 8.7937 × 10⁻¹⁵ Joule
At 150 kV, the energy of each electron is 3.1083 × 10⁻¹⁴ Joule
By keeping the beam current constant at 600 mA, the power delivered by the electrons is:
At 10 kV: 6.242 × 1018 · 0.6 A · 1.6333 × 10−15 = 6 × 10³ kW
At 50 kV: 6.242 × 1018 · 0.6 A · 8.7937 × 10−15 = 32.9 × 10³ kW
At 150 kV: 6.242 × 1018 · 0.6 A · 3.1083 × 10−14 = 116 × 103 kW
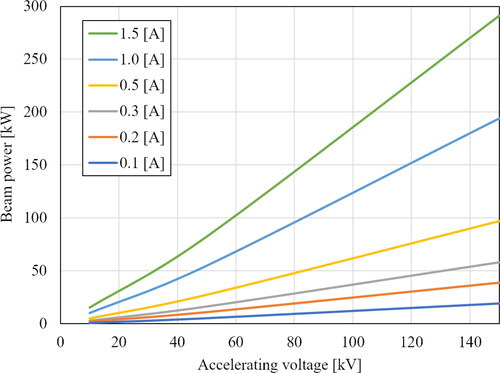
shows the diagram where the same calculations are performed for a wide range of beam current values. Figure shows that increasing the beam current affects the beam output at all accelerating voltage ranges and the effect becomes more pronounced at high accelerating voltage values.
Figure 26. Beam power as a function of accelerating voltage and beam current.
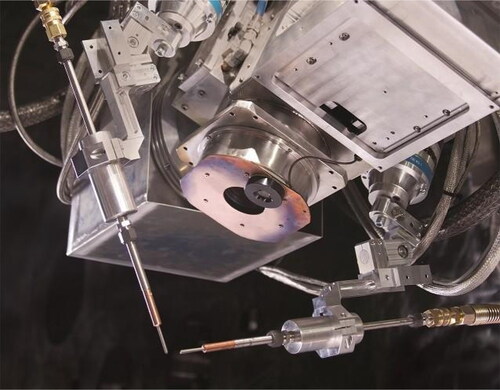
The electron beam column has a smaller spot size compared to the laser beam. Therefore, the energy density is extremely high in the former. This results in the formation of a deep molten pool in the material, which is the deepest among all AM and welding techniques. Such a concentrated energy can be used to melt large quantities of material in the form of wire feedstock. Depending on the physical properties of the material and its interaction with the beam, deposition rates of about 3–9 kg/h can be achieved. These values are similar to those achieved by the state-of-the-art LMD techniques currently tested in laboratory level, and which are almost 10 times higher than those achieved using commercial LMD equipment. illustrates the configuration of a deposition head with two wire feeders at the focal point of the electron beam.
Figure 27. Wire fed electron beam additive manufacturing (EBAM) deposition tool (courtesy of Sciaky Inc.).
2.4. Joule printing
This technology takes advantage of the Joule resistance heating phenomenon for depositing the wire on a substrate. Prior to this development, welding processes using the fundamentals of resistive heating were well explored (c.f. section 3.4.2 for pin printing).
When an electrical current passes through a conductor, thermal energy is generated. The thermal energy causes a rise in the temperature of the conductor. Joule heating is in fact a transformation of electrical energy to thermal energy, based on the principles of energy conservation.
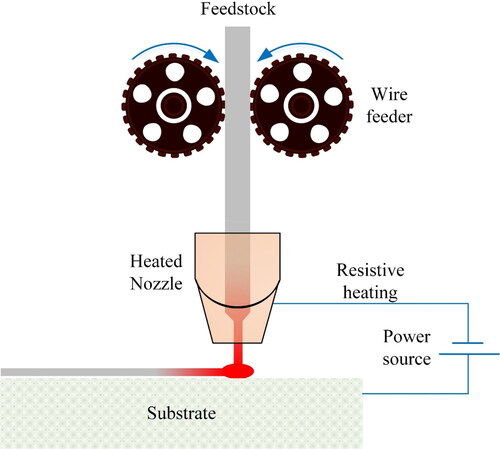
schematically illustrates a resistive heating and printing process. The wire feedstock is heated in the vicinity of the substrate and forged against it, while being at high temperatures. The four main parameters of this process, namely voltage, current, force on wire, and tool travelling speed are chosen depending on the type of material and its associated physical properties.
Figure 28. Schematic illustration of a Joule printing™ system.
According to the Ohm’s law, the electric potential difference V, current I and resistance R, are related through the following formula:
(1.11)
(1.11)
The power P dissipated in the conductor and transformed to heat is given by Joule’s law:
(1.12)
(1.12)
The amount of built-up heat Q in the conductor after time t can be calculated as:
(1.13)
(1.13)
which rises the temperature T of the conductor according to the following relation:
(1.14)
(1.14)
where c is the specific heat of the material and m is the total mass of the conductor. Considering the conductor in the form of a wire (cylinder), EquationEq. (1.14)
(1.14)
(1.14) can be elaborated as:
(1.15)
(1.15)
where ρ is the density of the conductor, r and h are the radius and length of the wire, respectively.
In the previous formula, R, c and ρ are temperature dependent properties of the conductor whilst I, t and the shape of the conductor will determine the eventual magnitude of temperature rise.
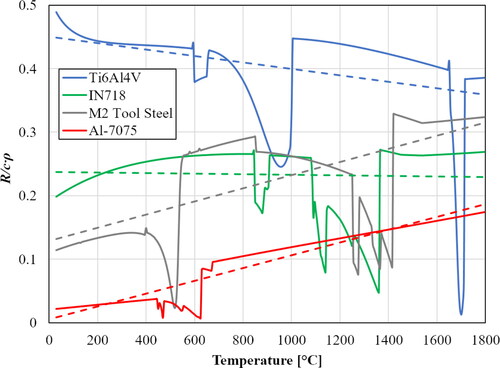
As stated before, the R/cρ coefficient is material and temperature dependent. The physical unit of this coefficient is [Ohm.K/J.M], where M is the molar mass of the conductor. shows the calculated material coefficient, R/cρ, for different materials as a function of temperature. The values suggest that if the material coefficient is low (as e.g. for Al alloys), the I and t values should be increased, or the dimensions of the wire feedstock should be decreased proportionally to gain the same rise in temperature.
Figure 29. Calculated temperature dependence of R/cρ value for different materials. Broken lines are corresponding linear trendlines for each material for the purpose of simplification.
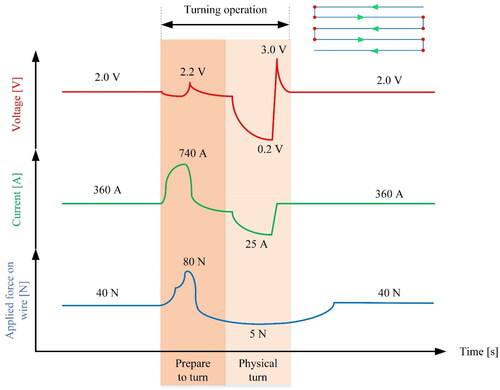
Applying this technology requires the material to be in a semi-solid state, preferably closer to the solidus temperature, where its viscosity is controllable. However, in the planned toolpath, turning points are required to lay the beads next to each other. These spots are of high importance, since the deposition direction changes abruptly, often 90°. In order to establish this manoeuvre, the fluidity of the material should increase momentarily to allow for bends in the toolpath. Increased fluidity can be obtained by raising the temperature and in Joule heating, this can be achieved by increasing the current. Simultaneous application of slightly higher force on the wire, will ensure that the fluid material will fill the corners, leaving no gaps in the sharp turning points.
The turning points in the toolpath are associated with the longer dwelling time of the material at high temperatures, which can cause problems such as softening, grain growth, precipitation, over-aging etc., depending on material type. The electrical current, voltage and applied force should be readjusted in the immediate vicinity of the bending points to allow for the material flowability to increase momentarily Therefore, during the next phase, the current and force drops to stabilize material temperature around the parameter setpoints. This procedure is depicted in .
Figure 30. Variation of the process parameters at the turning points in the toolpath. The data is for Joule printing of Ti6Al4V. Green arrows on the toolpath show the deposition direction and the red dots are representing the turning points.
3. Materials perspectives in additive manufacturing processes
3.1. Motivation
AM technologies quickly transform into mainstream routes for metal processing and manufacturing. Expectations exceed shop floor efficiency and are extended to significant improvements in the on-demand production, regionalization of supply chains and reduction of production waste by as much as 96% (Maheshwaraa et al., Citation2007).
One of the major promises of AM for metals is to facilitate the fabrication of multi-metal components (Mahamood et al., Citation2012). In this section, we combine literature research with unpublished data to provide the reader with a broader background of the metallurgical aspects of processing multi-metals.
For a component to be called multi-metal or graded, both composition and properties should vary continuously or stepwise over its volume, resulting in changes in the functionality of the material (Miyamoto et al., Citation2013). Metallic functionally graded materials (FGMs) are therefore alloys with varying composition over their volume. In this context, the miscibility or ability for two materials to be partially or completely soluble in each other, has a technological significance. In 2005, Dwivedi et al. (Citation2006) introduced a new concept called ‘maxel’, as the basic structural unit in FGMs (e.g. elements or material ingredients). In many AM technologies, the terms ‘maxel’ and ‘voxel’ are used interchangeably. Voxel is considered as the smallest volumetric pixel of a material in which, variations in composition, microstructure, texture etc. are insignificant.
The ability of two metals to mix uniformly and form a single phase, known as substitutional solid solution, has been determined by a set of empirical rules acting as prerequisites, which are known as the Hume-Rothery (1899–1968) rules (Hume-Rothery et al., Citation1969; Hume-Rothery & Coles, Citation1969) being:
Atomic size factor: The radii of two different atoms should not vary more than 15% or else, partial solubility might be expected.
Crystal structure factor: For complete miscibility the solvent and the solute atoms should crystallize in the same atomic crystal structures (e.g. fcc, bcc, hcp etc.).
Electronegativity factor: If two elements have similar electronegativities, they are more likely to form a solid solution. In contrast, compounds are formed by elements with different electronegativities.
Valency factor: When the solvent and solute have the same valency, it is expected that complete solubility occurs, and a metal of higher valency is more likely to dissolve in a metal with lower valency.
In this context, gradient change in chemical composition of an alloy to form a FGM does not always lead to formation of solid solutions and phase separation, since segregation and intermetallic compounds may still form. In addition, precipitates may evolve because of solid-state transformations upon solidification or during post processing heat treatments and/or ageing. These phenomena in turn may jeopardize the physical and mechanical properties of an FGM structure. On the other hand, depending on the type of AM technology, re-melting of the feedstock, fusion, sintering or dilution of the material and solidification at various cooling rates may take place. Such a variety in thermal processing requires a good understanding of the compositional incompatibility between the various material systems in a FGM, in order to define their technical limitations and subsequently enable the sustainable production of various FGM structures.
In this section we discuss the potential of making FGMs based on the most industrially relevant metallic materials, namely Fe-, Ni- and Al-based alloys, which are among the most used engineering materials, even in the AM related activities. The following considerations have been considered:
Processing of functionally graded alloys should not create large volume fractions of brittle intermediate phases dominating the FGM microstructures.
Central focus in combining different materials is the structural integrity, while other properties such as wear, and corrosion should be considered separately.
Preheating of the feedstock or the substrate is sometimes necessary to prevent hydrogen (cold) cracks, especially in bcc alloys.
The deposition strategy in the LS, LM or DMD methods determines the inter-layer temperature, which must be critically controlled to minimize the structural defects and anomalies of the final FGM product (e.g. porosity, lack of fusion, sagging etc.).
The feedstock quality (e.g. presence of impurities) and the build plate/substrate conditions (e.g. cleanliness) are important to achieve sustainable manufacturing of the FGA structures.
The selected build-plate should have a similar composition with the first deposition layer unless it is considered as a part of the FGA structure.
Section 3.2 is devoted to the overall mechanical response of multi-materials and FGMs, prior to describing the metallurgical challenges associated with phenomena such as diffusion, phase transformations, interface interphase formation etc. that can take place in the AM processing of multi-metal systems.
3.2. Mechanical performance of multi-metal components
This section describes a holistic approach of the overall mechanical response of a FGM based on an EPFM model. This model identifies the differences in fracture response when a crack is at or close to the interface between dissimilar metallic components. SENB and SENT (Nyhus et al., Citation2003; Xu et al., Citation2009) are the standard tests for measuring fracture toughness and assessing materials’ resistance to crack growth. shows a two-material SENT model where the tensile and fracture properties of the alloys are different. We chose the AISI 4140 and AISI M2 materials as examples in this demonstration. lists the mechanical properties of the selected materials. These two materials are primarily selected to apply the EPFM theory due to the combination of similar elastic, yet dissimilar plastic and hardness properties.
Figure 31. Free body diagram of the SENT model used for simulation. The horizontal and vertical lines indicate the two different orientations of the interface between the two dissimilar metals.
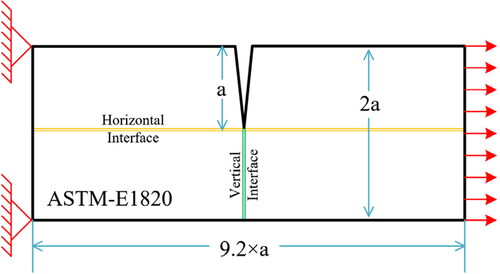
Table 3. Mechanical properties of the selected demonstrator materials.
The model can be extended to FGMs with more than two maxel, where the crack may be located at different positions with respect to the interfaces between the various maxels. illustrates the free body diagram of the investigated model with either horizontal (yellow) or vertical (green) interface orientations. The geometry of the model was adapted from ASTM-E1820 standard recommendations. The applied displacement is 0.5 mm for all cases. Three different configurations of six cases were defined in the FEM analysis, where the metals shown in and the crack positions are combined in various ways. In configuration 1, (cases 1 and 2), the location of the crack tip was assumed to be at- and perpendicular to the interface between the two dissimilar metals respectively. Thus, in case 1, the AISI 4140 was placed above the (yellow horizontal) interface where the crack is located, and AISI M2 was placed below the interface where the crack plastic zone will form. Similarly, in configuration 2, (cases 3 and 4) the crack tip was located parallel to the (green vertical) interface, and in configuration 3 (cases 5 and 6), the crack was perpendicular to the (yellow horizontal) interface with its tip placed at 2.5 mm inside the material above the (yellow) interface plane. The latter is very relevant for cases where the crack grows in one material, while the properties of the other material dominate the overall mechanical performance of the bimetallic component. tabulates the differences between the various material configurations in the samples in a more systematic way.
Table 4. Positioning of materials and crack for FEM analysis.
depicts the crack tip stress distribution for the designed simulation cases 1–6, without considering interphase formation at the interfaces.
Figure 32. Opening stress (S11) contours in the crack tip region for six defined cases.
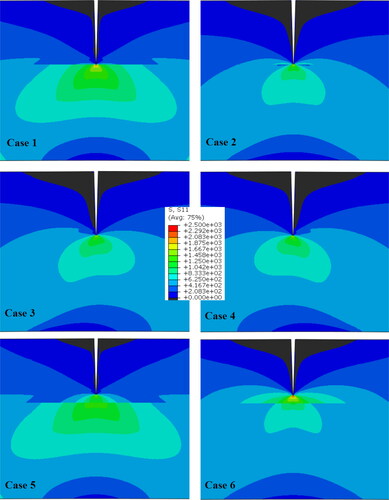
The plastic zone shape differs for the different material configurations. In case 1, where the lower material is stronger, a larger plastic zone and a higher stress at the crack tip is formed. The crack tip plasticity was quantified by CTOD simulations. shows that the CTOD value for case 1 is the lowest among the other cases, demonstrating the weak fracture toughness of such a configuration. This is opposite to case 2 where the crack is in the high strength material. According to the CMOD values of case 1 in , the response of the bi-metal system to crack opening is not consistent along the crack tip-to-mouth distance as expected in uniform materials. For example, case 1 exhibits the lowest CTOD value while the corresponding CMOD is not the lowest amongst the cases.
Figure 33. (a) CTOD and (b) CMOD variation plots as a function of applied displacement.
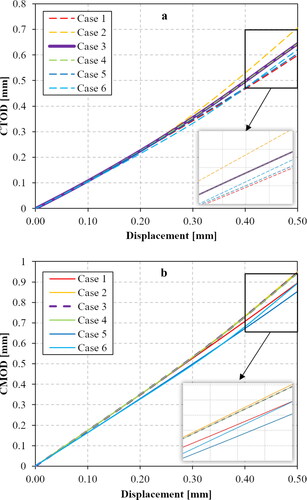
This is because of the inhomogeneous stress distributions in the loaded bi-metal configuration, which suggest that the SENT fracture toughness tests will result in deviated CTOD values if the measurement of the opening is acquired only from the mouth of the crack. This phenomenon is more vivid for the cases 3 and 4 where the crack is located parallel to the interface. The modelling results show that the crack does not open symmetrically in these cases and the findings are consistent with earlier studies (Du & Hancock, Citation1991; Minami et al., Citation1995; Thaulow et al., Citation1994; Citation1999a; Citation1999b) on the constraint and strength effects of weld material where the strength of the weld metal mismatches that of the base materials.
shows the opening stress state (S11) ahead of the crack tip for the modelled cases. Case 1 and case 6 show the highest stress concentration ahead of the crack tip. A step change in stress level occurs for cases 5 and 6 where the crack tip is located 2.5 mm away from the horizontal interface. In Case 5, the S11 increases at the interface as opposed to the results for case 6 and other cases, due to the geometrical arrangement of the materials. Therefore, depending on the material configuration and relevant position of the crack, the stress intensity factor changes across the interface thus affecting the overall fracture resistance of the bi-metal component.
Figure 34. Crack opening stress (S11) variation ahead of the crack for six defined cases.
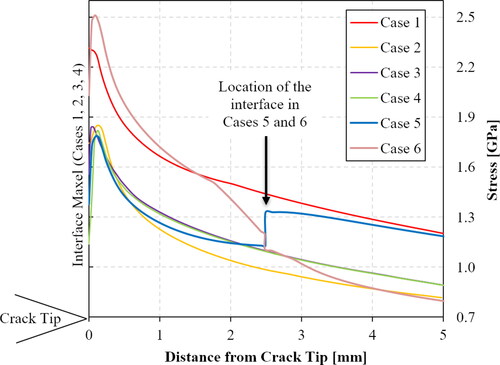
The above EPFM simulations demonstrate that the performance of the material in the interfacial region is more complicated than a bulk homogeneous material. In practice, the above scenarios are far more complicated since local physical processes and metallurgical phenomena such as elemental diffusion and depletion, formation of intermetallic phases, HAZ and interfacial microstructural inhomogeneities will affect the state of stresses. The next sections will throw light on various metallurgical ramifications projected for selected materials for AM.
Smooth transition between layers having drastically different properties is a viable option that has been studied by several researchers. The following section will review this methodology considering design aspects of such transitional layers.
3.3. Planning the integrated manufacturing of the intermediate maxel
3.3.1. Powder bed methods
In general, the production of a multi-metal part with powder bed methods such as SLM, PBF-EB, PBF-LB, SLS and so on, is feasible. However, it requires reversed stack of different powders in the feed platform compared to the positioning of materials in the final component. The tapped density and packing efficiency of the powder and target density after sintering should also be envisaged or measured for making correct calculations. Dense hexagonal powder packing for mono-modal distribution can reach a relative density up to 74% (Gauß, Citation1831; Hales & Hales, Citation2012; Mackay, Citation1962) in contrast to irregular and random packing which is associated with lower relative density values up to 64% (Jaeger et al., Citation1996; Sadoc et al., Citation1973; Scott & Kilgour, Citation1969; Torquato & Stillinger, Citation2006). For bi-modal powder packing, the maximum packing density can be reached when the smaller particles have mean radii, approximately 42% of the mean radii for the larger particles (Marshall & Hudson, Citation2010). It is important to tap the powder when filling the powder platform since the untapped powder can exhibit down to 5.55% of the tapped density, depending on the size distribution, morphology and physical density of the material (Gardner, Citation1988). Therefore, the ratio between the density of the sintered part, which is around 98% of the wrought material density, and the tapped density of the powder material is between 0.65 and 0.75.
The thickness of the intermediate maxel is also a design factor for the final part as it controls, physical mechanisms such as carbon diffusion (acts as a buffer), mechanical properties, cracking resistance, thermal expansion mismatch, residual stresses and so on. The optimum thickness of the intermediate layer should be chosen by a suitable modelling approach around the intermediate layer.
In powder bed AM technologies, the feedstock flows from the powder platform to the build chamber and overflows to another container to coat one layer of material at a predefined thickness. Hence, there are several parameters involved in this processing method that influences the sound production of FGM or multi-metallic materials. schematically shows the PBF system with the parameters to be used in the forthcoming calculations.
Figure 35. Cross section of a PBF machine showing the dimension parameters. The re-coat arm conveys the particles to the build chamber, making one layer of material at each movement.
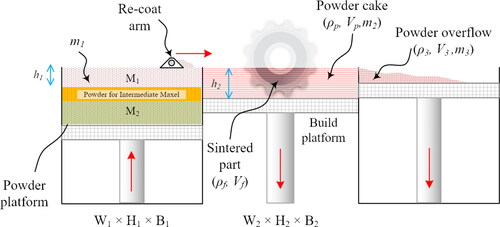
According to the mass conservation, for each layer of powder coating:
(2.1)
(2.1)
where m1 is the total mass collected from the powder platform, m2 is the total mass coated on the build platform and m3 is the total overflown mass. On the build platform, both fused and powder states of the material coexist, thus:
(2.2)
(2.2)
where mp and mf are the masses of powder and fused solid respectively. This can be expressed in density and volume terms:
(2.3)
(2.3)
where (ρ1, V1) is the density and volume of the collected powder from the powder platform, (ρ2, Vp) is the density and volume respectively of the non-fused powder on the build plate, (ρf, Vf) is the density and volume of the fused solid on the build platform and (ρ3, V3) is the density and volume of the overflown powder. The width (W), material height (h) and breadth (B) of the compartments can be introduced to the EquationEq. (2.3)
(2.3)
(2.3) in the following manner:
(2.4)
(2.4)
(2.5)
(2.5)
If the density of tapped powder is 70% of the density of the solid material and the density of the untapped overflown powder is 50% of the density of the solid material, EquationEq. (2.5)(2.5)
(2.5) reduces to:
(2.6)
(2.6)
EquationEq. (2.4)(2.4)
(2.4) can be used to identify the powder height for each section of the material with respect to the tapped and overflown powder densities. EquationEq. (2.4)
(2.4)
(2.4) can be further simplified if the ratio of V3/Vs is measured as a function of layer height. Using the formulations above will facilitate positioning of the feedstock material for AM processing of multi-metal components, especially with respect to planning the interfacial maxel if it is needed at the interface of the two alloys (see left part of ).
Because of challenges relevant to powder handling, cross contamination of the feedstock, difficulty in planning and parameters selection, there are limited attempts to make multi-metallic material using the PBF-LB technology. Therefore, production of multi-metallic components is currently better addressed by the DED technologies. Improvements in this area are expected in the coming years owing to recent advancements in PBF instrumentation.
3.3.2. Directed energy deposition methods
In DED methods, the height of each layer is a function of substrate wetting, process heat input, dilution level, thermal properties of the deposited material, type of deposition technology and effective heat dissipation from the build structure. Ding et al. (Citation2015) have shown that increasing the power and decreasing the travel speed, increases the single bead deposition height. Brandl et al. (Citation2011) have shown that when the heat input and the travel speed changes, the height and width of the single bead will vary, yet, the cross-section area of the deposited material remains constant. Increasing the power will reduce the deposition height and increase the deposition width. On the other hand, increasing the travel speed decreases the height and increases the deposition width. They have also shown that intensifying the material feed rate increases the height and leaves the width of the deposition relatively unchanged. Therefore, one of the best possible ways for controlling the height of the deposition is changing the material feed rate. Higher material feed rate often requires higher heat input to effectively fuse the extra material onto the substrate.
Intermediate layer can also be applied in DED methods. schematically shows how the layer separates the M1 and M2 materials. The chemical composition of the intermediate maxel is close to both M1 and M2 materials, while M1 and M2 differ chemically.
Figure 36. DED deposition with an intermediate layer.
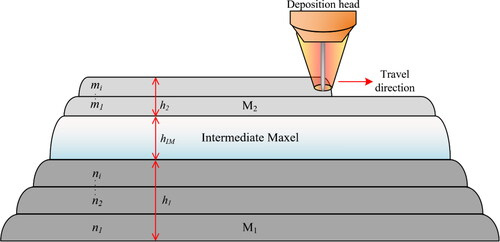
In this type of deposition, the mass conservation rule is important. The mass of fed material should be nearly equal to the total deposited material, assuming that there is no loss in the system.
Fuerschbach (Citation1994) as well as Unocic and DuPont (Citation2004) developed a model for laser and arc LENS processes to predict melting efficiency as a function of Rykalin (Ry) and Christensen (Ch) dimensionless parameters (Christensen, Citation1965; Rykalin, Citation1951). The dimensionless parameters used to correlate the cross section of the deposited size to processing parameters are defined as follows:
(2.7)
(2.7)
(2.8)
(2.8)
where qi is the net power into the deposition structure, S is the travel speed, α is the thermal diffusivity at liquidus temperature, ΔH is the enthalpy of melting and A is the single layer deposition cross section area. They have shown that the relationship between Ry and Ch is linear, and the melting efficiency (ηm) is equal to the ratio Ch/Ry:
(2.9)
(2.9)
where ΔH is the average value of substrate material and deposited material. The dilution percentage D is defined through EquationEq. (2.10)
(2.10)
(2.10) (DuPont & Marder, Citation1996):
(2.10)
(2.10)
where ηa is the process efficiency (0.5 for laser and 0.7 for arc), Vdm is the volume of deposited metal, P is the process power (laser power or volt-ampere for arc), Es is the energy for melting the lower layer, Edm is the required energy for melting the deposited metal defined by:
(2.11)
(2.11)
(2.12)
(2.12)
shows three different levels of dilution when two beads with circular cross-sections are deposited on top of each other. Side-by-side deposition of the beads were investigated and reported by Xiong et al. (Citation2013). In order to correlate the height of the built wall structure with dilution level, we developed an analytical approach with the following assumptions:
Figure 37. Schematic illustration of the beads with different dilution levels.
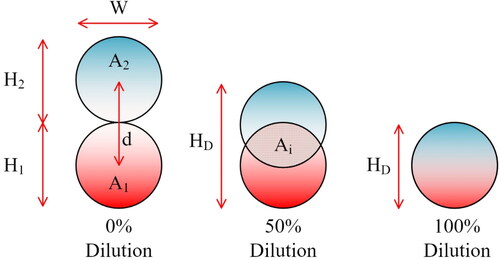
The cross sections of the deposited beads are circular.
The diameter of the circle corresponds to the width of the bead W.
The cross-section areas of the deposited beads are equal: A1=A2.
Ratio of Ai/A1 or Ai/A2 is representative of the dilution level D.
Using trigonometrical and geometrical rules, the intersecting area Ai can be calculated from EquationEq. (2.13)(2.13)
(2.13) :
(2.13)
(2.13)
where d is the centre-to-centre distance of the two beads. With these measures, the height of two beads can be defined as:
(2.14)
(2.14)
shows a chart with calculated values of HD and dilution percentage (D) based on EquationEqs. (2.13)(2.13)
(2.13) and Equation(2.14)
(2.14)
(2.14) . It can be seen that the deposition height (HD) varies more if the bead width is larger. In other words, for the same dilution level the final height of the deposited beads is larger for larger deposition widths. The major relationship between deposition heigh and dilution level is linear except for low dilution levels. shows the effect of the bead width on the slope of the D-HD curves (where D is dilution level). The depicted line suggests that for larger beads, the effect of beads size on dilution is less pronounced. From these illustrations, it can be inferred that any developed formulation for predicting the dilution and deposition height as a function of process parameters will be more reliable when the bead cross section is large. Heat input and deposition rate are among the factors with a direct effect on the bead cross section size.
Figure 38. Correlation between dilution level and height of the built structure. The block lines are the calculated segment area (Ai) and the broken lines are the calculated dilution levels (Ai/A1) for four different bead widths.
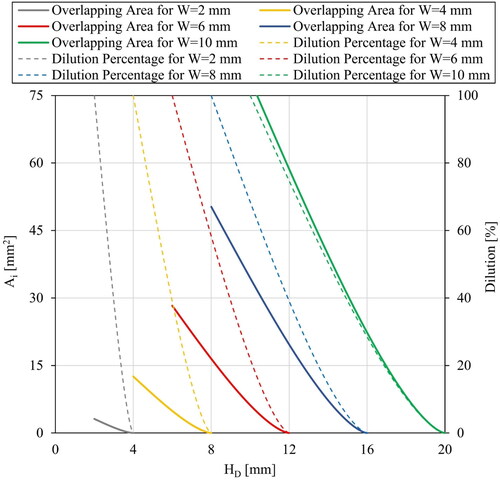
Figure 39. Effect of the bead width on the slope of dilution vs. height curves.
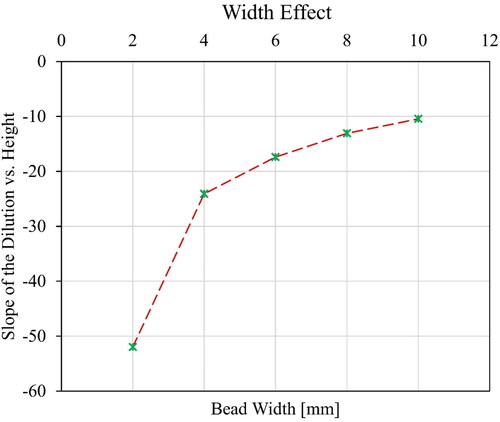
The height of the deposited layers can be connected to the physical properties of the materials. By combining EquationEqs. (2.10)(2.10)
(2.10) and Equation(2.13)
(2.13)
(2.13) , the height of the deposited beads in different materials but with the same deposition rate and shapes can be calculated using EquationEq. (2.15)
(2.15)
(2.15) :
(2.15)
(2.15)
where A1,2 is either A1 or A2 if they are equal or otherwise, the arithmetic average of the two areas. The dilution level is determined by two different approaches: the left-hand side of the equation is calculated by process parameter terms and the right-hand side of the equation is composed of the geometrical related terms. EquationEq. (2.15)
(2.15)
(2.15) is a design equation that will help identifying the process parameters from the desired deposition geometry or vice versa.
3.4. Iron-based alloys
3.4.1. Bimetallic steel components
The presence of various steel classes and their broad range of properties have classified them as the dominant material in structural applications. Additive manufacturing allows us to design and produce Fe-based FGMs with complex shapes for demanding applications requiring a combination of properties. Typical applications may include deposition of corrosion resistant surface layer on low or high strength substrates, abrasion resistant materials on ductile substrates and so on. In the sections to follow, the performance of bimetallic configurations is not foreseen for an explicit application. The focus is rather on metallurgical phenomena associated with the bimetallic product manufacturing.
In general terms, processability of steels by AM decreases with increasing hardenability. Martensite formation increases hardness at the expense of ductility and toughness. In this context, processing of a large number of steel classes by AM is challenging due to the combined effect of increased hardenability and fast cooling rates associated with the AM processing conditions. The hardenability of steels increases with increasing austenite grain size and the so-called ‘carbon equivalent,’ CE, which is a compositional term including the carbon content and alloying additions (see EquationEq. (2.16)(2.16)
(2.16) below) (Wang, Citation2015). In 2010, Talaş (Citation2010) studied a large number of proposed CE formulas for steels and classified them in terms of microstructure and mechanical properties. Their suggested expression for CE is described by the formula shown in EquationEq. (2.16)
(2.16)
(2.16) which is based on microstructures evolved upon thermal cycling.
(2.16)
(2.16)
Calculations of CE is common in welding technology and owing to the obvious similarities, it is directly applicable in designing steel materials for AM. Adequate control of cooling rate, process anomalies, cracking, and hard phase formation in steels, requires pre-heating of the processed parts at a temperature level determined by the CE. summarizes a selection of pre-heating temperatures for various CE values:
Table 5. Recommendation for selection of pre-heating temperature (98).
shows the effect of the CE value on the Jominy hardenability depth for the AISI 4043 steel. The upper and lower CE values were determined using the maximum and minimum content of each element in the standard specifications of this alloy. This figure reminds that there might be variations in the amount of martensite formed, not only for a bimetallic component but even for a single alloy at the same quenching rate, owing to local compositional variations.
Figure 40. Hardenability of the AISI 4043 steel within the standard range of elements’ content.
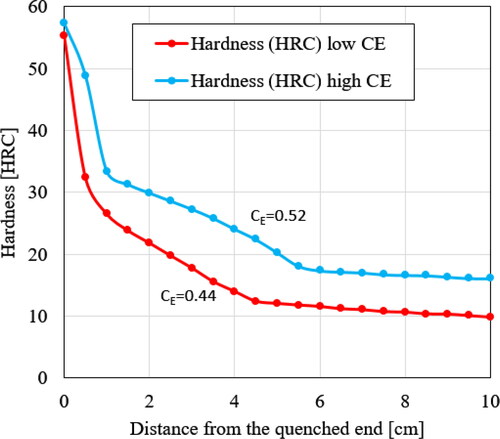
As the distance from the Jominy quench end increases, the cooling rate decreases accordingly. At high CE the ‘C’ curve front in the CCT diagrams shifts to the right (longer time), increasing the susceptibility to martensite transformation even at relatively lower cooling rates. In various AM technologies, cooling rates of about to 104 K/s can be experienced. Hence, efforts to avoid martensite formation by decreasing the cooling rate will be more effective for low CE values since the high CE materials will require quite large decrease in the cooling rate to values beyond the AM processing window.
Three major improvements can be devised for printability of steels with varying CE:
Use of feedstock material within a compositional specification range that gives the lowest CE.
Designing the AM build process in such a way that the build temperature increases, in some cases even above 500 °C, towards decreasing the subsequent cooling rates.
Maintaining the build temperature above martensite transformation temperature, towards preventing cyclic martensite transformation.
Processing of high carbon steel components with powder bed AM showed that lack of preheating deteriorated the structural integrity of the final product through evolution of cracks, porosity and surface roughness in the printed parts (Taha et al., Citation2012). Moreover, carbon-containing materials undergoing a thermal cycle (laser or arc) can emit various types of carbon species such as graphene, nanotubes, carbon black and so on (Shi et al., Citation1999; Zhu et al., Citation2010), that may be deposited on sensitive parts of the machine imposing machine and human health hazards (Hu & Zhou, Citation2013). In WAAM and EBAM technologies, deposition of high carbon steels can be performed with the same recommended precautions as in welding.
For steels with different chemical compositions being parts of a multi-material component, the manufacturing parameters should be determined by the steel with the higher CE. Steels with distinct CE values have also different expansion, conductivity, and heat capacity coefficients, which will induce residual stresses near the bimetal interface. Thus, it is important to apply stress annealing after production, especially prior to mechanical cutting from the build plate or substrate (Wu et al., Citation2014).
3.4.2. The FGM/build plate interface-the need for support structures
Unless being a part of the final product, the manufactured parts should be easily detached from the build plate. This may be problematic if interfacial phases increase the adhesion of the manufactured part on the build plate. Formation of phases at the build plate-part interface can be mitigated by using support structures. Such a structure provides physical distance between the part and the build plate that keeps the sensitive regions and anomalies far from the actual part. These structures will be removed in the end of the process. Support structures are dominantly used in LS and PBF-EB type of AM, however, for other deposition and DMD technologies, support structures are excessively difficult to realize.
One possible way to manufacture support structures in WAAM is the pin welding method introduced by Fronius (Somoskői & Török, Citation2013). In this method, a part of the deposition wire is melted, attached and broken during three consecutive and controlled phases that result in a vertically standing structure on the surface (Wittwer & Enzinger, Citation2011). The shape of the pins depends on the thermal cycle and process parameters. Four well-practiced pin shapes are shown in . If the pins are printed closely enough to make the gap between them adequately small for the deposited material to bridge (usually 1–3 mm), the layers of the deposited materials can be laid over the pins instead of directly on the build plate. This method has the advantage that the deposition material has the same physical and chemical properties as the pin and the interface region will be away from the deposited part, which is removed in the end of the process. However, printing the pins close to each other can be challenging and they should be removed after completion of the deposition for the build plate to be re-used (i.e. support structures in PBF-LB). Moreover, bridging the gap between two adjacent pins is dependent on material properties, process parameters, position and so on, which require proper control to prevent formation of cracks and defects.
Figure 41. Welded pin structures. (Courtesy of Fronius GmbH.)
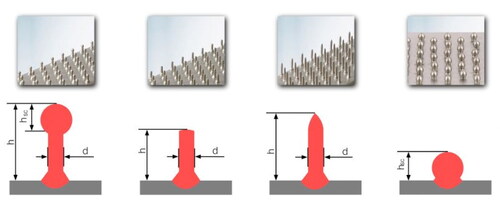
Wittwer et al. (Citation2012) explained that printing of the pins using CMT power supply can be straightforward when the material of choice is steel but in aluminium alloys, the arc stability was relatively poor due to the native Al oxide formed on the base material.
Printing any pin material on Al substrate may lead to poor wetting and limited fusion of the pin into the substrate if the oxide layer is not removed properly. Since parts of the pin undergo melting, the pin structure experiences thermal gradients, and solidification of the material at limited zones may result in excessive residual stresses.
Therefore, the body of the pin may experience deformation upon cooling. To compare the distribution of temperature, stresses, and distortion, two cases were simulated and analysed using identical process parameters. In the first case, the steel pin was printed on a steel substrate and in the second case, the steel pin was printed on an Al substrate. shows the results of the FEM analysis for steel pin on the steel substrate case. shows the results of the same analysis for the case of steel pins printed on the Al substrate.
Figure 42. (a) Peak temperature, (b) Max. principal stress and (c) Total distortion of a printed steel ball pin on a steel sheet using the CMT technology.
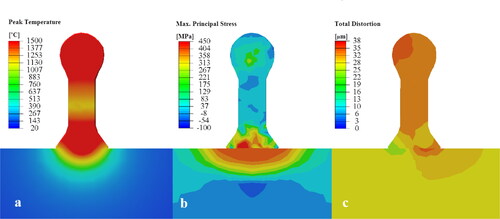
Figure 43. (a) Peak temperature, (b) Max. principal stress and (c) Total distortion of a printed steel ball pin on an aluminium sheet using the CMT technology.
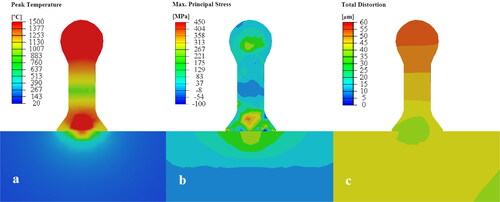
In these simulations, the arc heat input was imposed through a double-ellipsoid Goldak heat source (Goldak et al., Citation1984). The total process time for the two-step arc ignition was set to 1 second. The process parameters were taken from Somoskői and Török (Citation2013). The comparison of the peak temperature distributions in the two cases shows that the steel pin is relatively colder when printed on the Al substrate. This is due to the higher thermal conductivity of Al, which prevents the pin structure to reach a higher peak temperature. In this case, the expected higher cooling rate and the subsequent microstructural refinement of the pin structure increases the possibility of it attaining higher hardness. The maximum principal stress distribution shows that the steel pin on a steel substrate results in relatively larger stresses in the area around the base of the pin. Al also has a higher heat expansion coefficient that causes a larger distortion in the final product.
In WAAM, a high heat input and a short process time in the first arc phase, may effectively eliminate surface oxide formation and increase the local peak temperature in the substrate material. This can be also achieved by reversing the polarity (electrode + and wire −) in the first phase of the pin printing process. McClure et al. (Pang et al., Citation1994) showed that variable or reverse polarity improves surface cleaning in arc welding of Al alloys.
3.4.3. Bimetallic components of mild and stainless steels
The interface between mild steels and stainless steels usually contains brittle phases, the formation of which, depends on the level of dilution and introduced thermal cycles during the AM process (Arivazhagan et al., Citation2011). These interfacial phases can be predicted using the Schaeffler-de-Long diagram shown in . The Ni- and Cr equivalent values can be calculated using the following formulas (Kotecki & Siewert, Citation1992):
(2.17)
(2.17)
(2.18)
(2.18)
Figure 44. The phase constituents in the interfacial region in the bimetal AM (Jacob, Citation2018). A. austenite γ, F. ferrite α, M. martensite, 5-80%. mass percentage of ferrite in austenite. Risk zones are.
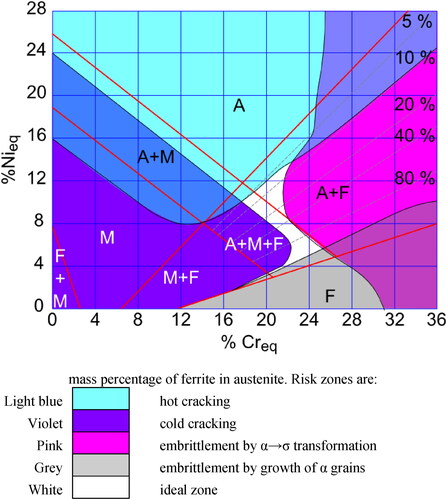
Owing to many possible material combinations, it is difficult to formulate a universal rule to warrant the quality of the final product. Therefore, the manufacturability and hardenability of each material should be considered separately prior to combining these metals in a single component. One approach towards reducing large mismatches is to introduce a third layer (Li et al., Citation2017) between the stainless and mild steel, with this intermediate maxel being an over-alloyed version of the stainless steel component, i.e. having a composition at the upper specification levels. This will decrease concentration (activity) gradients and therefore limit diffusion, ensuring thus a smooth transition of chemical composition at the interfacial region upon dilution from both metals. This intermediate maxel can be very thin for low dilution methods such as powder bed AM and relatively thick for high dilution methods such as WAAM, EBAM and RPD.
Each steel composition can be exhibited by a point in the diagram based on the calculated Nieq and Creq for that specific alloy. When combining two alloys, the two points on the diagram should be connected by a tie-line. The line will pass through one or several regions of the diagram indicating the possible phases formed in the interfacial region of the two selected alloys.
Besides the use of the Schaeffler-de-Long diagram in , an extra design criterium can be applied for the intermediate maxel. Thus, for bimetal components that are produced for high temperature applications, the intermediate layer should be chosen to be Ni-rich. This will prevent carbon migration (You et al., Citation2001) from the other two materials and therefore reduce the risk of degraded creep resistance (Laha et al., Citation2001).
Although good results can normally be achieved by preheating, AM of dissimilar steels may still result in hydrogen (cold) and solidification (hot) cracks. In such cases, selection of the appropriate intermediate material becomes quite demanding. The use of an intermediate maxel is called “buttering” in joining and welding technology (Balakrishnan et al., Citation2011). If an unalloyed, low alloyed or insufficiently alloyed intermediate material is used, a martensitic region will form (lower left corner of ). Thus, the transitional region can be extremely hard with a pronounced tendency to cracking, especially if hydrogen is present. Although inert atmosphere in LS, vacuum atmosphere in PBF-EB and shielding gas in WAAM are used, hydrogen in the feedstock material (Soller et al., Citation2015) may diffuse to the interfacial region. If AM of bimetals takes place by adding a second material on a premade part from another material (e.g. cladding or hybrid parts), the heat cycles for joining the layers of the second material can result in formation of HAZ on the first premade component. The HAZ of an unalloyed or low-alloy substrate material can contain varying amounts of martensite depending on its chemical composition and process parameters. Cracking in the HAZ can also happen in the build plate, which necessitates careful material selection so that it is compatible with the layers of the new material. This problem is more pronounced in the DMD technologies where support structures are hardly used. shows the developed cracks in the HAZ region that can propagate into the deposited material and cause fracture.
Figure 45. Cracks in the HAZ. Deposited low alloy steel on an austenitic stainless steel.
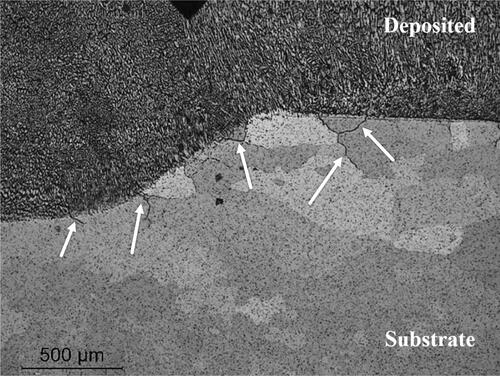
Design of the transition region microstructure should be towards making austenitic phases since the hydrogen solubility in austenite is higher than other phases, resulting in reduced risk of hydrogen embrittlement (Louthan & Derrick, Citation1975).
Hot cracking is caused by impurities segregating in the inter-dendritic liquid upon metal solidification. These last to solidify impurity-containing phases normally have low strength and can easily crack under thermal stresses upon cooling. High-alloy steels such as austenitic steels are very prone to hot cracking (Yu et al., Citation2013) and therefore, steels containing some ferrite are preferred. This justifies the ‘ideal zone’ in the Schaeffler-de-Long diagram. High Mn content has been reported to significantly reduce the susceptibility to hot cracking in stainless and high alloy steels (Arata et al., Citation1977).
3.4.4. Bimetallic components of cast iron and steel
Cast irons normally present degraded mechanical performance when undergoing fusion processes such as welding or AM because of formation of brittle phases in the microstructure. Cast iron wires to be used in EBAM and WAAM do not exist commercially and except one published method (Stashenko et al., Citation2009), technological limitations and absence of market push, prohibit the wire production. Moreover, since the wire is exposed to extreme temperatures in the AM processes the viability of the carbon morphs in the deposited cast iron material is questionable. AM processes, using powder as feedstock, can potentially utilize cast iron powder. There has been a number of studies in recent years regarding production of cast iron powder from machining swarf by milling technology (da Costa et al., Citation2003; Fawcett, Citation1978; Karandikar, Citation1991; Shaibani & Ghambari, Citation2011) targeting mostly to powder metallurgy applications and products (Ilango & Ramakrishnan, Citation1990; Takeuchi et al., Citation1982). Fouquet and Szmatula (Citation1988) used laser surface melting on grey cast iron material. They have shown that by overlapping multiple scan paths of a continuous wave CO2 laser, transforms the austenitic surface of grey cast iron to white cast iron phases consisting of austenite, cementite, and martensite, causing a significant increase in hardness. Therefore, it can be inferred that using AM technology to sinter cast iron will result in generation of very brittle structures that may fail by cracking during the build process. White and brittle classes of cast iron are not in general suitable for AM technologies because of their excessive hardness and lack of ductility.
The most direct application of white cast irons in AM is through indirect SLS and densification of the printed parts (Vallabhajosyula & Bourell, Citation2009). In this method, a preform with low green density is printed using easy to print materials, leading to a part that is porous or has intentionally designed open channels. The low melting point (white) cast iron material will then be infiltrated in the part to make a densified component. The choice of cast iron for infiltration instead of classical copper material is justified by the fact that cast irons show good fluidity, hardness, and stability at comparatively high temperature. However, carbon diffusion from cast iron to the preform metal (usually steel) may cause problems such as lowering melting point of the preform material and extensive distortion (Vallabhajosyula & Bourell, Citation2011).
Nevertheless, building a new material on top of a preformed cast iron part or cladding the cast iron components using AM is still a valid procedure in the manufacturing industry. Therefore, process optimization requires understanding the metallurgical challenges at the interfacial region.
Yellup (Citation1995) investigated the blown powder (laser cladding) deposition of various materials on cast iron and concluded that the process parameters that directly affect the level of dilution play a central role in the integrity of the final product. The solubility of carbon in nickel (0.18 wt%) is higher than that of carbon in iron (0.022 wt%) and owing to the large solubility of nickel in iron and their physical and mechanical compatibility, nickel-based materials become suitable candidates for AM technologies such as cladding, deposition and repair. Fernandes et al. (Citation2011) deposited Ni-based alloys using plasma transferred arc technology on cast-iron and reached the same conclusions with respect to the dilution effect. On the contrary, enhanced dilution increases the quantity of precipitates and carbon flakes at the grain boundaries, which act as inoculants or grain refiners. In addition, increasing dilution reduced hardness in all regions of the deposited material, according to their study.
As stated before, if steels are to be deposited on cast iron, nickel buttering can contribute to a uniform structure. The intermediate layer may be as thick as the dilution depth, depending on the applied AM technology.
Although preheating of cast iron prior to AM or welding is not necessary, a preheating up to 300 °C has been recommended in some studies (El-Banna, Citation1999). The use of nickel alloys on cast iron may result in distortion or high residual stresses in the structure, because of the large difference in the thermal expansion coefficient between these two alloy types. Subsequent stress relieving methods may reduce residual stresses in the final bimetal structure.
3.4.5. Bimetallic components of low alloy and mild steels
When combining low alloy and mild steels in a single component using AM, the process parameters shall be chosen according to the low alloy steel whilst the intermediate maxel should be chosen according to the mild steel, as explained below. Even if the intermediate maxel is largely diluted by the low alloy steel, limited diffusion of the alloying elements is expected since they are originally present in low content in the low-alloy steels. This means that the hardenability of the intermediate maxel will not change significantly allowing thus a wider range of material types to be used as intermediate layers. However, this is not the case if the intermediate maxel is largely diluted by the mild steels. Carbon migration is also a major challenge in combining steels with different levels of carbon content as in bimetal components of low alloy and mild steels. In additive manufacturing, especially in powder bed methods, steels undergo a thermal cycle that varies from point to point. The cooling rate differs depending on whether the build area is close to a support structure and heat sink or away from the bulk metal surrounded by the powder. However, the maximum temperature that molten pool can reach is a function of the laser power, the linear speed of the laser and the heat capacity of the material. Modelling and experimental observations suggest that the local temperature in LS can reach as high as 1800 °C (Romano et al., Citation2015; Zeng et al., Citation2012). In WAAM, like in welding, the molten pool temperature can reach as high as 1600–2200 °C depending on the processing conditions (Azar et al., Citation2012; Block-Bolten & Eagar, Citation1984; Kluken & Grong, Citation1989). Owing to the high cooling rates in the mentioned AM technologies, the dwelling time at such high temperatures is just a fraction of a second. Regardless of the material being exposed to such high temperatures for only a very short time, carbon diffusion can take place across the interface of two steels with different carbon contents. It is worth mentioning that the interstitial diffusion coefficient of carbon in steel at all temperature ranges is among the highest as compared to other elements (Jäniche et al., Citation2013; Seith & Heumann, Citation1939). Both the migration and diffusion coefficient of iron in steel decreases as the carbon content increases (Jäniche et al., Citation2013). The diffusion rate for carbon in ferrite (α) and austenite (γ) at various temperatures is described as follows (Shabalin, Citation2014):
(2.19)
(2.19)
(2.20)
(2.20)
An example for visualizing the effect of temperature and carbon composition gradient in the interfacial maxel is given below:
Two steels with medium and low carbon content have formed a segmented FGM with a sharp interface maxel. The chemical compositions of the steels are given in .
Table 6. Chemical composition of two selected steels.
The diffusion rates in ferrite and austenite are calculated using EquationEqs. (2.19)
(2.19)
The dwelling time span for diffusion in the austenite region is chosen to be 1 second at different temperatures since the cooling rate in AM is relatively high.
The dwelling time span for diffusion in the ferrite region is chosen to be 1 month at different temperatures. Such long-time span is chosen in order to visualize the effect of long-term carbon diffusion, especially at slightly elevated service temperatures.
It is assumed that the concentration maintains at a value D0 (50% of the difference in carbon concentration) at the interface maxel (x = 0) according to the Fick’s second law.
shows the result of carbon diffusion mathematical calculations using EquationEqs. (2.19)(2.19)
(2.19) , Equation(2.20)
(2.20)
(2.20) and the abovementioned assumptions.
Figure 46. Diffusion of carbon in austenite (a) and ferrite (b) at different temperature ranges.
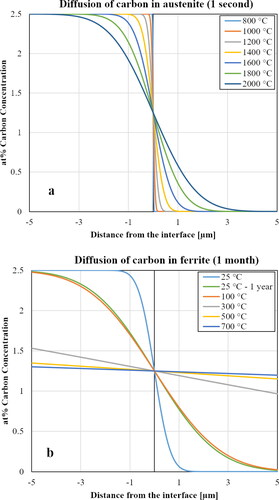
As expected, show that diffusion of carbon in austenite at high temperatures (800–2000 °C) happens at a much higher rate compared to the diffusion of carbon in ferrite at low temperatures (below 700 °C down to RT). For example, the carbon diffusion at 1400 °C differs from that at 25 °C by six orders of magnitude.
The change in carbon concentration of a steel exposed at 1600 °C for 1 second is similar to the change in the same steel left at room temperature (25 °C) for 1 month. shows that elevated service temperatures for FGM materials for a long time (i.e. several hours) can be detrimental in terms of mechanical properties since the carbon content is influenced within a long distance from the interfacial maxel. For example, leaving the proposed segmented FGM at 700 °C will equalize the carbon content over a very large distance from the interface within just one month of service. The carbon diffusion at room temperature is also considerable. illustrates that after 1 year, the carbon concentration changes within about 5 µm from the interface.
The abovementioned explanation suggests that a segmented FGM consisted of low-alloy and high-alloy steel is only viable in the very first moments after processing. Carbon diffusion, even at RT, will make the interface region reaching an equilibrium with a carbon content close to that of mild steels. Diffusion also shows the necessity of introducing a buffer maxel that prevents fast migration of carbon between the two steels. Such an intermediate material may either have a carbon content level between the two main materials -if diffusion is allowed- or of limited carbon solubility for hindering diffusion.
3.4.6. Bimetallic components of different low alloy steels
Most low-alloy steels can be thermally fused without significant process complications. However, calculating the CE value before making multi-metal components is necessary and the steel with the higher CE value should dictate the choice of suitable process parameters. Calculated CE values for several most used low-alloy steels are tabulated in . The low-alloy steel classes on the left-hand side can be fused or sintered with mild preheating, whilst those on the right-hand side require special preheating due to their relatively high CE values.
Table 7. Calculated CE ranges for some of the most industrially applied low alloy steels
As a general trend, addition of alloying elements reduces the steel thermal conductivity (Peet et al., Citation2011), and thus low-alloy steels have relatively higher thermal conductivity. shows computed temperature dependent thermal conductivity of three different steels, low-, medium- and high-alloy. The low-alloy steel shows higher thermal conductivity at all temperatures. Therefore, local heating applied in various AM methods creates a larger HAZ in low alloy steels increasing the risk of cracking. Selection of process parameters for these materials in all AM methods should therefore lie within a low heat input regime. In LS, the laser beam velocity should be higher, or the laser power should be within a lower range in the given process window. In WAAM, implementing modern deposition technologies such as CMT is useful for low alloy steels since the overall heat input in the process is reduced significantly (Azar, Citation2015).
Figure 47. Comparison between temperature dependent thermal conductivity of selected low-, medium- and high-alloy steels.
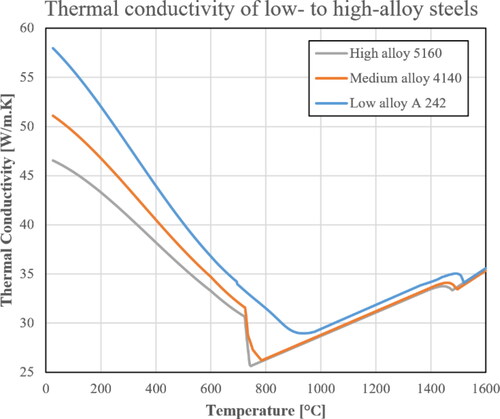
Calculating thermal conductivity of powders is challenging because of their discontinuous structure and lower relative density. Laubitz (Citation1959) reviewed a number of proposed models to calculate powder thermal conductivity and he suggested a new approach based on uniform distribution of spherical particles.
According to this approach, the modified formula for calculating thermal conductivity K is:
(2.21)
(2.21)
where K is the effective thermal conductivity of the two-phase medium (powder + gas/vacuum), Km is the conductivity of the continuous phase (gas or vacuum), K0 is the conductivity of the powder material if it was in bulk form, ρ is the fractional volume of powder particles, σ is the Stefan-Boltzmann constant, ε is the emissivity of the powder material, and a is the linear dimension (i.e. average diameter) of the particles.
The emissivity of materials in powder form is a function of temperature and powder particle size. Sih and Barlow (Citation1995) measured the emissivity of an iron powder with particle size <45 µm and a tap density at 54% of the relative density (Neville & Rabiei, Citation2008). Using EquationEq. (2.21)(2.21)
(2.21) , the results of these calculations closely match the experimentally measured values for SLS reported by Alkahari et al. (Citation2012).
shows the temperature dependent thermal properties of a selected steel in bulk and powder form. The thermal conductivity of the powder decreases monotonically with decreasing temperature in contrast to that of bulk metal, which starts increasing below the allotropic γ→α transformation temperature. This is also reflected inEquationEq. (2.21)(2.21)
(2.21) that separates the effect of high and low temperatures as shown by the two terms inside brackets. The average thermal conductivity and thermal diffusivity of the bulk over the shown temperature range are about 60 and 6 times respectively higher than that of the tapped steel metal powder.
Figure 48. (a) calculated thermal conductivity and (b) thermal diffusivity of bulk and powder AISI 4140 steel, using formulas from (Gustafsson, Citation1991; Laubitz, Citation1959) respectively.
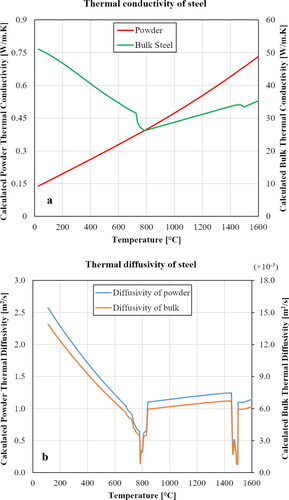
Particle size has a pronounced effect on the thermal conductivity of the powder as shown by . and , show that changes in thermal conductivity originated from chemical composition variations can be compensated by changes in the powder size distribution. Indeed, this becomes important when different steels are chosen to form a multi-metal component, each of which having different thermal conductivity. The choice of an appropriate particle size distribution of at least the first few initial layers of the intermediate maxel can reduce the mismatch in thermal conductivity between the two metals in a bi-metal component. This will help stabilizing processes in manufacturing of bi-metal components and significantly reducing the efforts for fine-tuning the process parameters.
Figure 49. Effect of powder size distribution (based on EquationEq. (2.21)(2.21)
(2.21) ) on calculated thermal conductivity of AISI 4140 steel powder.
![Figure 49. Effect of powder size distribution (based on EquationEq. (2.21)(2.21) K=[KmK0Kmρ23+(1−ρ23)K0Km(ρ23−ρ)+(1−ρ23+ρ)]+[4σT3εaρ(1−ρ23+ρ43)](2.21) ) on calculated thermal conductivity of AISI 4140 steel powder.](/cms/asset/2cdcb27c-0435-41de-83c9-e7c0f7a63a05/tems_a_2073568_f0049_c.jpg)
Yagi and Kunii (Citation1957) suggested a simpler approach for calculating the conductivity of the packed powder bed consisting of particles with small contact areas. They considered a weighted contribution of particle mass and the surrounding gas during conduction and suggested the following formulae for calculating the thermal conductivity (ke) in the packed powder bed:
(2.22)
(2.22)
where ks is the solid conductivity of the metallic powder and kg is the conductivity of the gas filling the gaps between the powder particles. The term µ is the volume fraction of the solid and Φ is an empirical factor, which is determined by experimental measurements of the thermal conductivity value at room temperature. This approach is valid only up to the onset of the particle sintering temperature, beyond which, the contact area between adjacent particles increases. Jamshidinia et al. (Citation2013) proposed that the relationship between the temperature induced particle fusion neck (contact area) and the thermal conductivity of the particles is described by the following formulae:
(2.23)
(2.23)
where keq is the equivalent thermal conductivity of the powder, Λ is the normalized particle-to-particle contact conductivity, Iph is the mean photon path and is estimated to be equal to the solid powder particle size, σ is the Stefan-Boltzmann constant and T is temperature.
Therefore, the thermal conductivity of the powder can be divided in two regimes, that before and after reaching the particle sintering temperature so that EquationEqs. (2.22)(2.22)
(2.22) and Equation(2.23)
(2.23)
(2.23) can be applied, respectively.
In order to explore the implications of the powder thermal properties upon the selection of process parameters, we developed an analytical method based on the approaches of Rosenthal (Citation1946) and Rykalin (Citation1953), assuming that the laser beam scans over a single powder layer in an autonomous condition. It was also assumed that the sintered layer connects to the underlying solid material upon fusion and the powder distribution is uniform with spherical morphology. In such conditions, the heat conductivity and diffusivity of both solid material and powder are important. Therefore, as a rough assumption, these two factors are calculated as bulk and powder average values at all given temperatures.
Sintering and deposition phenomena are governed by transient (time dependent) heat conduction. Heat conduction in 3D will then be defined by EquationEq. (2.24)(2.24)
(2.24) (Haug & Langtangen, Citation1997):
(2.24)
(2.24)
where Q is the rate of heat generation, qx, qy and qz are the heat fluxes at three Cartesian directions, T is the temperature, ρ is the density, C is the specific heat of material and t is the time. According to Fourier’s heat conduction law the heat fluxes can be defined as below:
(2.25)
(2.25)
where λ is the temperature dependent thermal conductivity of the material (average of powder and bulk). By combining EquationEqs. (2.22)
(2.22)
(2.22) and Equation(2.23)
(2.23)
(2.23) and transforming to tensor format, EquationEq. (2.26)
(2.26)
(2.26) can be extracted:
(2.26)
(2.26)
where
is a vector differential operator, [V] is the heat mass transport vector,
is the heat flux vector, and q is the rate of heat generation in the unit volume. EquationEq. (2.24)
(2.24)
(2.24) applies to an object that is in a Cartesian coordinate system. As a result, Fourier’s law can be written in a matrix format as well:
(2.27)
(2.27)
where [λ] is the heat conductivity tensor in three dimensions. In the case of a laser beam as the heat source, the temperature field at a point below the centre of the tracking beam (y = 0) is given by:
(2.28)
(2.28)
where a is the thermal diffusivity, A is the efficiency of the laser (including the absorption by the powder), Q is the laser power, v is he scanning speed, and t0 is the time needed for the heat to diffuse over a distance equal to the laser beam radius and is given by:
(2.29)
(2.29)
where rb is the beam diameter.
It is assumed that the laser efficiency (A) is 50%, the laser scanning speed is 1.0 m.s−1 and the beam diameter is 150 µm. The t0 value is usually between 0.2 and 8 ms (Thompson et al., Citation2015).
shows the molten pool shape and isotherms at 400, 800 and 1200 °C for an AISI 4140 steel processed by AM (Jamshidinia et al., Citation2015). It is shown that the laser power has a significant effect on the molten pool shape and lower temperature isotherms. Increasing the power from 100 to 400 W with the same configuration resulted in a 70% widening of the molten pool from ∼85 to ∼145 µm. Makoana et al. (Citation2016) and Gong et al. (Citation2014) studied experimentally the molten pool geometry of SLM processed stainless steel and titanium and reported geometrical values in the same regime.
Figure 50. Molten pool shape and temperature gradient for powder bed laser sintering of AISI 4140 steel using different laser power (a) 100 W, (b) 200 W, (c) 300 W and (d) 400 W.
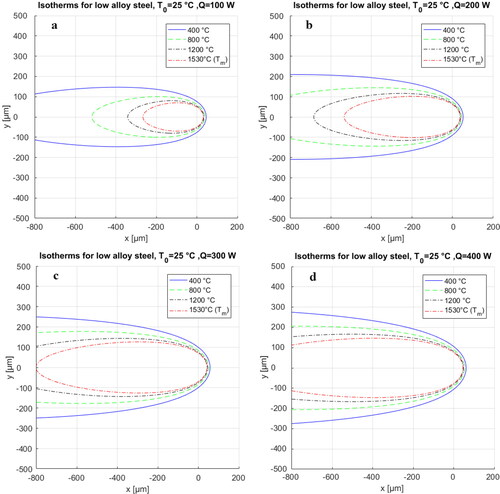
For multi-metal components, the first maxel is going to be fused onto the underlaying material having different chemical composition. In order to adjust the laser and process parameters, the same calculation should be carried out using the thermal conductivity and thermal diffusivity of the underlying material. This is illustrated by an example where two low alloy steels are fused on top of each other during the PBF-LB process. Their calculated bulk thermal conductivities are plotted as a function of temperature in . In the first calculation, it is assumed that both materials are low-alloy steels and the steel with lower thermal conductivity is fused on that having higher thermal conductivity (). In the second calculation, it is assumed that the high thermal conductivity low-alloy steel is fused on the low conductivity one (). EquationEqs. (2.24)–(2.29) are implemented in these calculations to produce the graphs in and .
Figure 51. Thermodynamically calculated thermal conductivities of two low alloy steels.
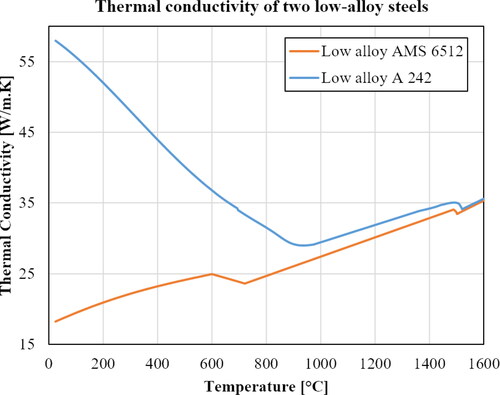
Figure 52. The shape of the weld pool if (a) low thermal conductivity steel powder is fused on the high thermal conductivity steel and (b) high thermal conductivity steel powder is fused on the low thermal conductivity steel, using the same process parameters. x and y are the molten pool dimensions in µm.
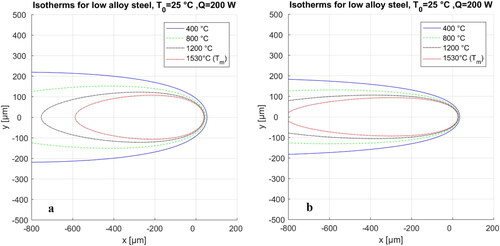
shows the effect of sintering sequences on the melt pool shape using two different steels. Since the molten pool size in y dimension is narrower (), the hatching space should be adjusted accordingly if the same laser parameters are used for both materials. Such calculations will enhance the quality of the FGMs in the interfacial layers. It is worth mentioning that the thermal cycle and cooling rate will also be affected when the molten pool shape alters.
3.4.7. Bimetallic components of tool steels and mild or low alloyed steels
The carbon content of tool steels can vary from 0.1wt% C (e.g., AISI P6) to 2.5 wt% C (e.g. AISI D7) and their CE ranges within 0.05–2.6, making some of the tool steel classes vulnerable for cracking and distortion. Tool steels are subjected to cyclic loading and/or wear conditions. One of the main challenges when tool steels are subjected to thermal cycles is that they should have suitable fatigue and hardness properties. We used EquationEqs. (2.30)(2.30)
(2.30) and Equation(2.31)
(2.31)
(2.31) to calculate the hardness and fatigue requirements of 55 different types of standard tool steels (AISI Px, Dx, Lx, Ox, Sx, Wx, Mx, Hx, Tx classes) as a function of the CE and data from reference (Wegst, Citation2001). The hardness and fatigues strength of these steels are plotted versus carbon equivalent in . Two high order trend-lines are proposed for the instant estimation of the hardness and fatigue properties based on the CE value and vice versa.
Figure 53. Hardness and fatigue properties of 55 standard tool steels using data from reference (Wegst, Citation2001).
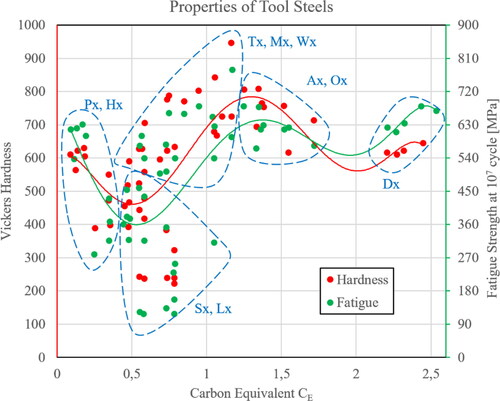
The following formulas below were used to generate the points of the plots in .
Fatigue strength (FS) at 107 cycles:
(2.30)
(2.30)
Vickers hardness:
(2.31)
(2.31)
The correlation coefficient in both cases is equal to 0.53. Special attention must be paid when calculating for exact values using the above proposed formulas. In some cases (e.g. for Tx, Mx, Wx, Sx and Lx classes), the scattering is large. Ax, Ox and Dx classes with high CE values will be in general difficult to process by AM. For the rest of the classes, a recommended preheating condition is necessary to apply to improve the printability of the materials. The preheating values suggested in can be used for tool steels too. In order to achieve similar hardness (i.e. 600–800 Vickers) and fatigue strength (540–700 MPa), Ax, Ox and Dx classes can be replaced by variants having lower CE values (e.g. Tx, Mx, Wx classes). Based on earlier discussions, we recommend low energy processing to limit the dilution when manufacturing bi-metal products using tool steel as one of the materials. Lower heat input will result in lower cooling rates and limited distortion and dilution. The thermal expansion coefficient of tool steels is between 10 and 13 µ strain/°C which is within the lower range for steels in general (from 8 to 20 µstrain/°C). Thus, distortion due to large thermal expansion differences should be considered when bi-metal components are to be processed with one of the components being a tool steel.
The strength level of tool steels may also vary significantly among the various classes. The lowest strength, 650 MPa, in the mentioned classes of AISI tool steels, belongs to the AISI S7 tool steel and the highest strength, ∼ 2.8 GPa, belongs to the AISI M41 high speed tool depending on the composition range. Medium to high CE tool steels are among the strongest ferrous materials. Therefore, combining tool steels with other alloys in a single part creates a significant strength mismatch, which may influence the performance of the FGM.
3.4.8. Bimetallic components of stainless steels and mild/low alloy steels
These bi-metallic components are used for fittings and flanges in pressure vessel and boiler manufacturing. In general, stainless steels can be additively joined together with mild/low alloy steels to form bi-metallic components without significant problems. Although preheating is not required, it is always beneficial to preheat and build the mild/low alloy steel below the stainless steel (Sun & Ion, Citation1995). Preheating is recommended due to the inevitable formation of martensite in the non-stainless side close to the interfacial maxel (Arivazhagan et al., Citation2011; Jang et al., Citation2008; Sireesha et al., Citation2000) and the subsequent increase in hardness. The martensite phase may become vulnerable to hydrogen cracking if preheating is not applied.
In addition to the martensite hydrogen embrittlement, loss in structural integrity can originate from carbon migration due to the gradient between the higher carbon content of low alloy steel, and that of the stainless steel. Owing to the higher diffusion rate of carbon in fcc-Fe (cf. EquationEq. (2.20)(2.20)
(2.20) ), the migrated carbon from the non-stainless steel side forms a carbon rich zone (Beaugrand et al., Citation2009; Coleman & Hainsworth, Citation2009) close to the interfacial maxel. This creates local disbanding and cracking at the interface and may lead to global failure depending on the service temperature and loading conditions. If the difference in carbon content is too high, buttering with nickel as an intermediate maxel can be beneficial. Coleman and Hainsworth (Citation2009) investigated the effect of a nickel layer in boiler tubing joints and reported that the Ni-based layer remains unaffected even after 10,000 hours in service.
shows a LENS deposition micrograph where nickel buttering was used as an intermediate maxel and the EDS line scan in shows the chemical composition variation across the intermediate maxel. Although the targeted thickness of the deposited Ni layer was 50 µm, Ni diffuses within a diffusion band of up to 25 µm on each side of the intermediate maxel. This demonstrates the extent of dilution when building material layers with different compositions. also shows the evolution of Type II boundaries which is discussed in Section 3.5.
Figure 54. (a) LENS deposition of mild steel on SS 316L with nickel layer as intermediate maxel and (b) Line scan of the chemical composition across the Ni-intermediate maxel.
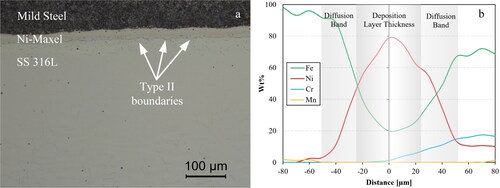
As stated before, the intermediate maxel prevents carbon migration and subsequent formation of a hard (brittle) layer at the interface. It also increases the bonding properties between two vastly different steels such as stainless steels and carbon steels. The light microscope micrograph in shows LENS deposition of a carbon steel on stainless steel without using an intermediate maxel. Type II boundaries do not exist in this case. However, a thin C-depleted zone forms on the top side of the diffusion layer. This micrograph was taken within few days after deposition, and it is expected that the micron thick carbon migration layer would have become thicker if enough time was given for diffusion to take place. The hardness variation across the interface in shows that when deposition is done without the Ni layer, the hardness value peaks at the interface region.
Figure 55. (a) LENS deposition of mild steel on stainless steel without any intermediate maxel and (b) hardness values of the intermediate layer region with and without Ni.
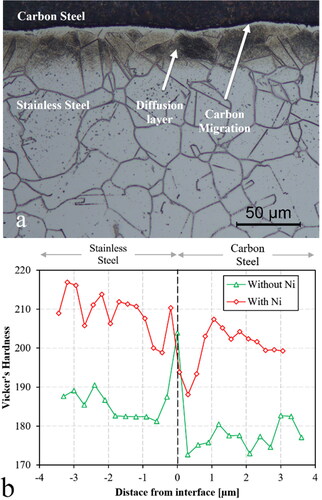
The light microscope micrograph in shows some typical deposition flaws at the interface region of the bi-metal steel material. We have observed this type of disbanding and porosity abundantly in samples without a nickel intermediate maxel. The relatively large differences in thermal expansion coefficient between mild steels and stainless steels and the lack of microstructural compatibility can be the main reasons for the formation of such flaws. The nickel layer mitigates the problem since Ni crystal structure is compatible with that of stainless steel (both fcc) and its thermal expansion coefficient is similar to that of carbon steel (∼13 × 10−6 [m/(m·K)] for Ni versus ∼15 × 10−6 [m/(m·K)] for fcc-Fe).
Figure 56. Deposition flaws at the interface.
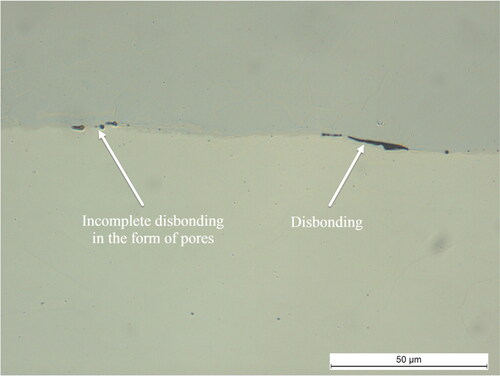
3.4.9. Bimetallic components of mild steels and aluminium
Bimetallic components of steel and aluminium are attractive for applications in sub-zero and cryogenic environments such as connecting flanges of aluminium cryo-tanks to steel pipes. The major limitation to produce Al-Fe FGMs is the large difference in the melting temperature of the materials. The Fe-Al phase diagram shows presence of various intermetallic compounds the formation of which may impair the mechanical properties of the interfacial maxel. More challenges arise from the large difference in thermal conductivity and thermal expansion coefficient. Therefore, instead of using process parameters that will result in extensive dilution of the two materials in the interfacial maxel, they should be fine-tuned to only melt the Al based material and form a brazing joint at the interface. To realize this, the Al-based material should always be built on the steel substrate or the underlaying material. Intermediate maxels from silver, nickel and copper have been reported influencing positively the brazing procedure (Andrews, Citation1963).
3.5. Nickel-based high temperature materials and superalloys
Most Ni-based alloys can be produced through at least one AM method. Ni-based alloys is a material family with a variety of compositions and properties, which make the establishment of generalized AM guidelines difficult. However, like steels, high strength nickel-based alloys become more difficult to process compared to the lower strength variants. Therefore, this section covers the most outstanding issues in AM of Ni-based alloys and subsequent sections will review the multi-metal topics with at least one nickel-based alloy involved.
There are many engineering advantages in combining Ni-based superalloys with other materials in a single component. Joining austenitic stainless steel and carbon steel in bimetallic components, may generate excessive residual stresses due to the large difference in the thermal expansion coefficient of the materials. This can be resolved by replacing the high-performance material (stainless steel) with a suitable nickel-based alloy as explained below. shows the temperature dependence of the linear thermal expansion of 4140 carbon steel, stainless steel 316L and Inconel 718. The linear thermal expansion of IN718 and carbon steel are similar at temperatures below 700 °C while the thermal expansion of stainless steel is about 25% higher than the other two alloys. Replacing stainless steel with IN718, for applications and/or specifications that allow for it, will result in lower thermal expansion-induced residual stresses across the interface, especially when the component is exposed to high service temperatures.
Figure 57. Linear thermal expansion of carbon steel 4140, SS316L and IN718 [167, 168].
![Figure 57. Linear thermal expansion of carbon steel 4140, SS316L and IN718 [167, 168].](/cms/asset/6a7acf6b-d2a6-41cc-986e-87d66b8cb745/tems_a_2073568_f0057_c.jpg)
The fcc crystal structure of nickel alloys, is responsible for their outstanding low temperature mechanical properties (Mills, Citation1980; Tobler, Citation1976) although some microstructural features such as continuous precipitation films at grain boundaries may be hazardous (Logsdon et al., Citation1978).
Understanding the dependence of the microstructures of Ni based superalloys on the processing conditions is important especially with respect to their performance at extreme conditions.
Beyond solid solution strengthening, the main strengthening mechanism of Ni-based superalloys is aging and precipitation hardening. The fcc γ matrix phase in these alloys has a lattice parameter a0 = 0.3616 nm containing up to ∼50 wt% of elements in solid solution. lists the most common precipitates found in the matrix.
Table 8. Precipitates found in Ni-based superalloys (169). Data extracted from Crystallography Open Database (COD) (170).
Depending on their brittleness and morphology, these precipitates may have beneficial or adverse effects when present in the matrix or at grain boundaries, respectively. Some of the phases are intermetallic compounds, carbides, and nitrides, consisting of several alloying elements. The presence of these alloying elements in solid solution in the matrix, after precipitation, will not only contribute to solid solution strengthening, but also eliminate complications during material sintering or deposition. For example, re-melted nickel metal is prone to oxygen porosity during solidification (Holt & Wallace, Citation1976). Addition of strong oxide and nitride forming alloying elements especially Ti and Al will mitigate the problem (Lee et al., Citation2004) as they combine with oxygen and nitrogen to form oxides and nitrides. Thus, reducing (deoxidizing) the feedstock prior to additive manufacturing practices is beneficial particularly for producing a low alloy nickel-based material.
Solidification cracking is a major challenge when Ni-based alloys are diluted with Fe-based alloys. This is attributed to segregation during solidification and formation of liquid films wetting the surface of the austenite grains. Previous work showed that solidification cracking is correlated with the difference between solidus and liquidus, namely solidification range. Ni-based alloys with long solidification range become more sensitive to solidification cracking (Knorovsky et al., Citation1989; Ramkumar et al., Citation2014; Thompson & Genculu, Citation1983). In this context, Ni alloys of the Monel family are prone to solidification cracking when joined with high Fe content alloys because of the large differences in stresses generated upon solidification (Sadek et al., Citation2000). Research focusing on the prevention of crack development near the interface maxel, suggested the deposition of an intermediate alloy consisting of 4–5 wt% Mn (Young et al., Citation2008) or 1–2 wt% Nb (Sadek et al., Citation2000) on either side of the bimetallic structure. Another successful example demonstrated the beneficial effect of an interfacial material containing 4–5 wt% Mn, in the production of a bimetallic component consisting of 4140 carbon steel and Monel 400 (Ramkumar et al., Citation2012). Naffakh et al. (Citation2009), Dupont et al. (Citation2003), and Banovic et al. (Banovic et al., Citation2002) used a Mn filler material to successfully prevent hot cracking when joining stainless steels to Ni-based alloys. It was shown that Mn forms MnS which limits the adverse effect of S in hot cracking (Arata et al., Citation1977). Some alloys in the Monel family (e.g. the Alloy 404), are rich in S and the thickness of the interface maxel should be larger than the dilution depth to avoid extensive dilution and subsequent enrichment of the interface in S (Kim et al., Citation2017) . Since there are few suitable commercial alloys (e.g. Mangalloy or Hadfield steel (Schmidova et al., Citation2016)) with relatively high Mn content, solidification cracking can be prevented by using them in the interfacial maxel. For AM processes using powder feedstock, elemental Mn powder can be blended in right proportions with the base material (Ivasishin et al., Citation2000; Schwendner et al., Citation2001; Yan et al., Citation2016) while in the case of wire feedstock, a high Mn deposition wire such as ENiCrFe-3 and ENiCu-7 is recommended.
The dilution of the layers can be calculated following the same guidelines as described in Section 3.3.2 and considering as an example IN718 [ρ = 8.22 g/cm3] deposited on a 304 stainless steel substrate [ρ = 8.0 g/cm3] via LMD. The laser power and deposition rate can be determined from the graphs in , which are plotted with basis EquationEq. (2.26)(2.26)
(2.26) . For calculating the effective melting power in , the ηa and ηm values were selected using the process described in Section 3.3.2, whilst the nominal laser power, P, and the latent heat of fusion (enthalpy of fusion) were taken from M. Handbook (Citation2008). Although the deposition travel speed does not appear in EquationEq. (2.26)
(2.26)
(2.26) , it affects the melting efficiency as defined by EquationEq. (2.25)
(2.25)
(2.25) and subsequently the dilution percentage. The plots shown in are in concordance with the high deposition rate parameters reported by Zhong et al. (Citation2017). Pulugurtha et al. (Citation2009) used the same approach based in EquationEqs. (2.23)–(2.25) to determine the optimum laser parameters and dilution percentage of Ni-Ti FGMs and found that the predictions agreed with the measured values.
Figure 58. Selection of effective laser power and materials deposition rate based on various dilution percentages.
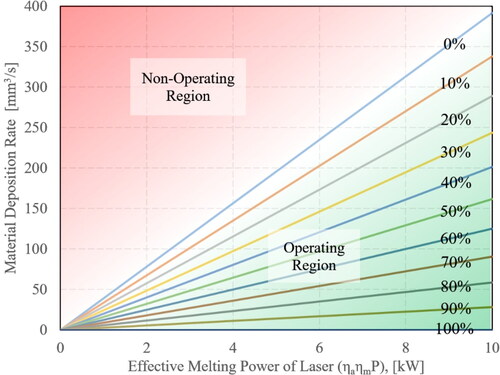
Knowing the material deposition rate and effective melting power, the dilution percentage can be read from the plots in , and the eventual deposition geometry can be mapped using EquationEq. (2.31)(2.31)
(2.31) . The calculated dilution factor can be used to determine the composition of the interface maxel, which will be subsequently used to define the phase constituents in the Schaeffler-de-Long diagram (). The use of this diagram should be limited to cases where the dilution is more than 75%. Below this level, the intermediate maxel will consist of a fully austenitic matrix possibly containing precipitates as those shown in . The input information for the Schaeffler-de-Long diagram should derive from the composition of the substrate rather than the deposition material since the molten pool forms on the substrate. Therefore, if IN718 is deposited on 316L, Creq and Nieq should be calculated for the 316L stainless steel after dilution (Lippold et al., Citation2011).
Nelson et al. (Citation1998, Citation1999, Citation2000) have discerned two types of grain boundaries in the transition region of a bi-metal component, where a nickel-based alloy (or austenitic alloy) is joined to a steel. They named them type I and type II boundaries and associated them with elongated shapes perpendicular and parallel to the fusion interface maxel respectively. According to these studies, type II boundaries, which probably form during deposition (Sireesha et al., Citation2000), and get mobilized upon post production heat treatment, are detrimental causing cracking and disbanding in service conditions. Yoo et al. (Citation2015) have shown that aging of the bi-metal structure causes migration of type II boundaries away from the interface. However, they have reported that the region between type II boundaries and the interface builds up the highest residual stress upon aging. This can be detrimental for both structural integrity and corrosion resistance of the component after long time exposure at high temperature service conditions.
As described earlier, dilution of nickel-based alloys upon joining with steels causes a broadening of the solidification temperature range of Ni-based alloys because of the increased Fe content. illustrates an example by showing the change in the solidification temperature range of IN718 as a function of its dilution, when it is deposited on 316L stainless steel. Increasing the dilution from 25% to 50%, widens the temperature range by almost 70 °C. With reference to , increased dilution decreases the deposition rate (and subsequently productivity), in addition to imposing a higher risk for solidification cracking. Therefore, suitable design of AM process parameters to eliminate cracking susceptibility should target towards lower dilution levels.
Figure 59. Effect of dilution of IN718 on its solidification path when IN718 is deposited on 316L stainless steel.
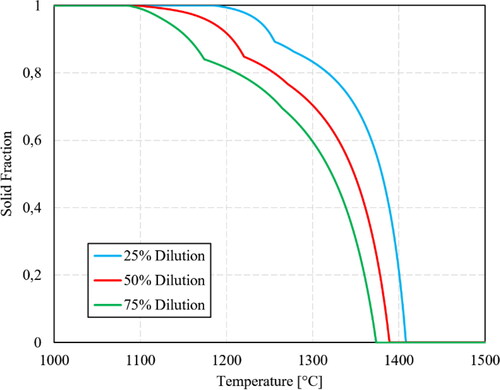
3.6. Aluminium alloys
Aluminium is the most abundant metal in earth’s crust. Its attractive properties such as low density, good electrical conductivity, high corrosion resistance etc., place Al as the second most widely used metal in various alloying forms and technological applications (electrical conductors, transportation, building and architecture, packaging etc.). Typical characteristics of Al and its alloys which are relevant for Al-based FGM, or bimetallic components can be summarized as below:
In commercial metals, except Pb, Zn and Mg, Al and its alloys are among those with the lowest melting points. The large differences in the melting points between Al alloys and other commonly used materials such as Ni, Fe, Co and Ti-based alloys, make it difficult to design and produce FGM and/or multi-metallic systems where fusion takes place over small scales or localized in the interfacial maxel.
In addition to its tenacious nature and the uniform and protective coverage of the base metal, the melting point of the native aluminium oxide is approximately 1400 °C higher of that of Al metal. This difference is among the highest in commercial metals. For comparison, the differences between nickel and nickel oxide (II) as well as between iron and iron oxide (III) are ∼500 °C and ∼30 °C respectively. Therefore, the amount of energy in the form of heat required to break the native oxide film in Al and its alloys is much higher than that required to break metallic bonds. This is an important factor to achieve successful fusion of Al-based particles or beads in AM processing.
The thermal properties of Al and Al alloys are also unique. Al has very high thermal expansion (∼22 × 10−6 K−1) and thermal conductivity (∼200 Wm−1K−1) and therefore Al-based alloys conduct heat efficiently and expand drastically. In AM, sufficient amount of heat is required for fusing the material locally. The specific heat of fusion for aluminium is approximately twice of that for steels and thus higher amount of heat is required. On the other hand, since the yield strength of most Al alloys is relatively low compared to other commercial alloys, large expansion will cause irreversible plastic deformation in the structure.
The emissivity coefficient of aluminium is very low (∼0.1). Al alloys do not change visual characteristics upon heating and using non-contact body temperature measurements for Al-based materials, leads to large errors. Therefore, process control based on non-contact sensors is not suitable for this material.
Aluminium does not undergo allotropic transformations and thus does not show phase transformation induced crystal plasticity.
Aluminium and its alloys crystallize in the FCC crystal structure and show resistance to fracture at low service temperatures. Thus, Al alloys can function as buffers for crack arrest in multi-metallic structures consisting of materials prone to brittle fracture and low toughness at cryogenic temperatures, as illustrated schematically in . At low service temperatures, the fracture toughness of material A decreases drastically and due to loading conditions, brittle fracture occurs. However, the relatively tough at low temperatures Al alloy, prevents further unstable crack propagation and therefore, either the crack is deflected and its trajectory remains within material A (Marsavina et al., Citation2013), or further crack growth requires more severe loading conditions, in the absence of which fracture is eventually avoided.
Figure 60. Crack arrest at low temperatures. Materials A and B suffers from low toughness and Al alloy maintains the toughness at relatively high level, preventing the crack from unstable propagation.
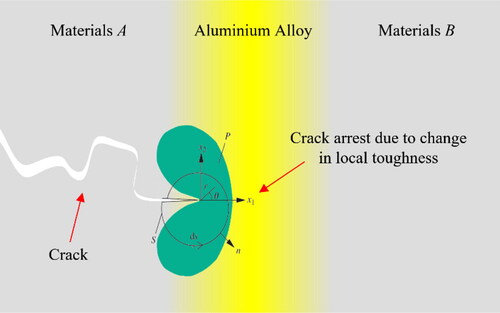
Hydrogen is detrimental for aluminium and its alloys. Although the Al crystal structure is less prone to hydrogen embrittlement, the major problem caused by hydrogen is porosity upon solidification. The solubility of hydrogen in molten aluminium at 1500 °C is approximately 10 ml/100 g, dropping dramatically with reducing temperature and reaches a value of 0.001 ml/100 g at approximately 300 °C (Ransley & Neufeld, Citation1948; Talbot & Anyalebechi, Citation1988). Extreme changes in solubility level will result in formation of gas bubbles and subsequent porosity in the solidified metal. As a comparison, the solubility of hydrogen in steels drops only three times (from 30 ml/100 g to 10 ml/100 g) within the same range (Kiuchi & McLellan, Citation1983). If Al combines with other metals or alloys in an FGM, the presence of hydrogen in Al results in accumulated porosity in the interfacial boundary and can cause severe debonding.
Aluminium tends to form intermetallic compounds which are usually brittle and deteriorate mechanical properties. Common intermetallic compounds/phases are FeAl3 and AlNi when Al combines with Fe and Ni respectively. The formation of these compounds/phases should be controlled upon processing and/or post-processing treatments as their shape, localization and dispersion may affect the mechanical properties and structural integrity of bi-metallic or multi-metallic structures consisting of Fe-based and Ni-based alloys, having Al alloys as intermediate buffer.
The large difference in melting points between Al alloys and steels makes the production of FGMs or bimetallic structures consisting of these alloys challenging. This can be mitigated by using an intermediate maxel, having a melting point between that of Al and the steel of choice.
shows a range of melting points of various metals which are the basic constituents of most commercial alloys. The composition of the intermediate material in a FGM or a bi-metallic structure consisting of an Al alloy and a steel should consist of elements preferably within the green shaded area. However, this is only a first step towards selecting the appropriate maxel material and a more careful approach considering interfacial phase formation is necessary. Selecting a maxel material with one of its basic elements having a higher melting point than Al (e.g., Si) does not necessarily imply that the melting point of the multi-metallic construction will increase gradually from the Al side to the steel side. A eutectic phase possibly formed at the Al-alloy/maxel interface may have a melting temperature lower than that of the Al-alloy (and the Si-containing maxel material). On the other hand, enhanced dilution on the steel substrate, and significant diffusion of Si in the liquid state, may reduce the fusion temperature of the steel more than that of the Al alloy. In this occasion, the large gap in the melting point between the Al-based and Fe-based components will be further mitigated.
Figure 61. Melting points of some commonly used commercial materials.
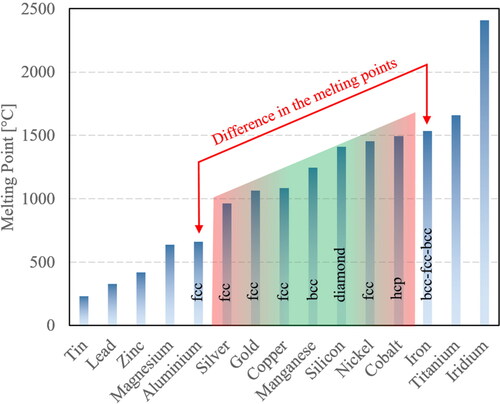
Agudo et al. (Citation2008) and Windmann et al. (Citation2015) investigated the deposition of AlSi3Mn1 alloy on the steel substrate and reported acceptable mechanical properties of the material. However, they observed a thin layer of intermetallic phases in the interfacial area the formation of which was reported to depend strongly on the heat input during the process.
shows various intermetallic compounds existing in the Fe-Al system (Atabaki et al., Citation2014). The formation of each compound depends on diffusion rates and mass balance at the interfaces.
Table 9. Fe-Al intermetallic compounds and their physical properties.
Diffusion of Al in Fe will cause growth of the intermetallic layer. The growth rate (GR) of FeAl and Fe3Al compounds can be estimated by EquationEqs. (2.32)(2.32)
(2.32) and 2.33 (Hibino, Citation2010):
(2.32)
(2.32)
(2.33)
(2.33)
FeAl and Fe3Al have overlapping stability ranges and they compete when they form. shows the ratio of the growth rates. At relatively lower temperatures, FeAl grows thousands of times faster than Fe3Al. At about 1500 K the growth rate of FeAl and Fe3Al will be equal.
Figure 62. Growth rate (GR) ratio of FeAl over Fe3Al from 500 to 1500 K.
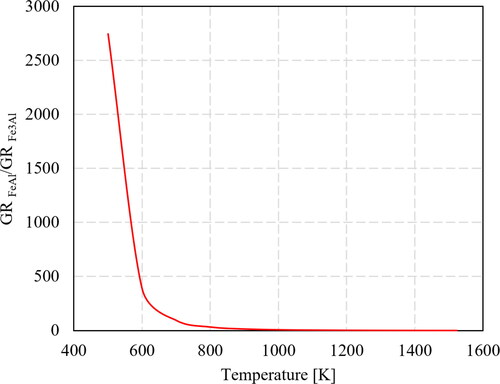
The consumables for arc-welding aluminium alloys with steels have chemical compositions high in silicon due to advantages such as low melting points and high melt flowability. Excess Si would result in extended solidification range and hot cracking occurring during the process. The residual stresses built upon deposition may exert load on the mushy material, the magnitude of which depends on the geometrical complexity and physical properties of the alloys in the body of the FGM. In general, the cooling rates of deposited Al alloys are quite high and the alloys remain in the mushy region only for a few seconds (Chen & Kovacevic, Citation2004). (a) and (b) show the mushy zone fracture surfaces of two Al alloys containing relatively low and high iron content, respectively. Although both alloys show similar failure mechanism, the hot tearing susceptibility of alloy (a) is almost twice as high as that of alloy (b) (Razaz & Carlberg, Citation2019). The increased hot tearing risk in high-strength Al alloys is the main reason for developing only a few Al compositions for additive manufacturing, which are mostly in the near-eutectic composition with short solidification ranges.
Figure 63. Difference between the fracture surfaces for aluminum alloy compositions with high (a) and low (b) susceptibility of hot tearing after tensile test in the mushy zone (Razaz & Carlberg, Citation2019).
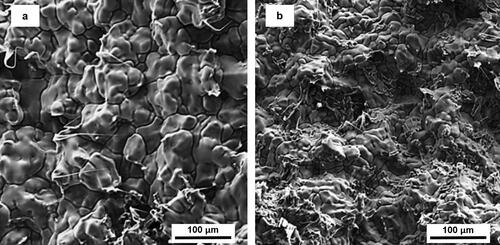
illustrates the effect of Si on the solidification range of Al–Si alloys. Compositions close to 0 wt% Si show a narrow mushy zone while increasing the Si content to 1% drastically increases the solidification range. In the range of 12–13 wt% Si, the eutectic phase forms and the solidification range is close to zero in equilibrium conditions.
Figure 64. Effect of Si wt% on solidification range of the Al alloy.
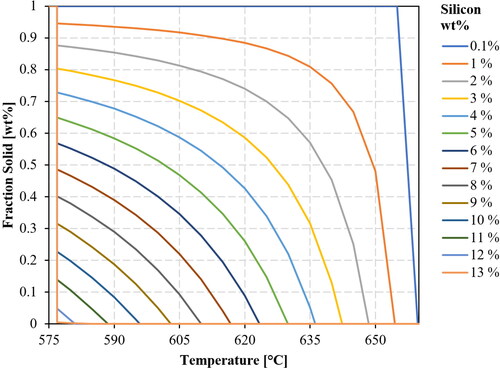
Kim et al. (Citation2012) investigated the possibility of joining Al alloys to steels using the cold metal transfer (CMT) technology. They have used galvanized steel to improve wettability and facilitate the deposition of Al alloys with various Si content. They concluded that increasing Si content reduces the thickness of the intermetallic layer and increase the tensile strength of the hybrid material. However, the long solidification range alloy (Al – ∼ 5 wt% Si) shows a plunge in tensile strength most probably because of the hot cracks developed upon deposition. The Zn in the surface coating creates an Al–Zn alloy at the steel-Al alloy interface. This phenomenon was not observed when the coating was a Zn–Fe alloy. In the example above, it is preferable for the intermediate maxel in the Al–Fe FGM to be pure Zn (i.e. a metal with melting point lower than Al) rather than a Zn–Fe alloy with a melting point between Al and Fe. These results were confirmed in separate studies performed by Padmanabham et al. (Citation2013), Milani et al. (Citation2016) and Madhavan et al. (Citation2016).
4. Cooling rate measurement for AM components and FGMs
Additively manufactured structures are built under processing conditions, which impose cooling rates up to 104 K/s (Frazier, Citation2014) for PBF methods. The cooling rates are generally higher for the PBF technologies than DED. However, they can be mitigated by bed heating options if available. The cooling rate is a determining factor for the development of microstructural features, the generation and magnitude of residual stresses, the associated properties (mechanical strength, toughness, corrosion resistance etc.) and subsequently material performance in relevant applications. The effect is even more critical in the case of multi-phases, multicomponent structures such as those in functionally graded materials. It is therefore important to measure and/or predict cooling rates in additively manufactured functionally grated materials or bi/multi-component structures.
4.1. Direct measurements
These methods are based on monitoring direct temperature measurements versus time. There are several well-developed and commercially available methods for direct measurement of the temperature field or thermal history. The three commonly used are described below:
4.1.1. Thermocouples
Au–Pt or Pt–Pd thermocouples are widely used for high temperature measurements. In metal deposition and AM technologies, the thermocouples are embedded close to the region of interest, from the build tray side. shows a sample design for a metal deposition build tray with embedded thermocouples. In this system, the metal is deposited in the form of bead-on-plate on the position of the thermocouple back holes and the temperature variations with time are logged. If the thermocouples are placed close to the root of the deposition layer, the entire temperature history can be retrieved.
Figure 65. Placing thermocouples in the build tray of a metal deposition setup. (a) shows the design and dimensions in mm and (b) shows the deposited beads.
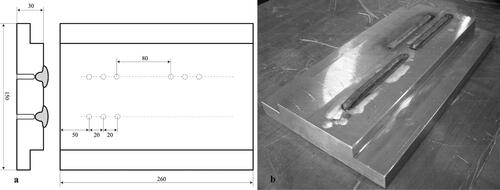
The thermocouples can be used in the PBF technology by embedding them in the build plate, using the same approach. However, as the build hight increases, the distance from the measurement points to the melt pool will also increase, resulting in lower peak temperature readings. Since it is not possible to physically move the location of the thermocouples, alternative methods are required for direct temperature reading from the fused layer, namely infrared thermographic methods that is explained later in this section.
The advantages and disadvantages of the method are shown below:
4.1.2. Laser guided IR thermometers
In this method, a hand-held portable device is typically used to measure the black body radiation of the target material and convert the amount of the emitted infra-red radiation and emissivity to electrical signals and subsequently temperature values. For high accuracy, this method requires precise calibration of the emissivity value for each measured free body. The devices are usually equipped with a laser pointer that is used to aim at the location where a temperature measurement will take place. The spatial resolution of the measurement depends strongly on the distance between the thermometer and the target. A large distance increases the detection spot size and therefore, the temperature information comes from a relatively larger area as compared to shorter distances.
The advantages and disadvantages of IR thermometers are:
4.1.3. Thermographic imaging
This technology is based on the concept of IR emission from a free body. Thermography allows logging of data regardless of the exact region and distance from the target. The field of view in thermographic cameras are larger than the hand-held thermometers and the temperature information is collected from a large surface rather than only a single point. This allows for direct comparison between any two regions or points and subsequently enables linear or areal profiling on recorded images or movies.
Thermography is used in powder bed AM for detecting flaws during the build process (Dinwiddie et al., Citation2013; Everton et al., Citation2016; Moylan et al., Citation2014) as well as for measuring temperature gradients in directed energy deposition technologies. The method is commonly referred as melt pool monitoring system (MPM). However, for in-situ measurements, shielding of the bright heat source increases the accuracy of the technique (Bicknell et al., Citation1994). The challenge when using IR thermography in the manufacturing of FGMs is that the difference in emissivity of the materials involved makes the measurements less accurate. In the new digital systems, the challenge lies in signal processing. This can be resolved by mapping the IR image over the acquired field of view and resolving the temperature value for each material using its specific emissivity. The maxel region of a FGM has a mixed emissivity making logging difficult. However, the heat flow in the materials on both sides of the FGM region can be handled by following the described technique. For individual analysis of the building blocks in an FGM, an external thermal wave source is required for calibration. This technique is called lock-in or modulated thermography (Meola et al., Citation2002).
4.2. Indirect measurements
The cooling rates employed in additive manufacturing are found also in conventional processing routes such as casting or welding. The already gained knowledge over several decades can be applied in additive manufacturing. Indirect methods are based on measurements of microstructural features, such as the dendrite arm spacing (DAS), see , developed at known cooling rates. Typical methodologies utilize directional solidification experiments performed on a Bridgeman furnace (see ) where known applicable cooling rates cause measurable changes in the DAS. It is common knowledge in solidification theory (Flemings, Citation1974; Jones, Citation1982; Kurz, Citation2001) that the average cooling rate, applied during various solidification processes, is the product of the temperature gradient in the liquid ahead of the solid-liquid interface and the solid-liquid interfacial (or growth) velocity. At high interfacial velocities and small to moderate temperature gradients dendritic structures dominate with the overall microstructure (including DAS) being refined with increasing the average cooling rate. Directional solidification experiments using, for example, a combination of thermal valve and a Bridgeman furnace where the cooling rate is predetermined, can be used to produce microstructures with controlled morphology (). The DAS in these produced microstructures can be measured and subsequently plotted versus the applied cooling rate (see ).
Figure 66. Effect of cooling rate and metal powder atomization method on the dendritic arm spacing of four different materials.
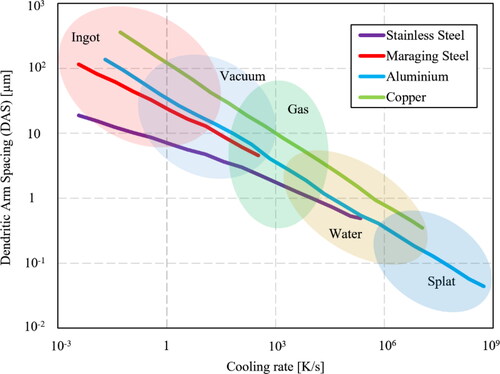
Figure 67. A Bridgeman furnace configuration used for directional solidification experiments.
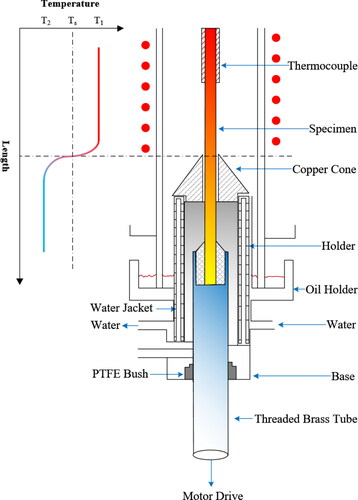
Figure 68. Dendritic microstructures after a directional solidification experiment in a Bridgeman furnace.
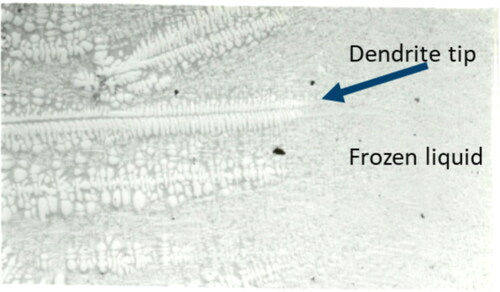
Figure 69. Dependence of DAS on cooling rate for the C355 Al alloy after directional solidification using a thermal valve and a Bridgeman furnace.
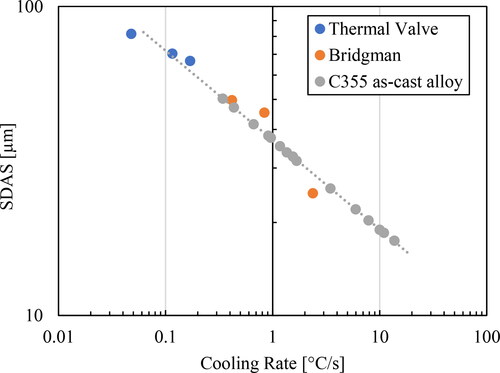
Measuring the DAS on various components made of the same alloy (see ) and using plots such as that in we can deduce the cooling rate imposed to various parts of the product. When this information is projected to various geometric features, compositional variations, stress/strain state of FGM, it can give important feedback in adjusting/optimizing AM processing parameters.
Figure 70. Measurement of DAS on along various directions on a turbocharger directionally solidified casting.
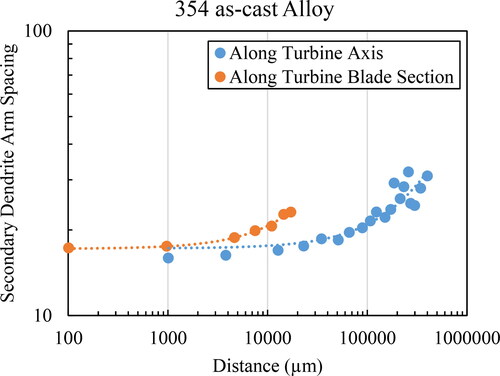
5. Postproduction challenges of multi-metallic components
5.1. Corrosion
Metal corrosion is one of the most usual and severe types of material degradation, imposing serious financial consequences. Only in the USA, the economic impact of corrosion damage accounts for almost 5% of the gross national product (GNP), 60% of which is seemingly unavoidable (Davis, Citation2000). One of the most rudimentary mechanisms of corrosion is galvanic corrosion also referred as ‘bimetallic’ or ‘multi-metallic’ corrosion (Pryor & Astley, Citation1994). Galvanic corrosion takes place when two metallic components with different chemical compositions come into contact in an aqueous solution environment. The standard electrode potentials of metals and alloys are sorted in comparison to the saturated calomel electrode, within the so-called galvanic series chart (LaQue, Citation1975). The different compositions of the two adjacent components and subsequently their different electrode potentials give rise to galvanic corrosion with the most electropositive component acting as an anode and being corroded preferentially.
In additive manufacturing of multi-metallic systems, galvanic corrosion may influence the structural integrity of the multi-metallic part when the latter is exposed to corrosive (aqueous, humid etc.) environments. Although in their final commercial form the parts will be covered by specified protective coatings and paints according to their targeted applications, the assembled materials should guarantee a minimum corrosion risk or decelerated corrosion rate. This is crucial to avoid aggressive, uncontrolled corrosion and loss of structural integrity leading subsequently to catastrophic failure if the protective coating is damaged. As a provisional design measure, the corrosion behaviour of each alloy composition and possible intermediate gradients should be considered as a function of the environmental pH and the electrical potential in the so called Pourbaix diagrams (McCafferty, Citation2010; Uhlig et al., Citation1985).
Let us consider a bimetallic material system composed of Fe and Ni on each side of the contact as an example. Fe-Ni gradient materials are used in the cryogenic (Sun & Ion, Citation1995), high temperature (Naffakh et al., Citation2009) or nuclear (Hinojos et al., Citation2016) application. As a reasonable assumption we consider the intermediate maxel having a gradient composition, starting from pure Fe, and ending in pure Ni. shows the thermodynamically calculated Pourbaix diagrams for Fe and Ni using the FactSage software (Takeno, Citation2005). In order to understand which species in the bimetallic system corrodes under given pH-Eh conditions, the equilibrium diagrams of both metals in contact may be superimposed in a single diagram. shows the superposition of the Fe and Ni Pourbaix diagrams. The water stability region is shown between the two dashed lines. As shown in , O2 and H2 are stable above and below the H2O stability region, respectively. also displays the co-stability region of the Fe-Ni corrosion products which is relevant for a gradient chemical composition. Below the indicated co-stability region (Fe + Ni Corrosion), Fe will be sacrificed (Fe Corrosion) whilst above that region, Ni will be sacrificed (Ni Corrosion). In the case of a component with gradient composition, the Fe corrosion regions extends below the common Fe + Ni corrosion region therefore, the Fe-rich part will corrode more at low pH and Eh, and since this coincides with the H2 stability region, hydrogen embrittlement of the Fe-rich side may take place. Therefore, construction of combined Fe-Ni Pourbaix diagrams could reveal the in-service corrosion challenges of such a bimetallic system.
Figure 71. Pourbaix diagram of Fe (a) and Ni (b) in aqueous solution.
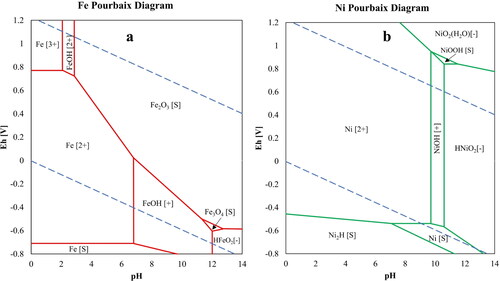
Figure 72. (a) Construction of bimetal Pourbaix diagram using the tie-lines of individual metals and (b) Final diagram, showing the gradient Fe + Ni corrosion region and state of corrosion behaviour.
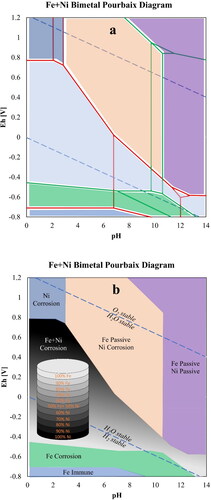
In addition to galvanic corrosion in components consisting of more than one type of metal or alloy, (micro-) galvanic corrosion can take place locally due to process-induced inhomogeneities or precipitates. shows corrosion attack on Al-5Mg material processed with WAAM. Thermal cycling caused precipitation of Cr-, Mn- and Mg-rich particles in the inter-layer regions. shows the variation in the Cr, Mn, and Mg content of particles through 3 successively deposited layers. The particles formed at the interfacial maxel show higher contents in Cr, Mn and Mg as compared to the particles formed away from the interfaces. This means that the adjacent matrix at the interlayer regions is depleted in Cr, Mn and Mg and this compositional difference causes a potential difference between the precipitated particles and the surrounding matrix triggering micro-galvanic effects in the presence of aqueous environment. The particles pointed with the arrows in are thus parts of local galvanic cells in this aqueous environment causing extensive corrosion attack of the surrounding Al matrix. suggests that corrosion takes place along preferred orientations since the attacked boundaries seem to form straight and almost perpendicular edges.
Figure 73. (a) Corrosion attack in the inter-layer region of an Al alloy processed with WAAM, (b) a close-up image of the same region, showing corrosion at preferred orientations.
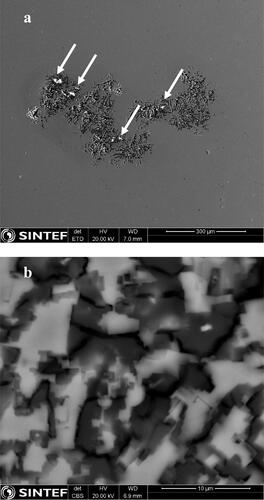
Figure 74. Content of Cr, Mn and Mg in the analysed particles within 3 subsequent deposited layers using WAAM (Azar et al., Citation2021).
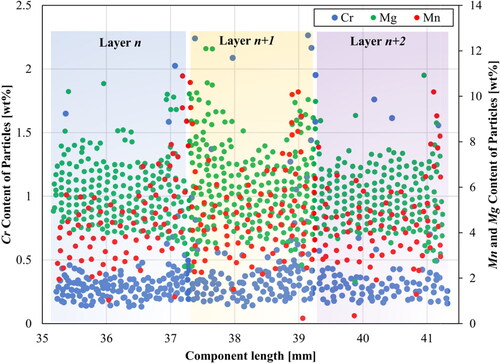
In many additive manufacturing processes, due to the layer-by-layer processing and the extensive thermal cycling, precipitation and subsequent ageing of the particles occur locally, causing compositional micro-inhomogeneities. This becomes more challenging when two different metals or alloys are combined in a single component, which can give rise to the formation of at least one or several stable intermetallic phases. The presence of intermetallic compounds is associated with differences in the corrosion potential in the system, causing micro-galvanic corrosion in the product (Buchheit, Citation1995).
5.2. Heat treatment
Another important challenge in the processing of multi-metallic parts is to design appropriate HT cycles, which not only prevent degradation of structural integrity of the built part but also optimize its microstructure and subsequently the properties.
Sing et al. (Citation2015) made a Cu-Al bimetallic component using AM and claimed that the HT is an engineering challenge, because of the disparity between the temperature-dependent properties of the individual materials. Viala et al. (Citation2002) investigated the HT of a bimetal cast iron-aluminium and reported that the elevated temperature causes formation of detrimental phases at the interfacial region that influence the mechanical properties. Zhe et al. (Citation2011) studied the behaviour of the interface between a low carbon steel and an Al-Si alloy upon HT. After several holding times, they observed that the reaction zone between two metals expands, and more phases appear upon longer exposure to heat (c.f. time-temperature-transformation behaviour).
We demonstrate HT challenges by considering a simple case study where two steels with different chemical compositions, and hence, different phase transformation kinetics are used to construct a bimetallic component. The AM deposition process and the post-deposition HT were simulated using finite element analysis (FEA) approach. The nominal chemical compositions of the two steels are given in .
Table 10. Nominal chemical composition of the steels selected for LMD-AM and HT simulations.
shows the superposition of the predicted CCT diagrams for the selected steel compositions in . Each constituent is shown with the ‘start’ and ‘finish’ lines. The constituent lines for the 51XX and 41XX steels are displayed with solid and dash lines, respectively. For the critical cooling (CR) lines shown in the diagram, it was assumed that the austenitization temperature is 850 °C for both materials. The martensite ‘start’ (Ms) and ‘finish’ (Mf) temperatures are displayed with horizontal lines.
Figure 75. Superimposed CCT diagrams of the nominated steels presented in .
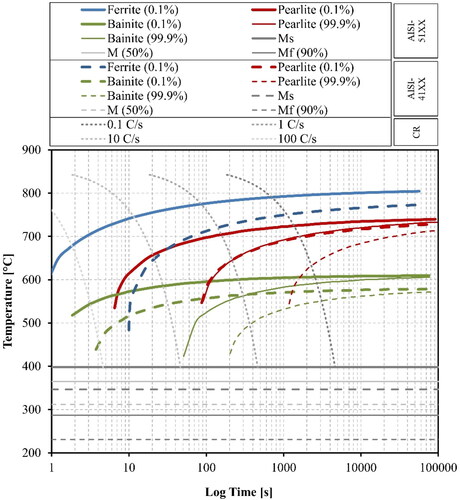
The finite element simulations are divided into two steps:
Step 1 aiming to simulate the layer-by-layer deposition. It was assumed that the three initial layers are made of 41XX steel, and the remaining two layers are made of 51XX steel.
Step 2 aiming to import the results of the deposition process and apply two different HT cycles. One of the cycles simulates the quenching of the entire cube and the other cycle simulates the furnace cooling conditions.
shows the construction and boundary conditions of the model. It was assumed that the 5-layer deposition takes place on a substrate that is leaning on a solid workbench. Four clamps are applied at the corners of the substrate to limit its warpage and distortion. The deposition toolpath is presented with the yellow arrows and the deposition tool orientation is shown with the black arrows at each turning point. The deposition speed is 8 mm/s and the deposition power source (WAAM or LMD) was selected as 1 kW with 80% efficiency. Due to the similar melting points of the selected alloys, equal power and process parameters settings were applied on both materials. The toolpath was rotated 90˚ at every layer, thus, the neighbouring layers have 90° rotated deposition pattern on x–y plane (z is along the build direction) (Azar, Citation2018). The overall size of the deposited cube is 25 × 25 × 25 mm.
Figure 76. Freebody illustration of the model with the applied boundary conditions.
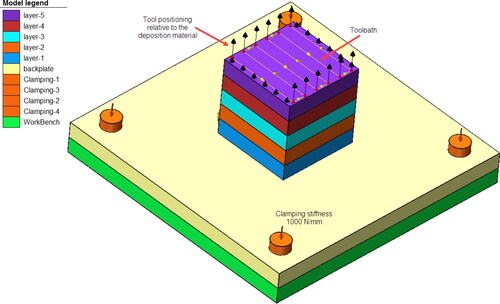
shows the temperature field developed in the middle of each layer during deposition. The size of the melt pool does not seem to be affected by the material change after the completion of layer 3. The substrate temperature rises significantly during deposition of the first layers but as the deposition height increases, the temperature rise is only limited on the deposited material body, thus increasing the change for heat treating the underlaying and previously deposited materials.
Figure 77. Temperature field during the deposition of the materials. Three first three layers are deposited using the 41XX steel and top two layers are deposited using the 51XX steel composition.
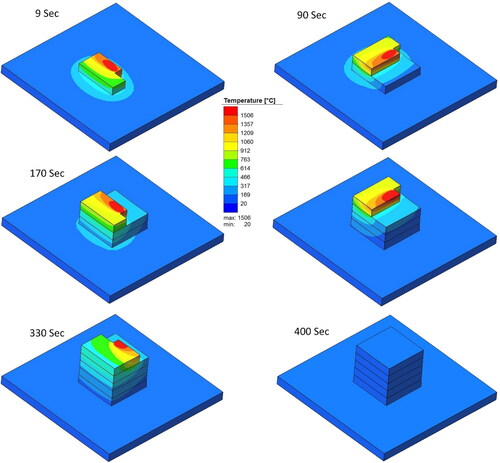
shows the mechanical response and phase constituents throughout the structure for the selected process parameters and resulting cooling rates. The maximum principal stress and total distortion values show higher values at the corners of the cube. Moreover, the three lowest layers show high residual stresses and distortions as compared to the last two layers, which can be a combined result of the variation in the material model and toolpath.
Figure 78. Phase constituents and mechanical response of the cube after deposition.
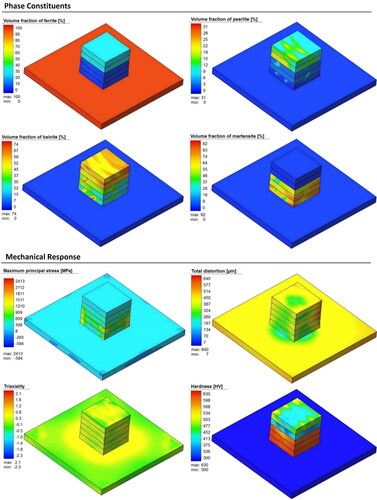
The hardness calculations were based on the predicted content of the phase constituents and the suggested hardness values from the CCT diagram. The variations in the volume fractions of ferrite, pearlite, bainite and martensite in the two deposited materials are illustrated in . The substrate was chosen to be 100% ferritic. The two layers on the top are also showing a higher ferrite content, as the result of the cooling rates controlled by the deposition process parameters. These two layers show almost no martensite content. Based on these observations and with reference to the CCT diagram, it could be claimed that the cooling rate on the top two layers of the block should vary between 1 and 10 °C/s.
HT simulations at low and high cooling rates were performed and their effect on the volume fraction of phase constituents and the mechanical properties of the deposited bi-metallic cubes are shown in and .
Figure 79. Phase constituents and mechanical response and of the cube after HT followed by slow cooling.
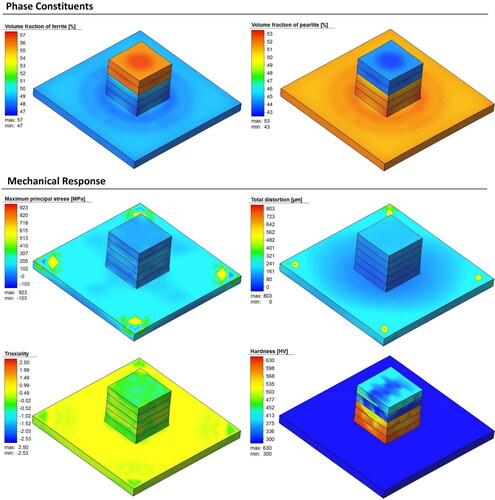
Figure 80. Phase constituents and mechanical response of the cube after HT followed by rapid cooling.
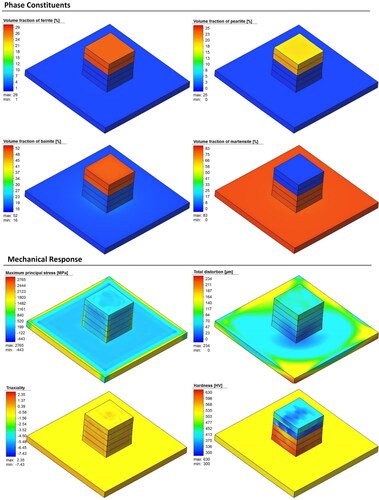
shows the same variables field of the built structure as after HT (austenitization) followed by slow cooling (air cooling conditions). The residual stress and distortion in the cube structure are significantly lower, mostly due to the relaxation occurring at high temperature, followed by slow cooling. The holding temperature in the HT simulations was set to 900 °C and 1 h. The predicted hardness of the cube is also somewhat lower since bainite and martensite did not form under the given conditions.
show the mechanical properties and the volume fraction of the phases formed in the bimetallic component upon water quenching from 900 °C. The distribution of the phase constituents of the two materials shows a more abrupt variation across the interface as compared to those formed under slower cooling conditions ().
Despite the different cooling rates employed in the two HT cases, the hardness values and their distribution on the cube seem to be relatively similar. Comparing the hardness range on the substrates in and , shows that the effect of cooling rate is more pronounced on the substrate hardness than the cube structure itself. Owing to its large surface area, the substrate acts as a heat sink and impose faster heat losses on the small cube even when the overall cooling rate is slow. In such conditions, it would be beneficial if the process was planned such as the ferrite forming alloy is deposited before the martensite forming alloy. This will also eliminate recurring thermal cycling of the martensitic material and mitigate the risk of cracking of the hard material or the interfacial region.
5.3. Residual stresses
Presence of residual stresses is one of the major technical challenges threatening the structural integrity of additively manufactured components. Residual stresses can be of thermal origin associated with the high thermal expansion coefficients of metals and the presence of temperature gradients, as well as phase transformations especially under recurrent thermal cycles. These phenomena are more pronounced and therefore more critical for multi-metallic systems such as the FGM. Understanding the evolution, magnitude, and distribution of residual stresses within the bulk of the component is of paramount importance in warranting the build success and eventual performance of the AM component.
5.3.1. Definition of residual stresses
Residual stresses (RS or σRS) are self-equilibrating mechanical stresses, which inherently remain in a body of the material upon processing. Residual stresses in a work piece affect its mechanical properties, resulting in premature structural failure when combined synergistically with externally applied stresses. RS can be classified in three different categories according to their scope of action and their characteristic length over which, they equilibrate (Macherauch et al., Citation1973; Withers & Bhadeshia, Citation2001). Type-I or long-range or macro-RS (σRS, I) equilibrate over macroscopic dimensions including all grains and phases within the bulk of the material. Every interference in the equilibrium of forces and moments of a volume containing type-I RS will change its dimensions. Macro-RS have various origins including the interaction between mis-fitting parts within an assembly, the generation of chemical, thermal, and plastically induced misfits between different regions of the same part. Type-II RS (σRS, II) are deviations from type-I RS and equilibrate over a volume including several grains of different phases. Macroscopic changes of the dimensions of a volume comprising equilibrated type-II RS may only be observed if distinct disturbances of this equilibrium take place. Type-III RS, (σRS, III), exist over atomic-scale dimensions and balance within a single grain. They are associated with local misfits at sub-microscopic scale, e.g., dislocations or other lattice defects. Macroscopic changes of the dimensions of the stressed material do not happen when the equilibrium of type-III RS is disturbed. The total residual stress, σRS, acting at a point of the material of a component or a structural part is the superposition of the three types of residual stresses: σRS=σRS-I+σRS-II+σRS-III. Residual stresses play a central role in the fatigue performance of materials because the loading level is well below the global yield. For a clear majority of materials, loading of the material below 40% of the ultimate tensile strength (UTS) makes insignificant fatigue damage, known as endurance limit (Kalpakjian, Citation2001). Therefore, keeping RS generated during recurrent thermal cycles below 40% of the UTS, can be used as an initial criterion for components processed by AM.
5.3.2. Phase transformation induced RS and characterization methods
Phase transformations, both displacive (i.e. occurring diffusion-less via the deformation of the parent crystal) and reconstructive (i.e. taking place via atomic diffusion) are associated with changes in crystal structure and subsequently contribute to the evolution of all three types-I, -II, -III of RS. Interactions between macro (type-I) and micro (type-II, III) RS are usual in phase transformations and their scientific understanding and monitoring is of profound technological importance (Clark & Wayman, Citation1970; Goldak & Akhlaghi, Citation2006; Jones & Alberry, Citation1977; Leblond, Citation1989; Pugh & Little, Citation1978). Phase transformation induced RS (type-II, III) may relieve the build-up of type-I RS in a component during its cooling from a high processing temperature to ambient temperature. Deconvoluting and controlling these interactions is important to optimize material processing and design. In this context, advanced numerical models by which, the material behaviour can be predicted, is a valuable tool.
Phase transformation induced RS are important in additively manufactured materials as they may exceed elastic limits or interfere with other sources of stresses (e.g. thermal during processing or external load upon service). Accumulated RS will also inhibit processing of large components due to risk of cracking and failure or else may create severe distortions that harm the metrological accuracy of the manufactured geometry. In AM materials, the selected build parameters focus primarily on minimizing the porosity. In materials with solid-state phase transformations, such parameters may promote the evolution of hard phases.
In the past decades, various destructive and non-destructive methods (e.g. X-ray diffraction, ultrasonic and magnetic probes, electronic speckle pattern interferometry and hole drilling) were introduced to quantify RS in solids. However, all these techniques acquire averaged data from the near surface material or cannot access all regions in a component, especially with complex geometry. Due to probe depth limitations, the above methods do not assess the stress state of the bulk of the material. Therefore, developing characterization methodologies with extended probe depths and improved spatial resolutions is compelling. Owing to their increased probing depth, neutron-based techniques, which can map and image residual stresses in the bulk, can provide new grounds for analysing complex additively manufactured geometries.
Maraging steel is a good example to illustrate the RS complications as it is by far the only ferritic steel, on the standard list of materials for powder bed fusion (PBF) technologies, where RS originating from solid-state phase transformations can be handled to some extent by adjusting the laser parameters. In this alloy, the onset of stable ferrite phase formation is restrained due to the high content of austenite stabilizing elements (e.g. Ni and Co) (A. Handbook, Citation1991). This suggests that even for relatively slow cooling rates, the final microstructure will be martensitic. According to Kaufman and Cohen (Citation1956), the martensite start (Ms) and martensite finish (Mf) temperatures are 210 °C and 103 °C respectively for this material, while the austenite reversion temperatures are between 570 °C and 604 °C.
In other words, each fused layer during PBF will become martensitic upon cooling, while within a depth of a few layers beneath the fused layer, the material will be austenitized and transformed again into martensite with a latency. At even longer distances below the fused surface, the material will be heated below the austenite reversion temperature, the martensitic structure will be thus tempered, and local stresses will be altered. Bed heating systems allow the entire geometry to remain above the Ms, thus preventing uncontrollable recurrent transformations taking place in each layer. This will allow for the entire build to transform into martensite through a controlled cooling at the end of the build process.
In a preliminary study of additively manufactured Maraging steel 300 conducted by the authors, X-ray diffraction showed the onset of austenite reversion between 560 and 640 °C upon heating, with the Ms being below 120 °C (see ). Orientation microscopy results from the core of the material showed presence of coarse grains, resembling to tempered martensite rather than the expected ‘needle’ shape martensitic morphology.
Figure 81. X-ray diffractograms of Maraging steels 300 upon heating (a) and cooling (b).
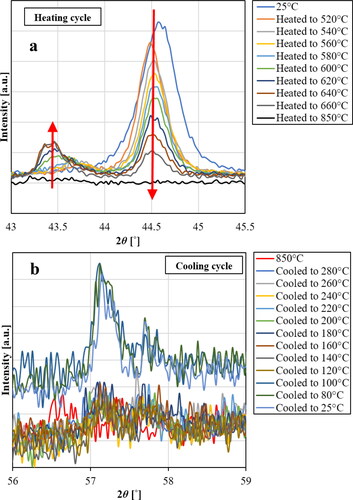
shows the EBSD inverse pole figure map and corresponding pole figures of the illustrated patches in the orientation map. The results reveal a Kurdjumov–Sachs (K-S) orientation relationship (Azar et al., Citation2012) between the primary austenite and the evolved martensite, suggesting that the transformation induced RS depend on the grain orientations of the primarily solidified phase. These findings agree with the assumption that the phase transformation depends on the anisotropy of the material microstructure, which differs between the surface and the core.
Figure 82. (a) Inverse pole figure of martensite patches that form within primary austenite grains and (b) corresponding pole figures showing K-S relationship.
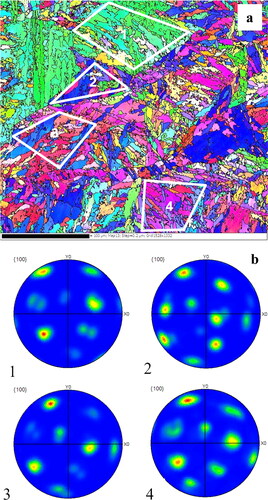
6. Concluding remarks
Additive manufacturing offers an unprecedented flexibility in processing of complex shapes and material configurations and provides opportunities for tailor-making components and materials for demanding technological applications. A combination of already existing metallurgical knowledge, experimental and modelling research tools will help identifying important technical challenges, predicting failures in processing, post-processing treatments and service conditions as well as optimizing processing practices. In the first part we describe the main AM methods with special emphasis on the directed energy deposition techniques. For a robotic setup to perform viable AM operation, it is important that the developed models are redefined in the form of codes that could feed the controllers. This will allow end-users to benefit from the automatic control, something that is necessary for simplifying a complex metal processing method such as AM. In Sections 1 and 2, WAAM, CMT, LMD, EBAM, Joule printing and a numerical heat source model were investigated with a fresh AM perspective. It was shown that the choice of gas, type of laser, accelerating voltage in EBAM, generic process parameters such as deposition speed, wire feed rate, as well as material type can be crucial factors in determining the generic AM process stability. From the provided information, it can be deduced that the first step towards a successful AM operation is the clear definition of objectives and goals. By doing so, the type of the DED process and the establishment of a perfect set of process parameters can be greatly simplified. More specifically, if the objective is to deposit a high amount of material, WAAM is the right choice as compared to LMD, while if the objective is to limit distortion, LMD becomes a natural choice. That is basically why different DED processes exist, since each of which can satisfy a specific objective, although in many cases processing windows overlap. In the latter case, economic criteria determine the type of the process. For instance, WAAM has classically been developed to be more economical that the other methods such as EBAM.
In the second part, through Sections 3–5, we focus mainly on the metallurgical aspects affecting production, structural integrity and environmental (corrosion) performance of bimetallic components.
Finding metals and alloys with equivalent properties but different performance is challenging, and processing of multi-metallic components is demanding. Comparable properties are important in handling the final multi-metallic component throughout the entire value-chain, from AM processing to post-production, heat treatment and finishing, while different performances are required for the multi-metallic component to have a unique function compared to the individual metals/alloys. This article shed light on available and well-developed numerical tools that can predict the performance of such components with acceptably high precision. The numerical approaches improve our anticipations in designing processing parameters, dilution, brittle phase formation, evolution of residual stresses, fracture, heat treatment cycles, diffusion, interfacial stability, and corrosion. This means that any combination of materials in a multi-metallic system can be evaluated numerically prior to the experimental attempts, to spot or even fine-tune the influential parameters. This is a recent opportunity that needs to be further developed using material science-informed operations. Thus, the future shall be devoted to further implementation of digital twins, to achieve a level of AM processing that machinery understand material physics and take timely actions to warrant the processing rout and reduce the time-to-market.
| Abbreviations | ||
| AM | = | additive manufacturing |
| CAD | = | computer aided design |
| CAM | = | computer aided manufacturing |
| CCT | = | continuous cooling transformation (diagrams) |
| CMOD | = | crack mouth opening displacement |
| CMT | = | cold metal transfer |
| CTOD | = | crack tip opening displacement |
| DED | = | directed energy deposition |
| EBAM | = | electron beam additive manufacturing |
| EPFM | = | elastic-plastic fracture mechanics |
| FEM | = | finite element method |
| FGA | = | functionally graded alloys |
| FGM | = | functionally graded materials |
| HAZ | = | heat affected zone |
| HT | = | heat treatment |
| LENS | = | laser engineered net shaping |
| LM | = | laser melting |
| LMD | = | laser metal deposition |
| PBF | = | powder bed fusion |
| PBF-EB | = | electron beam powder bed fusion |
| PBF-LB | = | laser beam powder bed fusion |
| LS | = | laser sintering |
| RPD | = | rapid plasma deposition |
| RS | = | residual stress |
| RT | = | room temperature |
| SENB | = | single edge notched bending |
| SENT | = | single edge notched tension |
| SLM | = | selective laser melting |
| SLS | = | selective laser sintering |
| SS | = | stainless steel |
| WAAM | = | wire-arc additive manufacturing |
Acknowledgement
This research did not receive any specific grant from funding agencies in the public, commercial, or not-for-profit sectors. The manuscript is an extension of several granted projects and developed outside the scopes as a side activity. This work was initially motivated by Prof. J. Norberto Pires (University of Coimbra) as a part of a larger endeavour for preparing a book on robotics and additive manufacturing. His premature decease saddened us deeply and put the project on halt. Nevertheless, we decided to reorganize the content in the form of an article that became the current manuscript. Our decision is to show our appreciation to his legacy and almost 6 years of restless collaboration. This article is dedicated to his memory.
We would also like to extend our gratitude to our colleagues Eirik Belland, Pål Idar Ingebo at Effee Induction AS and Joaquim Seland Graff, Martin Sunding, Even Wilberg Hovig and Patricia Almeida Carvalho at SINTEF for fruitful discussions.
Disclosure statement
The authors report there are no competing interests to declare.
Data availability statement
The data that support the findings of this study are available from the corresponding author, ASA, upon reasonable request.
Notes
1 Reverse polarity can be applied in certain cases.
2 Determined by online calculator, developed by the electron microscopy team at The University of Oklahoma (www.ou.edu).
References
- A. Handbook. (1991). Vol. 4: Heat Treating, ASM International, Materials Park.
- Adebayo, A., Mehnen, J., & Tonnellier, X. (2012). Limiting travel speed in additive layer manufacturing, Proceedings of the 9th International Conference on Trends in Welding Research, Chicago, Illinois, USA.
- Agudo, L., Jank, N., Wagner, J., Weber, S., Schmaranzer, C., Arenholz, E., Bruckner, J., Hackl, H., & Pyzalla, A. (2008). Investigation of microstructure and mechanical properties of steel‐aluminium joints produced by metal arc joining. Steel Research International, 79(7) 530–535.
- Alkahari, M. R., Furumoto, T., Ueda, T., Hosokawa, A., Tanaka, R., Aziz, A., & Sanusi, M. (2012). Thermal conductivity of metal powder and consolidated material fabricated via selective laser melting. Key Engineering Materials, 523-524, 244–249.
- Andrews, D. (1963). Joining aluminium to mild steel by argomare welding. Aluminium Development Association.
- Arata, Y., Matsuda, F., & Katayama, S. (1977). Solidification crack susceptibility in weld metals of fully austenitic stainless steels (Report II): Effect of ferrite, P, S, C, Si and Mn on ductility properties of solidification brittleness. Transactions of JWRI, 6(1), 105–116.
- Arivazhagan, N., Singh, S., Prakash, S., & Reddy, G. (2011). Investigation on AISI 304 austenitic stainless steel to AISI 4140 low alloy steel dissimilar joints by gas tungsten arc, electron beam and friction welding. Material & Design, 32(5), 3036–3050.
- Arora, A., Roy, G., & DebRoy, T. (2009). Unusual wavy weld pool boundary from dimensional analysis. Scripta Materialia, 60(2), 68–71.
- ASTM-International, F2792–12. (2012). Standard terminology for additive manufacturing technologies, Designation: F2792–12a.
- Atabaki, M. M., Nikodinovski, M., Chenier, P., Ma, J., Harooni, M., & Kovacevic, R. (2014). Welding of aluminum alloys to steels: an overview. Journal for Manufacturing Science and Production, 14(2), 59–78.
- Ayoola, W., Suder, W., & Williams, S. (2017). Parameters controlling weld bead profile in conduction laser welding. Journal of Materials Processing Technology, 249, 522–530.
- Azar, A. S. (2015). A heat source model for cold metal transfer (CMT) welding. Journal of Thermal Analysis and Calorimetry 122(2), 741–746.
- Azar, A. S. (2018). Chapter 6: Método numérico para seleção dos parâmetros do processo. In: J. N. Pires (Ed.), Lisbon: Robótica Industrial, LIDEL.
- Azar, A. S., As, S. K., & Akselsen, O. M. (2012). Determination of welding heat source parameters from actual bead shape. Computational Materials Science, 54, 176–182.
- Azar, A. S., Ås, S. K., & Akselsen, O. M. (2012). Determination of welding heat source parameters from actual bead shape. Computational Materials Science, 54, 176–182.
- Azar, A. S., Lekatou, A., Sunding, M. F., Graff, J. S., Tzima, N., and Diplas, S. (2021). Corrosion performance and degradation mechanism of a bi-metallic aluminum structure processed by wire-arc additive manufacturing. NPJ Materials Degradation, 5(1) 1–15.
- Azar, A. S., Østby, E., & Akselsen, O. M. (2012). Effect of hyperbaric chamber gas on transformation texture of the API-X70 pipeline weld metal, Metallurgical and Materials Transactions A, 43(9) 3162–3178.
- Bai, J., Yang, C., Lin, S., Dong, B., & Fan, C. (2016). Mechanical properties of 2219-Al components produced by additive manufacturing with TIG. The International Journal of Advanced Manufacturing Technology, 86(1-4), 479–485.
- Balakrishnan, M., Balasubramanian, V., Reddy, G. M., & Sivakumar, K. (2011). Effect of buttering and hardfacing on ballistic performance of shielded metal arc welded armour steel joints, Materials & Design, 32(2), 469–479.
- Banovic, S., DuPont, J., & Marder, A. (2002). Dilution and microsegregation in dissimilar metal welds between super austenitic stainless steel and nickel base alloys. Science and Technology of Welding and Joining, 7(6), 374–383.
- Beaugrand, V., Smith, L. S., & Gittos, M.F. (2009). Subsea dissimilar joints: Failure mechanisms and opportunities for mitigation, corrosion. NACE International, 2009.
- Bicknell, A., Smith, J., & Lucas, J. (1994). Infrared sensor for top face monitoring of weld pools, Measurement Science and Technology, 5(4), 371–378.
- Block-Bolten, A., & Eagar, T. (1984). Metal vaporization from weld pools. Metallurgical Transactions B, 15(3), 461–469.
- Brandl, E., Michailov, V., Viehweger, B., & Leyens, C. (2011). Deposition of Ti–6Al–4V using laser and wire, part II: Hardness and dimensions of single beads. Surface and Coatings Technology, 206(6), 1130–1141.
- Brandl, E., Schoberth, A., & Leyens, C. (2012). Morphology, microstructure, and hardness of titanium (Ti-6Al-4V) blocks deposited by wire-feed additive layer manufacturing (ALM). Materials Science Engineering, A532, 295–307.
- Buchheit, R. (1995). A compilation of corrosion potentials reported for intermetallic phases in aluminum alloys. Journal of the Electrochemical Society, 142(11), 3994–3996.
- C. G. Pickin, S. W. Williams, M. Lunt, Characterisation of the cold metal transfer (CMT) process and its application for low dilution cladding, Journal of Materials Processing Technology, 211(3) (2011) 496–502.
- Chen, C., & Kovacevic, R. (2004). Joining of Al 6061 alloy to AISI 1018 steel by combined effects of fusion and solid state welding. International Journal of Machine Tools and Manufacture, 44(11), 1205–1214.
- Chong, P., Liu, Z., Skeldon, G. Thompson. (2003). Large area laser surface treatment of aluminium alloys for pitting corrosion protection. Applied Surface Science, 208-209, 399–404.
- Christensen, N. (1965). Distribution of temperatures in arc welding, British Welding Journal, 12(2).
- Clark, H., & Wayman, C. (1970). Phase transformations, ASM, Metals Park, OH 59.
- Coleman, K., & Hainsworth, J. (2009). Improved filler metal enables higher-temperature dissimilar metal welds. Power, 153(7).
- Cong, B., Ding, J., & Williams, S. (2015). Effect of arc mode in cold metal transfer process on porosity of additively manufactured Al-6.3% Cu alloy. The International Journal of Advanced Manufacturing Technology, 76(9-12), 1593–1606.
- da Costa, C. E., Zapata, W. C., & Parucker, M. L. (2003). Characterization of casting iron powder from recycled swarf. Journal of Materials Processing Technology, 143–144, 138–143.
- Davis, J. R. (2000). Corrosion: Understanding the basics. ASM International.
- Devesse, W., De Baere, D., & Guillaume, P. (2015) Modeling of laser beam and powder flow interaction in laser cladding using ray-tracing. Journal of Laser Applications, 27(S2), S29208.
- Dickey, F. M. (2014). Laser beam shaping: theory and techniques. CRC Press.
- Dillenbeck, V. R. & Castagno L. (1987). Effects of various shielding gases and associated mixtures in GMA welding of mild steel. Welding Journal (Miami, Fla), 66(9), 45–49.
- Ding, D., Pan, Z. S., Cuiuri, D., & Li, H. (2014). A tool-path generation strategy for wire and arc additive manufacturing. The International Journal of Advanced Manufacturing Technology, 73(1-4), 173–183.
- Ding, D., Pan, Z., Cuiuri, D., & Li, H. (2015). A multi-bead overlapping model for robotic wire and arc additive manufacturing (WAAM), Robotics Computer-Integrated Manufacturing, 31, 101–110.
- Ding, D., Pan, Z., Cuiuri, D., & Li, H. (2015). Wire-feed additive manufacturing of metal components: technologies, developments and future interests. The International Journal of Advanced Manufacturing Technology, 81(1–4) 465–481.
- Ding, D., Pan, Z., Cuiuri, D., & Li, H. (2015). Wire-feed additive manufacturing of metal components: technologies, developments and future interests. The International Journal of Advanced Manufacturing Technology, 81(1–4) 465–481.
- Ding, D., Shen, C., Pan, Z., Cuiuri, D., Li, H., Larkin, N., & van Duin, S. (2016) Towards an automated robotic arc-welding-based additive manufacturing system from CAD to finished part. Computer-Aided Design, 73, 66–75.
- Ding, J., Colegrove, P., Mehnen, J., Ganguly, S., Almeida, P. S., Wang, F., & Williams, S. (2011). Thermo-mechanical analysis of wire and arc additive layer manufacturing process on large multi-layer parts. Computational Materials Science, 50(12), 3315-–3322.
- Dinwiddie, R. B., Dehoff, R. R., Lloyd, P. D., Lowe, L. E., & Ulrich, J. B. (2013). Thermographic in-situ process monitoring of the electron-beam melting technology used in additive manufacturing, Proc. SPIE K 87050, 87050K–87059K.
- Du, Z.-Z., & Hancock, J. (1991). The effect of non-singular stresses on crack-tip constraint. Journal of the Mechanics and Physics of Solids, 39(4), 555–567.
- DuPont, J., & Marder, A. (1996). Dilution in single pass arc welds. Metallurgical and Materials Transactions B, 27(3), 481–489.
- Dupont, J., Banovic, S., & Marder, A. (2003). Microstructural evolution and weldability of dissimilar welds between a super austenitic stainless steel and nickel-based alloys. Welding Journal, 82(6) 125.
- Dutra, J. C., Gonçalves e Silva, R. H., & Marques, C. (2015). Melting and welding power characteristics of MIG–CMT versus conventional MIG for aluminium 5183. Welding International, 29(3), 181–186.
- Dwivedi, R., Zekovic, S., & Kovacevic, R. (2006). Field feature detection and morphing-based process planning for fabrication of geometries and composition control for functionally graded materials. Proceedings of the Institution of Mechanical Engineers, Part B: Journal of Engineering Manufacture, 220(10), 1647–1661.
- El-Banna, E. (1999). Effect of preheat on welding of ductile cast iron. Materials Letters, 41(1), 20–26.
- Escano, L. I., Parab, N. D., Xiong, L., Guo, Q., Zhao, C., Fezzaa, K., Everhart, W., Sun, T., Chen, L. (2018). Revealing particle-scale powder spreading dynamics in powder-bed-based additive manufacturing process by high-speed x-ray imaging, Scientific Reports, 8(1), 15079.
- Everton, S. K., Hirsch, M., Stravroulakis, P., Leach, R. K., & Clare, A. T. (2016). Review of in-situ process monitoring and in-situ metrology for metal additive manufacturing, Materials & Design, 95 431–445.
- Fawcett, R. (1978). The recycling of cast iron borings and steel swarf. Conservation & Recycling, 2(3-4), 205–210.
- Fernandes, F., Lopes, B., Cavaleiro, A., Ramalho, A., & Loureiro, A. (2011). Effect of arc current on microstructure and wear characteristics of a Ni-based coating deposited by PTA on gray cast iron, Surface and Coatings Technology, 205(16), 4094–4106.
- Flemings, M. C. (1974). Solidification processing. Metallurgical and Materials Transactions B, 5(10), 2121–2134.
- Foroozmehr, A., Badrossamay, M., Foroozmehr, E., & Golabi, S. (2016). Finite element simulation of selective laser melting process considering optical penetration depth of laser in powder bed, Materials & Design, 89, 255–263.
- Fouquet, F., & Szmatula, E. (1988). Laser surface melting of a pearlitic grey cast iron. Materials Science and Engineering, 98, 305–308.
- Frazier, W. E. (2014). Metal additive manufacturing: A review. Journal of Materials Engineering and Performance, 23(6) 1917–1928.
- Fuerschbach, P. W. (1994). A dimensionless parameter model for arc welding processes. Sandia National Labs., Albuquerque, NM (United States).
- Gardner, M. (1988). Chapter 7 in: Martin Gardner’s New Mathematical Diversions from Scientific American, Simon & Schuster.
- Gauß, C. F. (1831). Besprechung des Buchs von LA Seeber: Intersuchungen über die Eigenschaften der positiven ternären quadratischen Formen usw, Göttingsche Gelehrte Anzeigen, 2 188–196.
- Goldak, J. A., & Akhlaghi, M. (2006). Computational welding mechanics. Springer Science & Business Media.
- Goldak, J. A., Chakravarti, A., & Bibby, M. (1984). A new finite element model for welding heat sources. Metallurgical Transactions B, 15(2), 299–305.
- Goldak, J., Bibby, M., Downey, D., & Gu, M. (1990). Heat and fluid flow in welds. In Advanced joining technologies (pp. 69–82). Springer.
- Goldak, J., Chakravarti, A., & Bibby, M. (1984). A new finite element model for welding heat sources, Metallurgical Transactions B, 15(2), 299–305.
- Gong, H., Gu, H., Zeng, K., Dilip, J., Pal, D., Stucker, B., Christiansen, D., Beuth, J., & Lewandowski, J. J. (2014). Melt pool characterization for selective laser melting of Ti-6Al-4V pre-alloyed powder. Solid freeform fabrication symposium, pp. 256–267.
- Gražulis, S., Chateigner, D., Downs, R. T., Yokochi, A., Quirós, M., Lutterotti, L., Manakova, E., Butkus, J., Moeck, P., & Le Bail, A. (2009). Crystallography open database - An open-access collection of crystal structures. Journal of Applied Crystallography, 42(Pt 4), 726–729.
- Gu, J., Cong, B., Ding, J., Williams, S. W., & Zhai, Y. (2014). Wire + arc additive manufacturing of aluminium, Proceedings of the 25th Annual International Solid Freeform Fabrication Symposium, Austin, TX, USA, pp. 4–6.
- Gusarov, A., Yadroitsev, I., Bertrand, P., & Smurov, I. (2009). Model of radiation and heat transfer in laser-powder interaction zone at selective laser melting, Journal of Heat Transfer, 131(7) 72101.
- Gustafsson, S. E. (1991). Transient plane source techniques for thermal conductivity and thermal diffusivity measurements of solid materials. Review of Scientific Instruments, 62(3), 797–804.
- Hales, T., & Hales, T. C. (2012). Dense sphere packings: a blueprint for formal proofs. Cambridge University Press.
- Haug, A. A., & Langtangen, H. P. (1997). The basic equations in Eulerian continuum mechanics. In: M. Daehlen, A. Tveito (Eds.), Methods and software tools in industrial mathematics, Birkhäuser.
- Hecht, J. (1992). Laser pioneers. Academic Press.
- Hibino, A. (2010). Estimation of kinetic parameters for combustion synthesis of FeAl intermetallic compound by dipping experiment of Fe wire into Al melt. Materials Transactions, 51(3), 516–524.
- Hilton, D. E., & Norrish, J. (1988). Shielding gases for arc welding. Welding Metallurgy and Fabrication, 56, 189–196.
- Hinojos, A., Mireles, J., Reichardt, A., Frigola, P. Hosemann, Murr, L. E., & Wicker, R. B. Joining of Inconel 718 and 316 Stainless Steel using electron beam melting additive manufacturing technology. Materials & Design, 94 (2016) 17–27.
- Holt, R. T., & Wallace, W. (1976). Impurities and trace elements in nickel-base superalloys, International Metals Reviews, 21(1), 1–24.
- Homma, H., Ohkita, S., Matsuda, S., & Yamamoto, K. (1987). Improvement of HAZ Toughness in HSLA Steel by Introducing Finely Dispersed Ti-Oxide, Welding Journal (Miami, FL), 66(10), 301–309.
- Höno, K., Satoh, T., & Hirano, K.-I. (1986). Evidence of multi-layer GP zones in Al-1· 7at.%, Cu alloy, Philosophical Magazine A, 53(4), 495–504.
- Hosford, W. F., & Caddell, R. M. (2011). Metal forming: Mechanics and metallurgy. Cambridge University Press.
- Hu, X., and Zhou, Q. (2013). Health and ecosystem risks of graphene. Chemical Reviews, 113(5), 3815–3835.
- Hume-Rothery, W., & Coles, B. R. (1969). Atomic theory for students of metallurgy.
- Hume-Rothery, W., Smallman, R. E., & Haworth, C. W. (1969). The structure of metals AMD alloys.
- Ilango, S., & Ramakrishnan, P. (1990). High temperature sintering of recycled cast iron powder. Journal of Materials Science Letters, 9(2), 246–248.
- Iota, V., & Yoo, C.-S. (2001). Phase diagram of carbon dioxide: Evidence for a new associated phase. Physical review Letters, 86(26 Pt 1), 5922–5925.
- Ivasishin, O. M., Anokhin, V., Demidik, A., & Savvakin, D. G. (2000). Cost-effective blended elemental powder metallurgy of titanium alloys for transportation application. Key Engineering Materials, 188, 55–62.
- Jacob, G. (2018). Prediction of solidification phases in Cr-Ni stainless steel alloys manufactured by laser based powder bed fusion process.
- Jaeger, H. M., Nagel, S. R., & Behringer, R. P. (1996). The physics of granular materials, Physics Today, 49(4), 32–38.
- Jamshidinia, M., Kong, F., & Kovacevic, R. (2013). Numerical modeling of heat distribution in the electron beam melting® of Ti-6Al-4V. Journal of Manufacturing Science and Engineering, 135(6), 61010.
- Jamshidinia, M., Sadek, A., Wang, W., & Kelly, S. (2015). Additive manufacturing of steel alloys using laser powder-bed fusion. Advanced Materials & Processes, 173(1), 20–24.
- Jang, C., Lee, J., Kim, J. S., Jin, T. E. (2008). Mechanical property variation within Inconel 82/182 dissimilar metal weld between low alloy steel and 316 stainless steel. International Journal of Pressure Vessels and Piping, 85(9), 635–646.
- Jäniche, W., Dahl, W., Klärner, H.-F., Pitsch, W., Schauwinhold, D., Schlüter, W., Schmitz, H., & Eisenhüttenleute, V. D. (2013). Werkstoffkunde Stahl: Band 1: Grundlagen. Springer-Verlag.
- Jeffus, L. F. (2002). Welding: principles and applications. Thomson/Delmar Learning.
- Jones, H. (1982). Rapid solidification of metals and alloys, The Institution of Metallurgists, ix+ 83, A 5, illustrated .
- Jones, W., & Alberry, P. (1977). Residual stresses in welded constructions. The Welding Institute.
- Kah, P., Suoranta, R., & Martikainen, J. (2013). Advanced gas metal arc welding processes. The International Journal of Advanced Manufacturing Technology, 67(1-4), 655–674.
- Kahnert, M., Lutzmann, S., & Zaeh, M. (2007). Layer formations in electron beam sintering. Solid freeform fabrication symposium, pp. 88–99.
- Kalpakjian, S. (2001). Manufacturing engineering and technology. Pearson Education India.
- Karabay, S. (2008). Design, influence of AlB2 compound on elimination of incoherent precipitation in artificial aging of wires drawn from redraw rod extruded from billets cast of alloy AA-6101 by vertical direct chill casting, Materials Design, 29(7), 1364–1375.
- Karadeniz, E., Ozsarac, U., & Yildiz, C. (2007). The effect of process parameters on penetration in gas metal arc welding processes. Materials Design, 28(2), 649–656.
- Karandikar, D. (1991). Processing of cast iron scrap from the diesel engine manufacturing industry by powder metallurgy techniques. Resources, Conservation and Recycling, 5(1), 61–71.
- Kaufman, L., & Cohen, M. (1956). The martensitic transformation in the iron-nickel system, JOM 8(10) 1393–1401.
- Kim, H., Cong, W., Zhang, H.-C., & Liu, Z. (2017). Laser engineered net shaping of nickel-based superalloy Inconel 718 powders onto AISI 4140 alloy steel substrates: interface bond and fracture failure mechanism. Materials, 10(4), 341.
- Kim, Y., Park, K. Y., Kim, Y. S., and Kim, S. J. ( 2012). Dissimilar metal joining of steel to aluminum using the arc heat source. Materials Science Forum, 706-709, 2974–2979.
- King, W. E., Anderson, A. T., Ferencz, R., Hodge, N., Kamath, C., Khairallah, S. A., & Rubenchik, A. M. (2015). Laser powder bed fusion additive manufacturing of metals; physics, computational, and materials challenges, Applied Physics Reviews, 2(4), 41304.
- Kiuchi, K., & McLellan, R. (1983). The solubility and diffusivity of hydrogen in well-annealed and deformed iron. Acta Metallurgica, 31(7), 961–984.
- Kluken, A., & Grong, Ø. (1989). Mechanisms of inclusion formation in Al-Ti-Si-Mn deoxidized steel weld metals. Metallurgical Transactions A, 20(8), 1335–1349.
- Knorovsky, G., Cieslak, M., Headley, T., Romig, A., & Hammetter, W. (1989). Inconel 718: a solidification diagram. Metallurgical Transactions A, 20(10), 2149–2158.
- Ko, D.-C., & Kim, B.-M. (2000). The prediction of central burst defects in extrusion and wire drawing, Journal of Materials Processing Technology, 102(1-3), 19–24.
- Körner, C. (2016). Additive manufacturing of metallic components by selective electron beam melting—A review. International Materials Reviews, 61(5), 361–377.
- Kotecki, D., & Siewert, T. (1992). WRC-1992 constitution diagram for stainless steel weld metals: a modification of the WRC-1988 diagram. Welding Journal, 71(5), 171–178.
- Ku, M.-H., Hung, F.-Y., Lui, T.-S., & Lai, J.-J. (2018). Enhanced formability and accelerated precipitation behavior of 7075 Al alloy extruded rod by high temperature aging. Metals, 8(8), 648.
- Kulkarni, P., Marsan, A., & Dutta, D. (2000). A review of process planning techniques in layered manufacturing, Rapid Prototyping Journal, 6(1) 18–35.
- Kurz, W. (2001). Solidification microstructure‐processing maps: Theory and application, Advanced Engineering Materials, 3(7), 443–452.
- Laha, K., Chandravathi, K., Rao, K. B. S., Mannan, S., & Sastry, D. (2001). An assessment of creep deformation and fracture behavior of 2.25 Cr-1Mo similar and dissimilar weld joints. Metallurgical and Materials Transactions A, 32(1), 115–124.
- LaQue, F. L. (1975). Marine corrosion: causes and prevention.
- Larson, N. E., & Meredith, W. F. (1990). Shielding gas selection manual. Union Carbide Industrial Gases Technology Corp.
- Laubitz, M. (1959). Thermal conductivity of powders. Canadian Journal of Physics, 37(7), 798–808.
- Leblond, J.-B. (1989). Mathematical modelling of transformation plasticity in steels II: coupling with strain hardening phenomena. International Journal of Plasticity, 5(6), 573–591.
- Lee, H.-T., Jeng, S.-L., Yen, C., & Kuo, T.-Y. (2004). Dissimilar welding of nickel-based alloy 690 to SUS 304L with Ti addition. Journal of Nuclear Materials, 335(1), 59–69.
- Li, W., Karnati, S., Kriewall, C., Liou, F., Newkirk, J., Taminger, K. M. B., & Seufzer, W. J. (2017). Fabrication and characterization of a functionally graded material from Ti-6Al-4V to SS316 by laser metal deposition. Additive Manufacturing, 14, 95–104.
- Lippold, J. C., Kiser, S. D., & DuPont, J. N. (2011). Welding metallurgy and weldability of nickel-base alloys. John Wiley & Sons.
- Liu, L., Zhuang, Z., Liu, F., & Zhu, M. (2013). Additive manufacturing of steel–bronze bimetal by shaped metal deposition: interface characteristics and tensile properties. The International Journal of Advanced Manufacturing Technology, 69(9-12), 2131–2137.
- Liu, S., Olson, D. L., & Siewert, T. A. (1993). ASM handbook. Vol. 6: Welding, brazing and soldering. ASM International.
- Logsdon, W., Kossowsky, R., & Wells, J. (1978). The influence of processing and heat treatment on the cryogenic fracture mechanics properties of inconel 718. In Advances in cryogenic engineering, pp. 197–209. Springer.
- Louthan, M., & Derrick, R. (1975). Hydrogen transport in austenitic stainless steel. Corrosion Science, 15(6-12), 565–577.
- Lu, S., Fujii, H., & Nogi, K. (2004). Marangoni convection and weld shape variations in Ar–O2 and Ar–CO2 shielded GTA welding. Materials Science Engineering: A, 380(1-2), 290–297.
- M. Handbook. (2008). Casting, vol. 15, ASM International, 472.
- Macherauch, E., Wohlfahrt, H., & Wolfstieg, U. (1973). Zur zweckmäßigen definition von eigenspannungen, HTM Journal of Heat Treatment and Materials, 28(3), 201–211.
- Mackay, A. (1962). A dense non-crystallographic packing of equal spheres. Acta Crystallographica, 15(9) 916–918.
- Madhavan, S., Kamaraj, M., & Vijayaraghavan, L. (2016). Microstructure and mechanical properties of cold metal transfer welded aluminium/dual phase steel. Science and Technology of Welding and Joining, 21(3) 194–200.
- Magalhães, V. A. N. (2012). Physical simulation by rectification of pipe welding with GMAW process. MG, Brazil: Federal University of Uberlândia, p. 150.
- Mahamood, R. M., Akinlabi, E. T., Shukla, M., & Pityana, S. (2012). Functionally graded material: an overview.
- Maheshwaraa, U., Bourell, D., & Conner, C. (2007). Seepersad, Design and freeform fabrication of deployable structures with lattice skins. Rapid Prototyping Journal, 13(4), 213–225.
- Makoana, N., Moller, H., Burger, H., Tlotleng, M., & Yadroitsev, I. (2016). Evaluation of single tracks of 17-4PH steel manufactured at different power densities and scanning speeds by selective laser melting. South African Journal of Industrial Engineering, 27(3), 210–218.
- Marsavina, L., Sadowski, T., & Knec, M. (2013). Crack propagation paths in four point bend Aluminium–PMMA specimens. Engineering Fracture Mechanics, 108, 139–151.
- Marshall, G. W., & Hudson, T. S. (2010). Dense binary sphere packings., Contributions to Algebra and Geometry, 51(2), 337–344.
- McCafferty, E. (2010). Introduction to corrosion science. Alexandria: Springer.
- Meola, C., Carlomagno, G. M., & Giorleo, L. (2004). The use of infrared thermography for materials characterization. Journal of Materials Processing Technology, 155-156, 1132–1137.
- Meola, C., Carlomagno, G. M., Squillace, A., & Giorleo, G. (2002). Non-destructive control of industrial materials by means of lock-in thermography, Measurement Science and Technology, 13(10), 1583–1590.
- Michaleris, P. (2014). Modeling metal deposition in heat transfer analyses of additive manufacturing processes. Finite Elements in Analysis Design, 86, 51–60.
- Milani, A. M., Paidar, M., Khodabandeh, A., & Nategh, S. (2016). Influence of filler wire and wire feed speed on metallurgical and mechanical properties of MIG welding–brazing of automotive galvanized steel/5754 aluminum alloy in a lap joint configuration. The International Journal of Advanced Manufacturing Technology, 82(9-12), 1495–1506.
- Mills, W. (1980). The effect of heat treatment on the room temperature and elevated temperature fracture toughness response of Alloy 718. ASME, Journal of Engineering Materials and Technology, 102, 118–126.
- Minami, F., Toyoda, M., Thaulow, C., & Hauge, M. (1995). Effect of strength mis-match on fracture mechanical behavior of HAZ-notched weld joint. Quarterly Journal of the Japan Welding Society, 13(4), 508–517.
- Miyamoto, Y., Kaysser, W., Rabin, B., Kawasaki, A., & Ford, R.G. (2013). Functionally graded materials: design, processing and applications. Springer Science & Business Media.
- Moylan, S., Whitenton, E., Lane, B., & Slotwinski, J. (2014). Infrared thermography for laser-based powder bed fusion additive manufacturing processes, AIP Conference Proceedings, AIP, pp. 1191–1196.
- Naffakh, H., Shamanian, M., & Ashrafizadeh, F. (2009). Dissimilar welding of AISI 310 austenitic stainless steel to nickel-based alloy Inconel 657. Journal of Materials Processing Technology, 209(7) 3628–3639.
- Nelson, T., Lippold, J., & Mills, M. (1998). Investigation of boundaries and structures in dissimilar metal welds. Science and Technology of Welding and Joining, 3(5), 249–255.
- Nelson, T., Lippold, J., & Mills, M. (1999). Nature and evolution of the fusion boundary in ferritic-austenitic dissimilar weld metals, Part 1-Nucleation and growth, Welding Journal-New York, 78, 329-s.
- Nelson, T., Lippold, J., & Mills, M. (2000). Nature and evolution of the fusion boundary in ferritic-austenitic dissimilar metal welds. Part 2-On-cooling transformations. Welding Journal, 79(10), 267s–277s.
- Neville, B., & Rabiei, A. (2008). Composite metal foams processed through powder metallurgy. Materials & Design, 29(2), 388–396.
- Nishiyama, N., Terashima, H., & Hart, P. H. M. (1985). Effect of Al in C-Mn steels on microstructure and toughness of submerged-arc weld metal (Report 1). Yosetsu Gakkai Ronbunshu/Quarterly Journal of the Japan Welding Society, 3(1), 132–539.
- Nyhus, B. R., Polanco, M. L., Orjasæther, O. (2003). SENT specimens an alternative to SENB specimens for fracture mechanics testing of pipelines. ASME 2003 22nd International Conference on Offshore Mechanics and Arctic Engineering, American Society of Mechanical Engineers, pp. 259–266.
- Oyama, K., Diplas, S., M’hamdi, M., Gunnæs, A. E., & Azar, A. S. (2019). Heat source management in wire-arc additive manufacturing process for Al-Mg and Al-Si alloys. Additive Manufacturing, 26, 180–192.
- Padmanabham, G., Priya, Y. K., Prabhakar, K. P., & Bathe, R. N. (2013). A comparision of interface characteristics and mechanical properties of aluminium-steel joints made by pulsed-MIG and cold metal transfer (CMT) processes, trends in welding research 2012: Proceedings of the 9th International Conference, ASM International, p. 227.
- Pang, Q., Pang, T., McClure, J. C., & Nunes, A. C. (1994). Workpiece cleaning during variable polarity plasma arc welding of aluminum. Journal of Engineering for Industry, 116, 463–466.
- Peet, M., Hasan, H., & Bhadeshia, H. (2011). Prediction of thermal conductivity of steel. International Journal of Heat and Mass Transfer, 54(11-12), 2602–2608.
- Pryor, M., & Astley, D. (1994). Bimetallic corrosion, corrosion (3rd Ed.). Elsevier pp. 1:213–1:243.
- Pugh, S., & Little, E. (1978). Ferritic steels for fast reactor steam generators. Nuclear Energy, 17(3), 179–183.
- Pulugurtha, S. R., Newkirk, J. W., Liou, F. W., & Chou, H.-N. (2009). Functionally graded materials by laser metal deposition.
- Ralph, B. (1925). Method of making decorative articles, Google Patents.
- Ramkumar, K. D., Arivazhagan, N., & Narayanan, S. (2012). Effect of filler materials on the performance of gas tungsten arc welded AISI 304 and Monel 400. Materials & Design, 40 70–79.
- Ramkumar, K. D., Patel, S. D., Praveen, S. S., Choudhury, D. J., Prabaharan, P., Arivazhagan, N., & Xavior, M. A. (2014). Influence of filler metals and welding techniques on the structure–property relationships of Inconel 718 and AISI 316L dissimilar weldments. Materials & Design (1980-2015), 62, 175–188.
- Ransley, C., & Neufeld, H. (1948). The solubility of hydrogen in liquid and solid aluminium. Journal of the Institute of Metals, 74(12), 599–620.
- Razaz, G., & Carlberg, T. (2019). Hot tearing susceptibility of AA3000 aluminum alloy containing Cu, Ti, and Zr. Metallurgical and Materials Transactions A, 50(8), 3842–3854.
- Reed, R. C. (2008). The superalloys: fundamentals and applications. Cambridge university Press.
- Reid, R. C., Prausnitz, J. M., & Poling, B. E. (1987). The properties of gases and liquids.
- Richardson, I. M., Nixon, J. H., Nosal, P., Hart, P., & Billingham, J. (2000). Hyperbaric GMA Welding to 2,500m Water Depth. Joint International Conference ETC/OMAE, New Orleans, USA.
- Romano, J., Ladani, L., & Sadowski, M. (2015). Thermal modeling of laser based additive manufacturing processes within common materials. Procedia Manufacturing, 1, 238–250.
- Rosenthal, D. (1946). The theory of moving sources of heat and its application on metal treatments. Trans. ASME, (68), 849–866.
- Rykalin, N. (1951).Calculation of heat flow in welding, translated by Zvi Paley and CM Adams, Jr., Contract Number UC-19-066-001-C3817.
- Rykalin, N. N. (1953). Berechung der Wärmevorgänge beim Schweissen. Berlin: VEB Verlag Teknik.
- Sadek, A. A., Abass, M., Zaghloul, B., Elrefaey, A., & Ushio, M. (2000). Investigation of Dissimilar joints between low carbon steel and monel 400 (materials, metallurgy & weldability). Transactions of JWRI, 29(1), 21–28.
- Sadoc, J., Dixmier, J., & Guinier, A. (1973). Theoretical calculation of dense random packings of equal and non-equal sized hard spheres applications to amorphous metallic alloys. Journal of Non-Crystalline Solids, 12(1), 46–60.
- Schmidova, E., Hlavaty, I., & Hanus, P. (2016). The weldability of the steel with high manganese/Zavarljivost celika s visokim udjelom mangana. Tehnicki Vjesnik-Technical Gazette, 23(3), 749–753.
- Schnick, M., Dreher, M., Zschetzsche, J., Füssel, U., & Spille-Kohoff, A. (2012). Visualization and optimization of shielding gas flows in arc welding. Welding in the World, 56(1-2), 54–61.
- Schwendner, K. I., Banerjee, R., Collins, P. C., Brice, C. A., & Fraser, H. L. (2001). Direct laser deposition of alloys from elemental powder blends. Scripta Materialia, 45(10), 1123–1129.
- Scott, G., & Kilgour, D. (1969). The density of random close packing of spheres. Journal of Physics D: Applied Physics, 2(6), 863–866.
- Seith, W., & Heumann, T. (1939). Diffusion in metallen. Springer.
- Shabalin, I. L. (2014). Ultra-high temperature materials I: Carbon (graphene/graphite) and refractory metals. Springer.
- Shackleton, D. N., & Lucas, W. (1974). Shielding gas mixtures for high quality mechanized GMA welding of Q&T steel. Welding Journal (Miami, FL), 53(12), 537s–547s.
- Shaibani, M. E., & Ghambari, M. (2011). Characterization and comparison of gray cast iron powder produced by target jet milling and high energy ball milling of machining scraps. Powder Technology, 212(1), 278–283.
- Shen, C., Pan, Z., Cuiuri, D., Roberts, J., & Li, H. (2016). Fabrication of Fe-FeAl functionally graded material using the wire-arc additive manufacturing process. Metallurgical and Materials Transactions B, 47(1), 763–772.
- Shi, Z., Lian, Y., Zhou, X., Gu, Z., Zhang, Y., Iijima, S., Zhou, L., Yue, K. T., & Zhang, S. (1999). Mass-production of single-wall carbon nanotubes by arc discharge method, Carbon 37(9). 1449–1453.
- Sigl, M., Lutzmann, S., & Zäh, M. (2006). Transient physical effects in electron beam sintering. Solid Freeform Fabrication Symposium Proceedings, pp. 397–405. Austin, TX.
- Sih, S. S., & Barlow, J. W. (1995). Emissivity of powder beds, Solid freeform fabrication symposium proceedings, Center for Materials Science and Engineering, Mechanical Engineering Department and Chemical Engineering Department, the University of Texas at Austin, pp. 7–9.
- Sing, S., Lam, L., Zhang, D., Liu, Z., and Chua, C. (2015). Interfacial characterization of SLM parts in multi-material processing: Intermetallic phase formation between AlSi10Mg and C18400 copper alloy. Materials Characterization, 107, 220–227.
- Sireesha, M., Albert, S. K., Shankar, V., & Sundaresan, S. (2000). A comparative evaluation of welding consumables for dissimilar welds between 316LN austenitic stainless steel and Alloy 800. Journal of Nuclear Materials, 279(1), 65–76.
- Sireesha, M., Shankar, V., Albert, S. K., & Sundaresan, S. (2000). Microstructural features of dissimilar welds between 316LN austenitic stainless steel and alloy 800. Materials Science and Engineering: A, 292(1), 74–82.
- Soller, S., Beyer, S., Dahlhaus, A., Konrad, A., Kretschmer, J., Rackemann, N., & Zeiss, W. (2015). Development of liquid rocket engine injectors using additive manufacturing.
- Somoskői, G., & Török, I. (2013). CMT pin–Define the shape of the welded pin through welding parameters. Production Processes and Systems, 6(1) 47–56.
- Stashenko, V., Troitskii, O., & Novikova, N. Electroplastic drawing of a cast-iron wire. Journal of Machinery Manufacture and Reliability, 38(2) (2009) 182–184.
- Stenbacka, N., & Persson, K.A. (1989). Shielding gases for gas metal arc welding, Welding Journal, 68(11), 41–47.
- Sun, Z., & Ion, J. (1995). Laser welding of dissimilar metal combinations. Journal of Materials Science, 30(17), 4205–4214.
- Svensson, L. E. (1994). Control of microstructures and properties in steel arc welds. CRC Press.
- Taha, M., Yousef, A., Gany, K., & Sabour, H. (2012). On selective laser melting of ultra high carbon steel: Effect of scan speed and post heat treatment. Materialwissenschaft und Werkstofftechnik, 43(11), 913–923.
- Takeno, N. (2005). Atlas of Eh-pH diagrams, Geological survey of Japan open file report, p. 102.
- Takeuchi, E., Matsunaga, M., Nakagawa, T., Dai, F.-S., & Ra, H.-Y. (1982). Friction and wear of sintered cast iron products. Wear, 75(2), 303–312.
- Talaş, Ş. (2010). The assessment of carbon equivalent formulas in predicting the properties of steel weld metals. Materials & Design (1980-2015) 31(5) 2649–2653.
- Talbot, D., & Anyalebechi, P. (1988). Solubility of hydrogen in liquid aluminium. Materials Science and Technology 4(1), 1–4.
- Thaulow, C., Hauge, M., Paauw, A., Toyoda, M., & Minami, F. (1994). Effect of notch tip location in CTOD testing of the heat affected zone of steel weldments. ECF10, Berlin, 2013.
- Thaulow, C., Hauge, M., Zhang, Z., Ranestad, Ø., & Fattorini, F. (1999a). On the interrelationship between fracture toughness and material mismatch for cracks located at the fusion line of weldments. Engineering Fracture Mechanics, 64(4), 367–382.
- Thaulow, C., Zhang, Z., Hauge, M., Burget, W., & Memhard, D. (1999b). Constraint effects on crack tip stress fields for cracks located at the fusion line of weldments, Computational Materials Science, 15(3), 275–284.
- Thompson, R., & Genculu, S. (1983). Microstructural evolution in the HAZ of Inconel 718 and correlation with the hot ductility test. Welding Journal, 62(12), 337s–345s.
- Thompson, S. M., Bian, L., Shamsaei, N., & Yadollahi, A. (2015). An overview of direct laser deposition for additive manufacturing; Part I: Transport phenomena, modeling and diagnostics. Additive Manufacturing 8, 36–62.
- Tobler, R. (1976). Low temperature effects on the fracture behaviour of a nickel base superalloy. Cryogenics, 16(11), 669–674.
- Torquato, S., & Stillinger, F. H. (2006). New conjectural lower bounds on the optimal density of sphere packings. Experimental Mathematics, 15(3), 307–331.
- Tseng, W., & Aoh, J. (2013). Simulation study on laser cladding on preplaced powder layer with a tailored laser heat source. Optics & Laser Technology, 48, 141–152.
- Uhlig, H. H., Revie, R. W., & Sons, I. (1985). 441, Corrosion and corrosion control: An introduction to corrosion science and engineering. (Book).
- Unocic, R., & DuPont, J. (2004). Process efficiency measurements in the laser engineered net shaping process. Metallurgical and Materials Transactions B, 35(1), 143–152.
- Uziel, A. (2016). Looking at large-scale, arc-based additive manufacturing. Welding Journal, 4.
- Vallabhajosyula, P. C. D., & Bourell, D. L. (2011). Selective laser sintering and post-processing of fully ferrous components. University of Texas.
- Vallabhajosyula, P., & Bourell, D. L. (2009). Indirect selective laser sintered fully ferrous components–infiltration modeling, manufacturing and evaluation of mechanical properties. Solid freeform fabrication symposium, Austin, TX.
- Vasantharaja, P., Vasudevan, M., & Palanichamy, P. (2015). Effect of welding processes on the residual stress and distortion in type 316LN stainless steel weld joints. Journal of Manufacturing Processes, 19, 187–193.
- Viala, J., Peronnet, M., Barbeau, F., Bosselet, F., & Bouix, J. (2002). Interface chemistry in aluminium alloy castings reinforced with iron base inserts, Composites Part A: Applied Science Manufacturing 33(10), 1417–1420.
- Wang, W. (2015). The great minds of carbon equivalent, Part I, EWI.org.
- Wegst, C. (2001). Stahlschlussel (Key to Steels), Verlag Stahlschlussel Wegst GMBH, D-7142 Marbach.
- Wei, P., Yeh, J., Ting, C., DebRoy, T., Chung, F., & Lin, C. (2009). The effects of Prandtl number on wavy weld boundary. International Journal of Heat Mass Transfer, 52(15-16), 3790–3798.
- Williams, S. W., Martina, F., Addison, A. C., Ding, J., Pardal, G., & Colegrove, P. (2016). Wire + arc additive manufacturing, Materials Science Technology, 32(7), 641–647.
- Windmann, M., Röttger, A., Kügler, H., Theisen, W., & Vollertsen, F. (2015). Laser beam welding of aluminum to Al-base coated high-strength steel 22MnB5. Journal of Materials Processing Technology, 217, 88–95.
- Withers, P. J., & Bhadeshia, H. (2001). Residual stress. Part 2–Nature and origins. Materials Science and Technology-London 17(4), 366–375.
- Wittwer, L., & Enzinger, N. (2011). Simulating the welding process of pin structures, SYSWELD Forum 2011.
- Wittwer, L., Jank, N., Bećirović, A., Waldhör, A., & Enzinger, N. (2012). Influences on arc stability in welding of aluminum pin-structures, ICAA13 Pittsburgh, Springer, pp. 795–800.
- Wu, A. S., Brown, D. W., Kumar, M., Gallegos, G. F., & King, W. E. (2014). An experimental investigation into additive manufacturing-induced residual stresses in 316L stainless steel. Metallurgical and Materials Transactions A, 45(13), 6260–6270.
- Xiong, J., Zhang, G., Gao, H., & Wu, L. (2013). Modeling of bead section profile and overlapping beads with experimental validation for robotic GMAW-based rapid manufacturing, Robotics and Computer-Integrated Manufacturing 29(2), 417–423.
- Xu, J., Zhang, Z., Østby, E., Nyhus, B., & Sun, D. (2009). Effects of crack depth and specimen size on ductile crack growth of SENT and SENB specimens for fracture mechanics evaluation of pipeline steels. International Journal of Pressure Vessels Piping 86(12), 787–797.
- Yagi, S., & Kunii, D. (1957). Studies on effective thermal conductivities in packed beds. AIChE Journal, 3(3), 373–381.
- Yan, L., Chen, X., Li, W., Newkirk, J., & Liou, F. (2016). Direct laser deposition of Ti-6Al-4V from elemental powder blends. Rapid Prototyping Journal, 22(5), 810–816.
- Yellup, J. (1995). Laser cladding using the powder blowing technique. Surface and Coatings Technology, 71(2), 121–128.
- Yoo, S. C., Choi, K. J., Bahn, C. B., Kim, S. H., Kim, J. Y., & Kim, J. H. (2015). Effects of thermal aging on the microstructure of Type-II boundaries in dissimilar metal weld joints. Journal of Nuclear Materials, 459, 5–12.
- You, Y.-Y., Shiue, R.-K., Shiue, R.-H., & Chen, C. (2001). The study of carbon migration in dissimilar welding of the modified 9Cr-1Mo steel. Journal of Materials Science Letters, 20(15), 1429–1432.
- Young, G., Capobianco, T., Penik, M., Morris, B., McGee, J. (2008). The mechanism of ductility dip cracking in nickel-chromium alloys. Welding Journal-New York, 87(2), 31.
- Yu, J., Rombouts, M., & Maes, G. (2013). Cracking behavior and mechanical properties of austenitic stainless steel parts produced by laser metal deposition. Materials & Design 45, 228–235.
- Yurioka, N. & Suzuki, H. (1983). Determination of necessary preheating temperature in steel welding.
- Zeng, K., Pal, D., & Stucker, B. (2012). A review of thermal analysis methods in laser sintering and selective laser melting. Proceedings of Solid Freeform Fabrication Symposium, Austin, TX.
- Zhe, M., Dezellus, O., Gardiola, B., Braccini, M., & Viala, J. (2011). Chemical changes at the interface between low carbon steel and an Al-Si alloy during solution heat treatment. Journal of Phase Equilibria and Diffusion, 32(6), 486–497.
- Zhong, C., Pirch, N., Gasser, A., Poprawe, R., & Schleifenbaum, J. H. (2017). The influence of the powder stream on high-deposition-rate laser metal deposition with inconel 718, Metals, 7(10) 443.
- Zhu, Y., Murali, S., Cai, W., Li, X., Suk, J. W., Potts, J. R., & Ruoff, R. S. (2010). Graphene and graphene oxide: Synthesis, properties, and applications. Advanced materials (Deerfield Beach, FL.) 22(35), 3906–3924.