
 ?Mathematical formulae have been encoded as MathML and are displayed in this HTML version using MathJax in order to improve their display. Uncheck the box to turn MathJax off. This feature requires Javascript. Click on a formula to zoom.
Abstract
As in many other countries, the population of Sweden is getting older. This means that the number of older people in society will increase in absolute numbers and relative terms. Consequently, the need for elderly housing will increase, and the cost of these investments will be high. The following study aims to perform a quantitative analysis of the spatial distribution of the number and size of housing units for the elderly in Sweden in 2013–2018. The number of elderly housing units per capita is not evenly distributed, and a large part of the explanation is, of course, that the number of older people is not evenly distributed between municipalities. Nevertheless, we can also state that the municipality’s income level and tax base, as well as the geographical size and degree of urbanization, play a role. If the municipality has a surplus or deficit in the supply of special housing for the elderly, it does not correlate with the distribution of COVID-19 cases.
Keywords:
Introduction
For several decades, the trend has been that the population is getting older in many countries, especially in Sweden. The proportion over the age of 80 will be higher. The number of people over 80 will double within the next 30 years, according to data from Statistic Sweden. Although the elderly are healthier and more alert than before, greater efforts will have to be made to care for the elderly in the future. Like the World Health Organization (WHO) goal, the goal in Sweden is also an age-friendly societyFootnote1. More knowledge about the demand and dimensioning of elderly housingFootnote2 in the broadest sense is important, but perhaps above all for the demand for special housing for the elderly in need of long-term care (LTC) where decisions about housing involve a so-called aid decision (biståndsbeslut)Footnote3.
At the same time, as the proportion of older people in society is increasing, the costs of elderly care have also increased, which have forced many countries to analyze the fiscal burden and what this will entail in the future, see, e.g. Coleman (Citation1995). Different models have been tested, and the balance between care in special housing for the elderly and at home has also been analyzed. Sweden is no exception, and as early as the early 1990s, the system of who is responsible for elderly care was reformed. To increase efficiency and quality, responsibility was shifted to local actors, fewer institutions were built, and care was individually adapted to a greater extent. In the so-called “Ädelreform,” the municipalities were responsible for the care while the responsibility for the care was retained at a regional level (Karlsson et al., Citation2010). The shift in responsibility took effect in January of 1992 when SEK 20.3 million was transferred to the different counties through the ÄdelreformenFootnote4 to cover the cost for special housing for the elderly and the LTC of the elderly (Suzuki, Citation2001). Currently, the municipalities’ average costs for elderly care are just under 20% of the total municipality budget. The Swedish Association of Local Authorities and Regions (SKL), among others, believes this number should increase to just under 30% to meet the current need.
After the Ädelreform, the legislation takes place at the national level, and the municipalities are responsible for elderly care (nursing), while the regions are responsible for elderly health care. As Riedel et al. (Citation2016) pointed out, leadership has shifted from the central government to local actors, with the municipality plays an important role in the planning and structure of elderly care. The uneven distribution of special housing for the elderly between municipalities can, to a certain point, be explained by the age distribution in that municipality, but this is not the only reason. Thus, it is interesting to see what other factors can explain these differences occur spatially. Moreover, this shift in responsibility has led to differences in the supply of special housing for the elderly between Sweden’s municipalities. According to Houben (Citation2001), a shift in responsibility combined with a shortage of special housing for the elderly leads to problems. For one thing, underinvestment in elderly care has become evident with the spread of COVID-19, which has been significantly greater among those living in special housing for the elderly than for others, as many elderly people are vulnerable due to the need for LTC.
Planning special housing for elderly capacity and developing indicators for the planning process is an important feature of elderly care research. Planning based solely on the proportion of the population over a certain age is insufficient (Gibson, Citation2020). Therefore, our objective is to analyze the spatial distribution of special housing for the elderly in Sweden over 2013–2018. Thus, the purpose is to analyze regional differences and analyze whether municipalities that have made relatively large historical investments in special housing for the elderly also had a larger proportion of elderly residents infected with COVID-19.
We aim to add new knowledge that will improve the ability to structure and plan for LTC and providing a practical understanding of previously neglected topics. Surprisingly, there is relatively little research on the supply of special housing for the elderly. An exception is Riedel et al. (Citation2016), which discusses differences in LTC systems in 21 EU countries, focusing on the basic structure, service access, and supply characteristics. As they conclude, additional research is necessary for several areas. Our main contribution is an analysis of the spatial distribution of the supply of special housing for the elderly. Unlike studies on the ordinary housing market, we explain regional differences in special housing for the elderly per capita. Our database is a panel of all municipalities in Sweden over six years, enabling us to identify causal links between the housing stock and explanatory factors. The analysis has also made it possible for us to apply the results to examine the distribution of COVID-19 infections.
The outline of the article is as follows: in the next section, the theoretical framework of LTC section, the theoretical framework is briefly presented; in the Methodology section, the choice of method is presented; The empirical analysis section presents the empirical analysis with a focus on data and econometric analyses and an analysis of the results concerning the distribution of COVID-19 cases across municipalities; lastly, we offer a conclusion and discussion of policy implications.
The theoretical framework of LTC
The supply of special housing for the elderly in a municipality is partly dependent on market forces and, to an even greater extent, local and regional planning (Riedel et al., Citation2016). That is, the conventional starting point is to analyze the extent of available housing from a supply and demand perspective. However, since care for the elderly and the supply of special housing for the elderly are heavily regulated, national, regional, and local authorities also play an essential role. Hence, to see the problem as a simple estimation of the equilibrium quantity based on the demand function and the supply function is not enough. Thus, the amount of available housing is determined not only by preferences, relative prices, income, and costs for land, and construction. Since pricing in many cases is not set on the market, other underlying factors must be considered when estimating the relationship between available housing and the determining factors.
In Sweden, elderly care is divided between authorities at the central level and their counterparts at the regional and local levels. Elderly LTC can be divided into institutional care and home-based care, as well as public care providers and private care providers. Our analysis will focus on institutional care, but we make no distinction between private or public care. Much like the Netherlands, legal and regulatory decisions relating to institutional care in Sweden are generally made at the central level. Home-based care is also centrally controlled.
On the other hand, the planning of capacity is decentralized and is carried out in conjunction with institutional care and home care decisions (see Riedel et al., Citation2016). Access to LTC is not based on income, i.e. LTC in Sweden is not only available to the poorer segment of the population, as is the case in England, Italy, and Spain. The same applies to the right to care, whether it concerns institutional care, home-based care, or home nursing care.
The stock of housing is a function of supply and demand, and the theoretical basis applied in this article is a simplified DiPasquale-Wheaton model. Here, we concentrate on the desired level of housing stock, similar to Steiner (Citation2010) in the Swiss market and Leung and Wang (Citation2007) in the Chinese market, using a stock-flow-model, by looking at the impact of housing stock levels on prices and/or macroeconomic fundamentals while allowing for disequilibrium be adjusted in several periods. According to Steiner (Citation2010), the housing stock level depends on the stock during the previous time-period (t − 1), “time to build,” and depreciation rate. The reactions of the stock level to shocks are slow (4–5 years), but prices and investments react faster. Long-run equilibrium exists if the stock in period t equates to the long-run demand, where population, income, or wealth affects the demand. With lower case letters expressing logarithms, this could be expressed as the model used in Steiner (Citation2010):
(1)
(1)
where Ut is the welfare variable mentioned above, p is house prices, and the last term is the adjustment term, with an expected sign according to whether there is excess demand or excess supply in the market. What might be included in Ut that would affect the supply of special housing for the elderly? As previously discussed, the supply of special housing for the elderly in a municipality results from both the municipality’s planning and thus various key figures that measure current and future needs and variables affected by market factors. We start by looking at Ut in the following way:
(2)
Size refers to the municipality’s geographical size as well as the number of inhabitants in the municipality. This also includes one of the key variables, namely the number of older people in the municipality. The expected sign of size is positive. Urbanization refers to how many of the inhabitants live in urban areas. More urbanization means that there are economies of scale in, for example, the home care service, which enables the elderly to remain in the home to a greater extent. The expected sign of urbanization is, therefore, negative. The municipality’s financial strength is measured by the inhabitants’ average income (i.e. its tax base), the municipality’s income tax, and the tax equalization system in Sweden. Financial strength has an expected positive effect on the supply of special housing for the elderly. The political variable is intended to measure political power on a right-left scale. Here, we have included the proportion who voted for the Social Democrats in the local elections. The expected sign is unclear, but one could interpret that parties on the left side have a more significant attraction toward collective solutions, and thus the expected sign would be positive. The term housing market here refers to variables that measure how the housing market functions in the municipality. Housing prices are included partly as a measure of housing supply and partly as the alternative use of land. Higher prices are expected to dampen the supply of special housing for the elderly in the municipality. We have also included variables that measure what proportion of the elderly population live-in owner-occupied dwellings. A higher proportion of owner-occupied housing is expected to have a negative effect.
Methodology
The theoretical model discussed in the previous section has been estimated using a standard ordinary least square. Here, we have related four different dependent variables to several independent variables. The dependent variables have been the number of elderly housing units in the municipality over time, the number per capita, the average size of elderly housing units, and the equivalent per capita.
The independent variables can be classified into three groups: the municipality’s size, finances, and housing market. Variables that measure the municipality’s size are its population size, the number of elderly people in the municipality, its geographical size, and its degree of urbanization. Here, we can also include the variable of whether the municipality has positive net migration. The economic variables that have been included are the municipality’s average income, the municipality’s tax base, and its result from the equalization system. These three variables are intended to capture the housing market condition in the municipality. Average housing prices are intended to measure the alternative cost of land, and the proportion of rental housing versus owner-occupied dwellings is intended to measure the supply of substitutes for special housing for elderly.
Although we create a panel containing many municipalities over multiple years, we have not used a fixed-effect model or similar models. The main reason for this is that (1) we have a relatively small panel over time, (2) the variation in the dependent variable is limited, and (3) we have a relatively large number of independent variables that are, if not constant over time, then at least have a minimal variation. Hill et al. (Citation2020) discuss various shortcomings with fixed-effect models for panel data, where all the limitations relevant to our study are discussed in detail. Earlier literature discusses issues, such as time-invariant data, restricted sample, and low statistical power (Treiman, Citation2009; Nickell, Citation1981; Angrist & Pischke, Citation2009). We have also estimated the model with the so-called between effects model and a random effect model, as simulation results by Clark and Linzer (Citation2015) suggest that support for a random effect specification is larger in smaller panels than the fixed-effects model.
When estimating the model, it is essential to test whether the variables are stationary or not. If the variables are not stationary, there is a risk that the relationships we estimate are only spurious. We have done this with a so-called Levin-Lin-Chu test (Levin et al., Citation2002) and an Im-Pesaran-Shin test (Im et al., Citation2003). The Levin-Lin-Chu test assumes a common autoregressive term for all panels, and the Im-Pesaran-Shin test relaxes this assumption. In general, all stationary tests work best when there is a large number of period. This also applies to the test above. However, we have a relatively limited number of periods available (six or seven years depending on the series), making it difficult to draw any reliable conclusions based on the tests.
The empirical analysis
The data and descriptive statistics
The database contains data for 290 municipalities in Sweden over the period 2013–2019. All data comes from Statistics Sweden and the National Board of Health and Welfare. There is no consensus for defining the housing situation for the elderly (see Tinker et al., Citation2007). The housing supply for special housing for the elderly and disabled residents refers to an apartment that is wholly or almost wholly used for the purpose. Apartment refers to housing in single-family houses and multi-family houses. Senior housing is not included in the data. The special housing for the elderly is intended for the elderly or people with disabilities where accommodation is always combined with service, support, and personal care. Common areas often consist of a kitchen, dining room and living room. The statistics consist of the number of dwellings and the size of the dwellings.
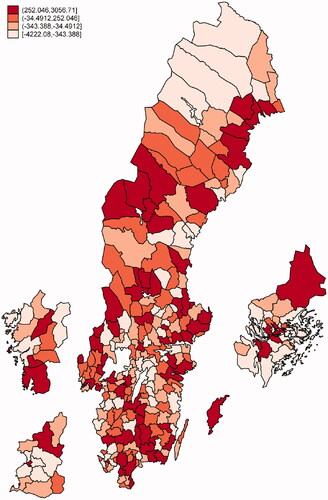
below illustrates the number of apartments per capita (blue map) and per number of older people (green map) in the municipality. The bluer or greener the municipality is the more housing units per population in the municipality.
Map 1. Number of Special housing units per capita and per elderly resident in 2018.
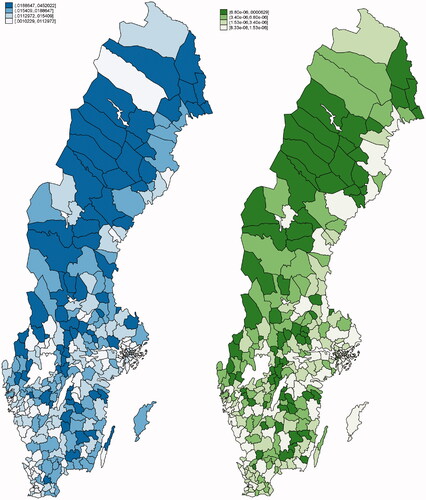
In the northern parts of Sweden, we can see that many municipalities have more apartments per capita and per elderly resident than in the more populous municipalities in Sweden’s southern parts. To find the imbalances in different parts of Sweden, the term εst is further analyzed in EquationEquation (1)(1)
(1) , as this term is an expression of whether there is excess demand or excess supply in the specific area; the vector Ut in EquationEquation (2)
(2) helps determine changes in the stock. The term εst–1 determines how the prices change according to this excess demand or excess supply.
The increase in the amount of special housing for the elderly and disabled residents corresponds to 11% from 2013 to 2019. In relation to the population increase of 7% during the same period, there is an increase in special housing. However, the population has grown older, and in relation to people over the age of 75, the increase in special housing is relatively moderate. For example, the number of people aged 75 and over has increased by 18% during the same period. The proportion of the population over the age of 95 has increased by as much as 29%. The conclusion is that even though the number of special dwellings has grown over the period, it has not increased in step with the population increase in the older age ranges.
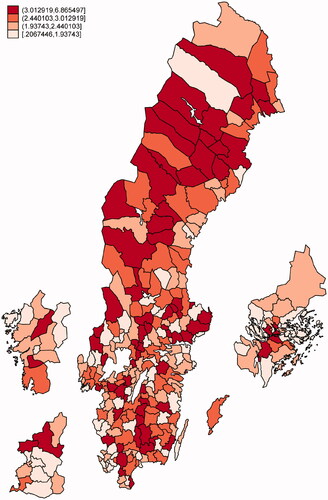
We have also analyzed the size of special housing units. The information we have about the size is in size classes of 10 square meters: 0–10 square meters, 10–20 square meters up to larger than 60 square meters. We have used the class middle of the interval to estimate the size of the special housing stock available in the municipality. illustrates the distribution between the municipalities regarding the size (square meters per capita) of special housing units per number of older adults in the municipality. There is a relatively large spread between the municipalities, and many of the municipalities in the northern parts have a lower number of older residents as a proportion of the population and larger dwellings per older adult (darker red) compared with the southern parts of Sweden (pink). In the populous metropolitan regions, housing size is generally smaller than in other parts of Sweden.
Map 2. Available housing area per elderly resident in square meters, the year 2018.
It is no surprise that the population size can largely explain the number of special housing units in a municipality. The number of special housing units is, in many ways, a planning issue. Nevertheless, as we have seen, the number of special houses has changed over time, and there are regional differences in the number of special houses per capita.
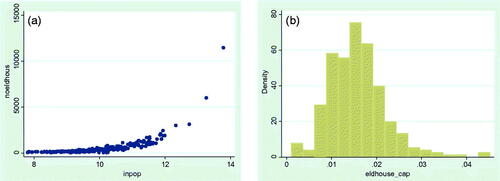
In below, we have related the number of special housing units for elderly and disabled residents to the municipality’s size. The population is represented in the natural logarithm. It is clear that the connection is strong, but we can observe a variation, i.e. the connection does not form a straight line; there is instead variation between municipalities with the same relative population size. It becomes even more evident in , where we illustrate the proportion of special housing units per elderly resident. The distribution of special houses for the elderly per older resident is almost a normal distribution where some municipalities have significantly fewer special housing units than others.
Figure 1. Number of special housing units and population, 2018.
below presents descriptive statistics regarding the number of units and size of special housing for elderly and disabled residents, as well as the population size and the number of elderly residents as a proportion of the total population of the municipality. In addition to these variables, we intend to analyze whether other independent variables can explain the observed variation between municipalities over time. This variation consists of, for example, the average income in the municipality, the amount of the municipal tax, and whether moving in or out to the municipality. The data source for all variables is Statistics Sweden.
Table 1. Descriptive statistics.
The size of a municipality, measured as population and/or employment, naturally has a significant impact on the level of investment. Also, smaller municipalities may find it more challenging to maintain and make larger investments year after year; instead, investments may be more sporadic in specific years. On average, the municipalities are relatively small, but the variation is considerable. There are three major metropolitan areas with more than 250,000 inhabitants, some medium-sized cities with 100,000 inhabitants and many small towns. On average, the population per municipality is only around 35,000 inhabitants, but the standard deviation is double. Whether elderly individuals historically reside in the municipality or relocate to special houses for elderly in the municipality from elsewhere also has a major impact on both the possibility of financing investments in special houses for elderly and the need for special houses for the elderly. The proportion of employed residents in the municipality is a consequence of the population size, whether the elderly population resides in residence or moves from another municipality, and the proportion of older residents in the municipality.
If a municipality has a large positive or negative net migration, it also has a large impact on both the possibility of financing investments in special houses for the elderly and the need for special houses for the elderly. Many municipalities have net migration where the younger population moves to the metropolitan regions. This, of course, creates challenges if the municipalities are to invest in special houses. The average net immigration in the municipalities studied is negative when measured as a percentage of the total population. However, the variation around the average net occupancy is relatively large.
If the population size is an important variable to explain the number of elderly people living in the municipality, then the number of older people in the municipality is essential. The number of residents aged 65 and over is, on average, around 23% of the population. The variation measured as a standard deviation around the mean value is relatively modest, but the spread in the range is from 12% to 35%.
In addition to the municipality’s size, its finances are essential for understanding the municipality’s historical investments in elderly housing. We will measure the municipality’s financial strength with three variables: the municipal citizens’ average income, the size of the municipal income tax, and the outcome of the municipal equalization mechanism. The average spread in income is relatively large. The spread, measured as a standard deviation, constitutes approximately 13% of the mean. The average income is SEK 186,000, with a minimum of SEK 134,000 and a maximum of SEK 381,000. The municipal tax rate varies from just under 29% to just over 35%. This represents a significantly lower variation than for income, but with the average income level, taxes significantly impact the municipalities’ finances and ability to invest in elderly housing.
In Sweden, a system of Equalization between regions has been implemented. The equalization system aims to compensate for the structural differences that affect the municipalities and regions’ economic conditions. We have included information on whether the municipality is a net donor or a net recipient in the equalization system measured per inhabitant in the municipality. The average net grant that a municipality receives is approximately SEK 10,000 with a variation from minus SEK 17,000 to SEK 29,000. We hypothesize that the redistribution system’s effect can positively and negatively impact the amount of special houses in the municipality. An overcompensation for structural differences could lead to excessive investment in special houses, while less compensation can lead to a shortage of special houses units.
We also have a variable that measures how the population has voted in the local elections. The figure that we have included in the model is the proportion of the municipal population who voted for the Social Democrats in the local elections. On average, the proportion amounts to just over 30%, with a standard deviation of 8%. The reason for including a variable that captures party preferences is that parties on the left are generally perceived as more focused on welfare issues, and the number of special houses could be perceived as a welfare issue.
The geographical size of the municipality (variable name areal) can impact the supply of elderly housing. Lower population density can lead to poorer economies of scale, leading to fewer special homes for the elderly. The same also applies to the degree of urbanization in the municipality. The more urbanized the municipality is, the higher the degree of scale economies and the more special housing. The degree of urbanization is measured as the proportion of the population living in urban areas compared with those living in rural areas. The municipality’s average size amounts to approximately 1,404 square kilometers, and the degree of urbanization amounts to approximately 76%. The variation around the average is substantial.
Finally, several variables are also included that measure housing types and housing costs in the municipality. The study includes two variables that measure the proportion of residents in the rental market and single-family homes. The proportion is calculated for people over 65 years of age (variable name ratiorental65 and ratioown65). More housing in the rental sector is expected to lead to lower pressure on elderly housing. On average, 22% of people over 65 live in a rental apartment and 61% in single-family houses. The remaining portion lives in condominiums in apartment buildings. The variation between the municipalities is great. The standard deviation is equal to 6 and 13%, respectively.
In addition to these variables, we have also measured the value of alternative land use, namely housing with ownership for all citizens in the municipality (variable name House prices). Higher house prices in a municipality mean that the alternative value is higher, which is expected to reduce the supply of special housing, all other things being equal. The variation in housing prices is substantial. On average, housing prices are equal to SEK 1,956,000 with a standard deviation of SEK 1,562,000. We hypothesize that municipalities with higher housing prices will have a lower proportion of homes for the elderly and smaller special housing units for the elderly than municipalities with lower housing prices.
Pretest of the data
As mentioned earlier, we analyze a panel of 290 municipalities over seven years. Both the number of special housing units and the size of special housing units has increased over time, while the number of special housing units per older resident has decreased. We can also observe that some of the independent variables have also increased over time. shows whether the series is stationary, trend stationary, or non-stationary.
Table 2. Stationarity test of the panel data.
As mentioned, we have a relatively short panel at only 6–7 years. Therefore, one should be careful not to draw far-reaching conclusions from the tests. The results indicate that data regarding the number of special houses and the size of these are all stationary, which means that we can estimate our models’ levels. The Levin-Lin-Chu test shows that all panel data series are stationary (with the variable share in the rental sector as an exception), that is, integrated of order zero. This suggests that all models can be estimated with level data. On the other hand, the Im-Pesaran-Shin test shows that most variables are trend stationary, suggesting that estimated models should contain fixed time effects. However, some exceptions can be noted. Population, income, and the equalization system are neither stationary nor trend stationary. Hence, considering that the Levin-Lin-Chu test still shows that the variables are stationary and that the strength of the tests is limited given the short period we study, we have concluded that the model can be estimated in level, but fixed time effects will be included.
Basic econometric models
shows four different Models 1–4. The first two refer to models that explain the number of special houses and the number of special houses per capita. The next two models model the size of the elderly housing in the municipality and the size per capita. Fixed annual effects are included in the specification, but the results are not shown in the table.
Table 3. Results (OLS-models).
The degree of explanation (R2 and adjusted R2) is very high in the two models that measure the number of special houses for the elderly and the size of the special houses (Models 1 and 3). On the other hand, the unrelated variables can only explain a small part of the variation across municipalities regarding number per capita and size per capita, respectively (Models 2 and 4). also presents the Breusch–Pagen test results for heteroscedasticity, with a test statistic from 170.96 to 2246.55. Compared to a Chi-squared distribution with one degree of freedom, the resulting p value falls well below the standard .05 level. Thus, we have clear evidence to reject the null hypothesis of homoscedasticity and accept the alternative hypothesis that we do have heteroscedasticity in this regression model’s residual. All models have been estimated with White heteroscedasticity-consistent standard errors. The average VIF value (3.68) is low, which indicates that we have a low risk of multicollinearity. There are mainly two variables with a higher VIF value (around 10): income and house prices. However, caution should be exercised when interpreting the effect of these variables.
Statistically, only the variables Employment and the proportion of housing in rental housing (Rental Owning) can explain either the amount of special housing, its size, or its equivalents per capita. In Model 1, where the number of special housing is the dependent variable, we can note that the population and the proportion of older people in the municipality have a high statistical significance. The same applies to the income variables Income and Equalization. However, the tax level in the municipality does not have an effect. The total population, the proportion of elderly residents in the municipality and the average income in the municipality all have the expected signs, i.e. if the variable in question increases, the number of special housing units increases, everything else being equal. The parameter estimate regarding Equalization has a negative sign, which could be considered unexpected. Our interpretation is that if the municipality is a net recipient of municipal support, it has less special housing. If the proportion of residents who voted for the Social Democrats increases, it does not affect the number of special housing. In terms of the housing variables, it can be stated that if the proportion of residents in single-family homes decreases, the number of elderly housing units decreases. As mentioned earlier, the proportion of residents in rental housing does not have an effect. The level of housing prices has a statistically significant impact on the number of special houses for the elderly. An increase in the price level reduces the number of special housing units for the elderly. Geographically, larger municipalities have slightly more units, while municipalities with a higher degree of urbanization have fewer units than rural municipalities.
In Model 2, where we use the number of special housing units per capita as a dependent variable, it can be noted that, as in Model 1, the number of special housing units per capita increases if the proportion of the elderly population increases in the municipality. Unlike Model 1, the estimates show that per capita, the number of units for the elderly decreases if the municipality is a positive net migration municipality and a geographically larger municipality. If income increases, a municipality is a net beneficiary of Equalization or if taxes increase, municipalities have more special housing per capita. As in Model 1, if a municipality has a higher proportion of the population in single-family homes, more residents in urban areas or higher housing prices, the number of units for the elderly decreases.
The difference in parameter estimates in Model 3 compared to Model 1 is relatively small. In Model 3, the estimated amount of living area in the special housing stock in the municipality is used as a dependent variable. The difference relates mainly to the fact that the municipality’s income tax level has a statistically significant effect on size. An increase in the tax level does not necessarily lead to an increase in the number of units for the elderly, but the size of the individual housing units for the elderly increases. The differences between Models 4 and 2 are also small, but the results indicate that the degree of urbanization does not play a role in the size of special housing. Otherwise, all other parameter estimates have the same sign and order of magnitude in Model 4 as in Model 2.
Between and random effect models
We have also estimated between effect and random effect models to reduce the risk of omitted variable bias and heterogeneity. The results from these models are presented in the table below. Only the models that explain the number and size of special housing per capita have been estimated. The results are presented in and .
Table 4. Results (between-effect, regression on group means).
Table 5. Results (random effect, maximum-likelihood estimates).
shows parameter estimates for all models where the effect has been estimated using the so-called between-effect model. The difference between these results and the OLS estimates in is not dramatic. In principle, all variables have the same sign as in the OLS model, but some of the estimates are not significantly different from zero. We can observe the most significant difference: neither geographical size nor the degree of urbanization influences the number or size of special housing for the elderly. Concerning the variable net migration, we can note that the effect appears to be of greater importance in the between-effect model than for the OLS model. Other estimates are within the margin of error. This suggests that the OLS estimates are relatively robust.
The random effect model presented in has remarkable similarities with the OLS result, although several estimates are not significantly different from zero. The population size does not have the same consistent positive effect, net migration has no significant effect at all, the income level has only one effect in the model parts that do not meet the per capita effect, and the equalization system does not have an effect. The same applies to the proportion of residents in rental housing, which only partially affects the various model specifications. On the other hand, the proportion of older people in the population has a positive impact, as do the municipality’s geographical size and degree of urbanization.
Cohort effect
Having a high proportion of residents over the age of 65 does not necessarily mean that a municipality’s demand for special housing for the elderly will be noticeable. Age is of great importance, and municipalities with a high proportion of the population over the age of 85 see a more significant impact on demand than municipalities with a lower proportion. Therefore, we have divided the variable older than 65 into 10-year cohorts and analyzed the effect within each group. The table below illustrates the effect of the different age groups ().
Table 6. Results (cohort effects).
We can note that the older age groups have a more significant impact on the number of special housing units per capita and size per capita. The result itself is not surprising. Even if the demand for special housing does not exist in the younger age groups, it is, of course, a good predictor of future needs. The expectation was that the proportion of the population older than 95 years would have the most significant impact, but this is not the case. This may be partly because, in many municipalities, this group is relatively small and partly because planning to meet demands for special housing often occurs based on age groups younger than 95 years.
Analysis of the residuals
We are left with the question: how do we interpret the residuals/error? By definition, this figure shows the difference between the actual number of special housing units and average size in a municipality and the estimated number/size. In municipalities with a positive error term, this means that the observed housing stock is larger than the estimated housing stock, which can be interpreted as an oversupply of elderly housing. On the other hand, municipalities with a negative error term have an undersupply of elderly housing. We have previously tested for the presence of hot spoon stability and spatial dependence in the residual. The residuals are plotted in .
Figure 2. Histogram residual, accumulated over the years 2013–2018.
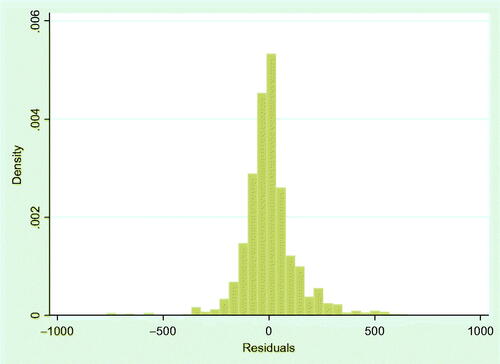
The accumulated oversupply and undersupply of special housing for the years 2013–2018 are illustrated in . What we can observe is that there is a relatively large spread within the country. The variation is significant, especially if you relate it to the average number of special housing units per capita. However, the pattern is not clear; for example, there are no spatial clusters with excess or deficit. A concentration can be discerned with an excess of special housing in the metropolitan regions.
Map 3. Residuals (over/undersupply), the years 2013–2018.
Relation to COVID-19 distribution
Data for 2020 is marked by the COVID-19 pandemic. The number of people infected and deceased has been extensive, and the elderly population has been disproportionately affected (Burton et al., Citation2020). Of those affected by COVID-19 in Sweden, the median age is 61, and approximately 78% have some type of risk factor, such as cardiovascular disease, high blood pressure, or diabetes. It is mainly men who have been affected, and in the upper age ranges, about twice as many men have been affected than women. For the population over 70 years, 570 men have been infected by COVID-19 compared to 250 women. However, the survival rate of those who have been affected is approximately equal between men and women (source: Swedish Intensive Care Register, 24/11/2020).
Many of the elderly residents included in this survey have been living in special housing. Statistics on deaths per municipality are difficult to analyze, as some municipalities have very few residents who have become ill or died. However, one figure that has been possible to produce at the regional level is the number of infected people over 70. The data comes from the National Board of Health and Welfare and refers to what the situation looked like as of October 2020.
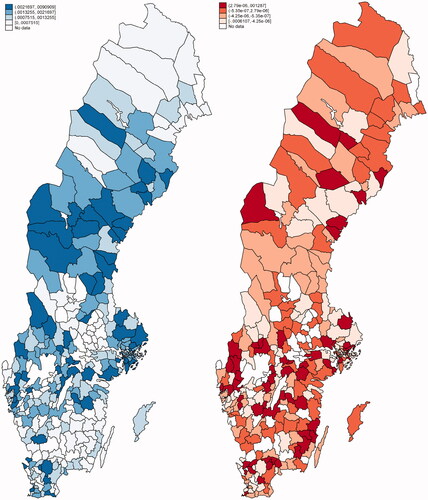
illustrates the distribution of those infected with COVID-19 per number of special housing units in the municipality (Blue map); that is, we analyze whether there is a relationship between the number of infected and special housing. Moreover, we investigate whether there is a connection between over-/undersupply of special housing in the municipality and COVID-19 infection (Red map) and whether there is a spatial variation between the distribution of the expected number of special dwellings and COVID-19.
There is a concentration of COVID-19 cases in the metropolitan regions, where the Stockholm region has been particularly hard hit. It is also noteworthy that the number of cases per capita has also been considerable in central Sweden. However, the correlation between the number of cases per capita and the number of special housing units per capita or the average size of the elderly housing units is almost zero. Furthermore, the correlation with an oversupply or undersupply of elderly housing is also close to zero. Hence, the result is clear concerning COVID-19 cases and the accumulated over and undersupplies of special housing. The spatial variation in the number of COVID-19 cases is not correlated with the distribution of accumulated over and under-supply of special housing for 2013–2018. The conclusion is that municipal decisions to build more special housing units for the elderly have not impacted COVID-19 cases among the population over 70.
Map 4. COVID-19 per capita and by over/undersupply of special housing.
Conclusion
Significant demographic changes are taking place in Sweden as well as in many other countries. The proportion of older people will almost double, and people older than 80 will triple. This will place significant demands on health care, both in residents’ own homes and elderly care facilities. The supply of special housing for elderly will be decisive for how well a society can handle this demographic change. Today, we can see that the distribution of special housing per capita varies considerably between municipalities.
Of course, the supply of special housing depends on the municipality’s planning activities and private actors in elderly care, who tend to make market-based decisions. We have set out to investigate what can explain the spread in distribution that we can observe. The explanatory factors included in our explanatory model are partly the municipality’s size, finances, political governance, and how well the housing market functions in general.
What we find in general is, not surprisingly, that the proportion of older people in the municipality, together with the size of the municipality, is the variable that best explains the amount of elderly housing in the municipality. Geographically large municipalities have more homes for the elderly, while more urbanized municipalities have fewer. We can also note that the municipality’s tax revenue positively impacts the housing stock for the elderly. Other factors do not have an equally robust effect, depending on the model specification and model estimation.
Planning for the future demand for elderly housing is a task that cannot be ignored. The population is getting older, which means that the costs borne by future generations will be high. Some municipalities are further ahead when it comes to investments in elderly housing, while others are lagging. In many cases, these municipalities trust the other parts of the housing market to function well enough to accommodate any needs that might arise.
Acknowledgments
We would like to thank the research project Housing 2.0 (Bostad 2.0) for financial support.
Disclosure statement
No potential conflict of interest was reported by the author(s).
Data availability
This is a project at Royal Institute of Technology (KTH) where Mats Wilhelmsson is working: (https://www.kth.se/bostad2noll/kthbostad-2-0-en-bostadsmarknad-for-alla-1.749663).
Additional information
Funding
Notes
2 The housing supply for special housing for the elderly residents refers to an apartment in a single-family houses or a multi-family houses. The special housing is intended for the elderly or people with disabilities where accommodation is always combined with service, support, and personal care. Common areas often consist of a kitchen, dining room and living room.
3 Means-tested access and entitlement to long-term care services.
4 Motion till riksdagen 1998/99:So 436 av Margareta Viklund (kd):
https://www.riksdagen.se/sv/webb-tv/video/motion/adelreformen_GM02So436
References
- Angrist, J., & Pischke, J. S. (2009). Mostly harmless econometrics: An empiricist’s companion. Princeton University Press.
- Burton, J. K., Bayne, G., Evans, C., Garbe, F., Gorman, D., Honhold, N., McCormick, D., & Othieno, R. (2020). Evolution and effects of COVID-19 outbreaks in care homes: A population analysis in 189 care homes in one geographical region of the UK. Lancet Healthy Longevity, 1, 1–31. https://doi.org/10.1016/S2666-7568(20)30012-X
- Clark, T. S., & Linzer, D. A. (2015). Should I use fixed or random effects? Political Science Research and Methods, 3(2), 399–408. https://doi.org/10.1017/psrm.2014.32
- Coleman, B. J. (1995). European models of long-term care in the home and community. International Journal of Health Services: Planning, Administration, Evaluation, 25(3), 455–474. https://doi.org/10.2190/FYP6-DLWY-WKKT-6NNJ
- Gibson, D. (2020). Planning the supply of aged care services: It’s time to talk denominators. Australasian Journal of Ageing, 39, e515–e521. https://doi.org/10.1111/ajag.12823
- Hill, T. D., Davis, A. P., Roos, J. M., & French, M. T. (2020). Limitation of fixed-effects models for panel data. Sociological Perspectives, 63(3), 357–369. https://doi.org/10.1177/0731121419863785
- Houben, P. P. J. (2001). Changing housing for elderly people and coordinating issues in Europe. Housing Studies, 16(5), 651–673. https://doi.org/10.1080/02673030120080107
- Im, K. S., Pesaran, M. H., & Shin, Y. (2003). Testing for unit roots in heterogeneous panels. Journal of Econometrics, 115(1), 53–74. https://doi.org/10.1016/S0304-4076(03)00092-7
- Karlsson, M., Iversen, T., & Øien, H. (2010). Scandinavian long-term care financing [Working Paper 2010:2]. University of Oslo: Health Economics Research Programme. https://doi.org/10.1057/9780230349193
- Leung, C. K. Y., & Wang, W. (2007). An examination of the Chinese housing market through the lens of the DiPasquale-Wheaton model: A graphical attempt. International Real Estate Review, 10(2), 131–165.
- Levin, A., Lin, C. F., & Chu, C. S J. (2002). Unit root tests in panel data: Asymptotic and finite-sample properties. Journal of Econometrics, 108(1), 1–24. https://doi.org/10.1016/S0304-4076(01)00098-7
- Nickell, S. (1981). Biases in dynamic models with fixed effects. Econometrica, 49(6), 1417–1426. https://doi.org/10.2307/1911408
- Riedel, M., Kraus, M., & Mayer, S. (2016). Organisation and supply of long-term care services for the elderly: A bird’s-eye view of old and new EU member states. Social Policy and Administration, SSN, 50(7), 0144–5596. https://doi.org/10.1111/spol.12170, 50(7), 824–845
- Steiner, E. (2010). Estimating a stock-flow model for the Swiss housing market. Swiss Journal of Economics and Statistics, 146(3), 601–627. https://doi.org/10.1007/BF03399329
- Suzuki, K. (2001). Marketisation of elderly care in Sweden [EIJS Working Paper Series 137]. Stockholm School of Economics, The European Institute of Japanese Studies. RePEc:hhs:eijswp:0137
- Tinker, A., Zeilig, H., Wright, F., Hanson, J., Mayagoitia, R., & Wojgani, H. (2007). Extra care housing: A concept without consensus. Quality in Ageing and Older Adults, 8(4), 33–44. https://doi.org/10.1108/14717794200700026
- Treiman, D. (2009). Quantitative data analysis: Doing social research to test ideas. Josse-Bass.