
Abstract
Glyphosate is the most widely used herbicide worldwide. However, since the International Agency for Research on Cancer (IARC) classified glyphosate as a Class 2A ‘probable carcinogen’ to humans, the safety of this synthetic chemical has been under debate and requires validation. Most studies on glyphosate have been conducted in animals, and the effects of glyphosate in humans are not fully understood. In the present study, we report that glyphosate increases the rate of cell growth in human embryonic kidney 293 (HEK293) cells. Interestingly, the concentrations of glyphosate ranging between 0.6 and 18 µM enhance cell proliferation, while lower or higher concentrations do not stimulate cell growth or interfere with it, respectively. At the molecular level, cell biology and biochemical data demonstrate that glyphosate promotes the transcription of EGR1, JUN, FOS, and MYC, which are critical transcription factors and immediate early genes for cell cycle progression, and cell cycle regulators including cyclin B1, cyclin D1, and p21. NEAT1, a long non-coding RNAs that is implicated in cancers and active gene transcription are increased in glyphosate-treated cells. In addition, the absorption efficiency of glyphosate to HEK293 cells estimates approximately 11 pM/cell/day, and glyphosate metabolism appears increased when incubated with HEK293 cells. Our findings provide valuable evidence on the effects of glyphosate on human cell growth and suggest that glyphosate promotes cell proliferation by activating gene expression of cell cycle regulators in humans in vitro.
Abbreviations: IARC: International Agency for Research on Cancer; EPSPS: 5-enolpyruvylshikimate-3-phosphate synthase; AMPA: aminomethylphosphonic acid; WHO: World Health Organization; EFSA: European Food Safety Authority; RT-qPCR: reverse transcription quantifying PCR; lncRNA: Long non-coding RNA; NEAT1: Nuclear paraspeckle assembly transcript 1; WST: water-soluble tetrazolium salt; ChIP-PCR: chromatin immunoprecipitation-polymerase chain reaction; CDKs: cyclin-dependent protein kinases; MALAT1: metastasis-associated lung adenocarcinoma transcription 1; LC-MS-MS: liquid chromatography-tandem mass spectrometry.
Background
Humans are environmental beings, affecting and being affected by their surroundings. They are exposed to the environment mainly through direct and indirect contact and consumption of produce. The well-being and health of humans are thus closely related to the soundness of the environment, in particular, what humans make contact with and consume daily. This is one of the important reasons why environmental pollutants and contaminants are carefully evaluated for safety in modern societies.
Herbicides are extensively used on farms and at homes to remove unwanted vegetation (Benbrook Citation2016). Glyphosate is the most widely used herbicide since it was introduced to the market in 1974 (Tarazona et al. Citation2017). It is a phosphoric amino derivative of glycine, the smallest amino acid and was considered to be safe and harmless to animals and humans. This herbicide targets 5-enolpyruvylshikimate-3-phosphate synthase (EPSPS) that is present in plants but not in mammals (Funke et al. Citation2006). Glyphosate is a strong chelating agent that sequesters minerals and divalent ions including calcium, iron, magnesium, and zinc, from plants (Mertens et al. Citation2018). Some studies have shown that glyphosate degradation is expedited by soil bacteria and takes approximately 2–3 days in some laboratory test (Kryuchkova et al. Citation2014; Torretta et al. Citation2018). The half-life of glyphosate in water varies between 14 and 91 days (Torretta et al. Citation2018). Glyphosate can be also degraded through abiotic pathways (Barrett and McBride Citation2005). The main metabolite of glyphosate, aminomethylphosphonic acid (AMPA) has toxicologically similar characteristics to its precursor, is more resilient than its precursor, and has a reported half-life of 76–240 days (Dominguez et al. Citation2016). In an alternative pathway, a glyphosate molecule can be degraded to a phosphate and a sarcosine intermediate which is in turn converted to glycine (Gonzalez-Valenzuela and Dussan Citation2018).
For approximately three decades, glyphosate had been considered to be safe to mammals, including humans, until the report by IARC in 2015 (Cressey Citation2015). The IARC, which is the specialized cancer agency of the World Health Organization (WHO), has classified glyphosate as ‘probable carcinogen’ to humans. In the same year, however, another organization, the European Food Safety Authority (EFSA) declared that glyphosate is ‘unlikely carcinogenic to humans or to cause any type of risks to human health (https://www.efsa.europa.eu/en/press/news/151112).’
These declarations have been largely based on data and data interpretations from tests conducted in animals, with conflicting evidence from studies conducted in humans (Mesnage et al. Citation2014; Defarge et al. Citation2018) (https://www.jcmnh.org/cell-damaging-effects-of-glyphosate-are-we-ready-for-roundup/). Potential harm in humans caused by glyphosate cannot be ruled out without extended examinations such as genetic analysis, simply because humans do not carry the glyphosate-targeted enzyme/pathway. In fact, a recent study has reported that Roundup herbicide affects diverse cellular pathways in estrogen positive and negative breast cancer cell lines through genomic analysis (Stur et al. Citation2019). In addition, there are glyphosate-susceptible gut bacteria, harboring the enzyme EPSPS and residing in humans and bovine intestinal tracks (Shehata et al. Citation2013). Numerous recent studies have demonstrated that gut microbiota have diverse effects on human psychology and physical and emotional health (Belkaid and Hand Citation2014; Evrensel and Ceylan Citation2015). Thus, it is plausible that ingested glyphosate may also indirectly influence human health. In the USA, about 19 million pounds of Roundup herbicide are used in farming each year. Approximately, 2% of glyphosate ingested through contaminated food is metabolized as AMPA, and the rest enters blood and is excreted through urine (Conrad et al. Citation2017). Glyphosate has been widely used in a vast amount, and its ingestion and physical contact by humans appear inevitable. Therefore, it is necessary to determine the physiological effects of glyphosate on humans through more direct and rigorous experiments.
In this study, we aimed to understand the function of glyphosate in molecular and biochemical levels and analyzed the effect of glyphosate in human kidney cancer cells using HEK293 cells. Initially, the phenotype of HEK293 cells was monitored through wound healing, cell proliferation, and crystal violet assays, finding that glyphosate augments cell growth. Interestingly, our biochemical analyses showed that glyphosate treatment at concentrations as low as 6 µM for 24 h was sufficient to recruit RNA polymerase II to the genes encoding critical transcriptional factors for cell cycle progression including EGR1, JUN, FOS, and MYC. This suggests that glyphosate promotes cell growth by modulating gene expression in transcription level. Consistently, our reverse transcription quantifying PCR (RT-qPCR) data showed that glyphosate affects mRNA expression of cell cycle regulators including cyclin B1, cyclin D1 and p21. In addition, glyphosate increases the expression of a long non-coding RNA (lncRNA), nuclear paraspeckle assembly transcript 1, NEAT1 that is known as a transcriptional regulator for many genes in mammalian cells. Furthermore, the absorption efficiency of glyphosate to HEK293 cells was estimated to be approximately 11 pM/cell/day using mass spectrometry. Glyphosate appeared to be metabolized to AMPA faster when incubated with HEK293 cells than the control without cells; about 30.8% of glyphosate was converted to AMPA after 24 h incubation.
Taken together, our data suggest that glyphosate at modest concentrations (0.6–18 µM) stimulates the proliferation of human kidney cells by facilitating cell cycle progression. In addition, we propose that glyphosate molecules are absorbed or digested by human kidney cells at 11 pM/cell/day. To our knowledge, these results suggest the novel function and mechanism of glyphosate in the human cell cycle regulation and serve to help reveal the molecular mechanisms of glyphosate in human physiology.
Results
Glyphosate increases the proliferation of HEK293 cells
Glyphosate, when ingested by mammals through contaminated food, enters the bloodstream and is excreted through the urine that is collected in kidney (Conrad et al. Citation2017; Torretta et al. Citation2018). Because the half-life of glyphosate or its metabolite, AMPA, in an aqueous solution is relatively long, i.e. approximately 14–240 days (Torretta et al. Citation2018), glyphosate may reside in the human body without degradation for a sufficient time and thus affect cells in different organs, particularly hematopoietic and kidney cells. Therefore, we questioned whether glyphosate at concentrations permitted to reside in agricultural produce (approximately 0.1–3 ppm in a variety of foods according to the US Code of Federal Regulation) can affect human kidney cells in vitro. HEK293 cell growth was monitored in the presence of glyphosate at increasing concentrations between 0 and 18 µM (0, 0.06, 0.6, 3, 6, and 18 µM; 0, 0.01, 0.1, 0.5, 1 and 3 ng/µl) through the wound healing assay.
Cells grown adherently as a mono-layer in liquid media were scratched using a sharp object and then microscopically monitored at 0, 4, 16, 24, and 32 h (Figure (A)). Microscopic photos were analyzed to measure and compare the recovering wound area using Image J (Figure (B)). The results showed that the wound was replaced with newly divided cells more promptly in the presence of glyphosate at concentrations between 0.6 and 18 µM (Figure (A,B)). The difference in wound healing rates became notable after 16 h (Figure (A,B) and Figure S1).
Figure 1. Glyphosate enhances cell growth rate. (A) Microscopic images from wound healing assay showing the HEK293 cell growth stimulated by glyphosate at concentrations at 0, 0.6, 3, 6, and 18 µM. (B) From wound healing assay, the wounded areas were measured using Image J and the rates of wound recovery were plotted for a statistic comparison. The initial wounded area was assigned as 1, and the reduced area for replacing cells were calculated relative to the initial area as 1. Error bars, s.d. (n = 2 biological replicates). Means were compared in pairs by T.TEST with values for time 0 in each glyphosate concentration (*P < 0.05; **P < 0.01). The concentrations between 0.6 and 18 µM shortened the healing time rapidly, and the maximum growth stimulatory effect was observed with glyphosate at 3 µM. (C) Representative crystal violet assay results showing the changes in cell growth with glyphosate. Stained cells were taken picture of (upper panel) and spectrophotometically measured at 595 nm (lower panel).
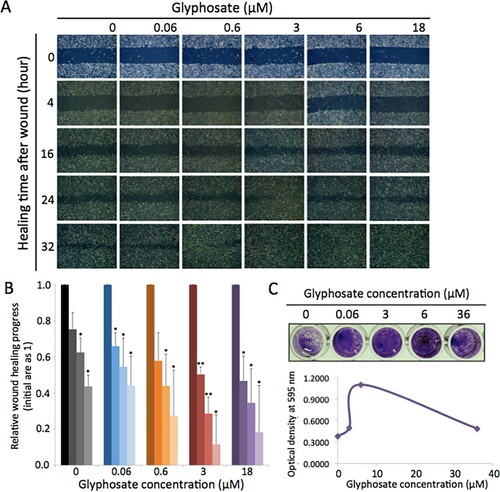
We aimed to visualize enhanced cell growth through the crystal violet assay. Crystal violet stains the proteins and DNA of adherent cells (Feoktistova et al. Citation2016). Dead cells are detached from the surface; therefore, the colorimetry intensity of crystal violet enables the quantitative comparison of live cells. An equal number of HEK293 cells, approximately 1 × 10⁴ cells, were seeded on 96 well plates, grown for 16 h in the presence of glyphosate at varying concentrations of 0 (water, control), 0.06, 3, 6, and 36 µM (0, 0.01, 0.5, 1, and 6 ng/µl), and subjected to crystal violet staining.
Consistent with data obtained from wound healing (Figure (A,B)), cells grown in the presence of glyphosate increased the number of cells more efficiently in the given time than the control without glyphosate (Figure (C)). In addition, the most significant increase in growth was observed in groups treated with milder glyphosate concentrations at 3 and 6 µM whereas growth increase became lesser in cells treated with a higher concentration at 36 µM. These results suggest that at mild concentrations, glyphosate positively influences cell growth and proliferation (Figure (A–C)).
Glyphosate controls gene expression of immediate early genes
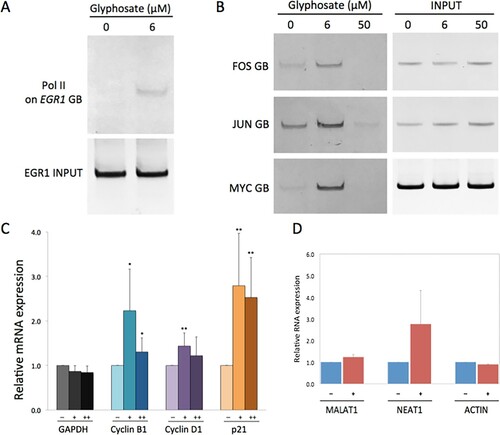
We hypothesized that increased cell growth in the presence of glyphosate is attributed to activated cell cycle regulators. To verify this hypothesis, we initially probed RNA polymerase II (Pol II) on an immediate early gene, EGR1, through chromatin immunoprecipitation-polymerase chain reaction (ChIP-PCR) (Selvaraj and Prywes Citation2004; Bunch Citation2016). This gene encodes a critical transcription factor for cell growth. The transcription of EGR1 is tightly controlled via Pol II promoter-proximal pausing and is activated in the early G1 phase of cell cycle (Bunch et al. Citation2015). HEK293 cells grown at glyphosate concentration 0 (control) and 6 µM (1 ng/µl) for 24 h were compared. After immunoprecipitation of chromatin using an anti-Pol II antibody, Pol II occupancy in the gene body of EGR1 was monitored by quantifying PCR (Bunch Citation2016, Citation2015).
Our data showed increased Pol II occupancy in EGR1 with glyphosate incubation compared to the control without glyphosate (Figure (A)). In addition to EGR1, Pol II status on other well-established immediate early genes and critical transcription factors including JUN, FOS, and MYC were probed using ChIP-PCR (Selvaraj and Prywes Citation2004; Bunch et al. Citation2015). The results showed that Pol II became recruited to the gene bodies of JUN, FOS and MYC at glyphosate concentration 6 µM (1 ng/µl) but not at 50 µM (13 ng/µl) (Figure (B) and Figure S2). Similarly, at glyphosate concentration 50 µM, Pol II was not increased in the gene body of EGR1 (Figure S2). These suggested the activated transcription at EGR1, JUN, FOS, and MYC in cells treated with glyphosate in a dose-dependent manner. This is important molecular genetic evidence of how glyphosate promotes cell division and thus enhances cell proliferation; glyphosate directly or indirectly activates transcription of immediate early genes that are critical transcription factors for cell growth. Therefore, we propose that glyphosate activates cell cycle progression by modulating the gene expression of pro-cell growth transcription factors including EGR1, JUN, FOS, and MYC (Figures and (A,B)).
Figure 2. Glyphosate stimulates gene expression of cell cycle regulators and growth factors. (A) ChIP-PCR showing Pol II accumulation in the gene body (GB) of a representative immediate-early gene, EGR1, in the HEK293 cells grown in the presence of glyphosate at 6 µM. The upper (Pol II on EGR1 GB) and lower (EGR1 GB in input chromatin) panels were acquired from two gels. Full-length gels are included in Figure S2. (B) Simultaneous Pol II ChIP-PCR analysis showing the increase in Pol II occupancy at JUN, MYC, and FOS in the presence of glyphosate at 6 µM, compared to the control without glyphosate, thus verifying transcriptional activation at JUN, MYC, and FOS genes in cells incubated with 6 µM glyphosate, but not 50 µM. Full length gels for Pol II and for input chromatin for the three genes were included in Figure S2. (C) RT-qPCR analysis showing mRNA expression of cyclin B1, cyclin D, and p21 in the control (H2O) and the glyphosate-treated samples (6 and 36 µM). GAPDH was included as a negative control for glyphosate induction and as a reference gene for RT-qPCR. For each gene, the first solid bar from the left is for the control and the second and the third are for 6 and 36 µM glyphosate treated sample, marked as –, +, and ++, respectively. Error bars represent standard deviation after normalization with GAPDH (for each bar, n = 4 biological replicates). Means were compared in pairs by T.TEST with values for no glyphosate (–) control (*P < 0.05; **P < 0.02). (D) RT-qPCR results showing RNA expression (relative expression to control as 1) of MALAT1, NEAT1, and ACTIN in the control (H2O, –) and glyphosate-treated cells (3 µM, +). Error bars represent standard deviation (n = 3 replicates).
Glyphosate activates the gene expression of major cyclins, p21, and a lncRNA NEAT1
In addition, we determined whether the gene expression of representative cyclins that are required to activate cyclin-dependent protein kinases (CDKs) during cell cycle progression is influenced by glyphosate. Cyclin B1 activity is reportedly the highest in the G2/M phase, and the transcription of cyclin B1 appears most active in the G2/M phase, e.g. over 10-fold increase than at the G1 phase in the reporter assay (Hwang et al. Citation1995). Cyclin D1 is a G1 phase-specific cyclin, important for an entry to the S phase whose level is regulated transcriptionally, post-transcriptionally, and post-translationally (Baldin et al. Citation1993; Langenfeld et al. Citation1997; Muise-Helmericks et al. Citation1998). p21 is a critical cyclin-dependent kinase inhibitor, generally recognized to mediate cell cycle arrest and apoptosis. In spite of such functions, increased expression of this protein has been also reported in various tumors (Jung et al. Citation1995; Abbas and Dutta Citation2009). In addition, p21 is known to assist cyclin D1-CDK4 assembly and nuclear accumulation (Alt et al. Citation2002). The transcription of p21 is reportedly activated by serum stimulation, and it also serves as a critical modulator of cell cycle in response to DNA damage (Macleod et al. Citation1995).
For the important functions of these genes in cell cycle regulation, we examined the mRNA levels of cyclin B1, cyclin D1, and p21 in HEK293 cells grown with or without glyphosate. HEK293 cells were grown to approximately 60–70% confluence before replacing the media including 6 and 36 µM (1 and 6 ng/µl) glyphosate or the same amount of H2O (0 µM, control). Glyphosate- or water-treated cells were incubated for 24 h, and RNA was extracted to construct cDNA. cDNA was then quantified through RT-qPCR. The results in Figure (C) showed that mRNA levels of cyclin B1 and cyclin D1 were notably increased in cells treated with glyphosate concentration 6 µM. For cells treated with a higher concentration 36 µM, mRNA levels of cyclin B1 and cyclin D1 were not increased. This is consistent with the data obtained from cell proliferation assays and Pol II ChIP-PCR probing cell growth activators (Figures and (A,B)). On the other hand, p21 expression was increased at both glyphosate concentrations of 6 and 36 µM (Figure (C)). These data suggested that glyphosate at moderate concentrations such as 6 µM induces the gene expression of cyclin B1, cyclin D1, and p21 to promote the cell cycle progression whereas the growth stimulatory effect is dampened at higher concentrations.
LncRNA genes have been recognized as important regulators in diverse cellular pathways including cell growth, apoptosis, differentiation, and carcinogenesis mainly through gene regulation (Bunch Citation2018). We asked whether glyphosate could affect lncRNA gene transcription and measured the transcription level change in metastasis-associated lung adenocarcinoma transcription 1 (MALAT1) and NEAT1 in the presence and absence of glyphosate at 3 µM for 24 h. These lncRNAs have been implicated in different types of cancers, neurodegenerative diseases, and cell proliferation. MALAT1 and NEAT1 are reported to be associated with transcriptionally active genes (West et al. Citation2014). We also note that NEAT1 is an important regulator of mitochondrial dynamics and function in recent studies (Wang et al. Citation2018). Our RT-qPCR showed little differential expression of MALAT1 while increased expression of NEAT1 in glyphosate-treated HEK293 cells compared to mock-treated cells (Figure (D)). This result suggests the influence of glyphosate on NEAT1 transcription and may indicate the altered expression of many genes and cell physiology by glyphosate.
Glyphosate metabolism and absorption in HEK293 cells
Our data demonstrated that glyphosate supplied to cell culture enhanced the growth of HEK293 cells (Figures –). It became thus interesting to understand the chemical nature of such effects. We inquired how rapidly glyphosate is degraded to AMPA in cell culture and whether it is absorbed or digested by cells. In particular, we aimed to estimate the absorption (or digestion) rate of glyphosate when incubated with HEK293 cells. To answer these questions, glyphosate supplied to cell culture with or without HEK293 cells were traced using liquid chromatography-tandem mass spectrometry (LC-MS-MS) (Figure (A)). Glyphosate, to a final concentration of 80 µM (13.3 ng/µl, T0), was added to approximately 1 × 10⁶ cells grown in the DMEM media (sample) or to the only media without cells (control). After 24 h (T24), the media were collected from the control and sample and compared for glyphosate and AMPA through LC-MS-MS (Figure (A)). The control and sample were diluted to 1:10 for the measurement, and 12 µM (2 ng/µl) glyphosate and AMPA at the same concentration were used as references for quantification. Peaks were confirmed to be ionized glyphosate or AMPA through product ion identification (glyphosate 150.5 m/z; AMPA 63.15 m/z) (Figures S3–4) (Chamkasem Citation2017).
Figure 3. Glyphosate metabolism is facilitated by human cells. (A) Experiment scheme to measure the quantities of glyphosate and its metabolite, AMPA, in the media with and without HEK293 cells after 24 h incubation of glyphosate. (B) LC-MS-MS chromatograms for quantifying glyphosate, comparing the reference (2 ng/µl glyphosate), blank (none), control (prepared from the media without cells, Figure (A)), and sample (prepared from the media with cells, Figure (A)). (C) LC-MS-MS results for quantification of AMPA, comparing the reference, blank, control, and sample. (D) Glyphosate and AMPA concentrations measured in the control (without cells) and sample (with cells) at T0 (0 h) and T24 (24 h). Note the increased AMPA and decreased glyphosate in the sample incubated with HEK293 cells, compared to the control. (E) Summary table of glyphosate and AMPA quantities identified from the control and sample.in T24.
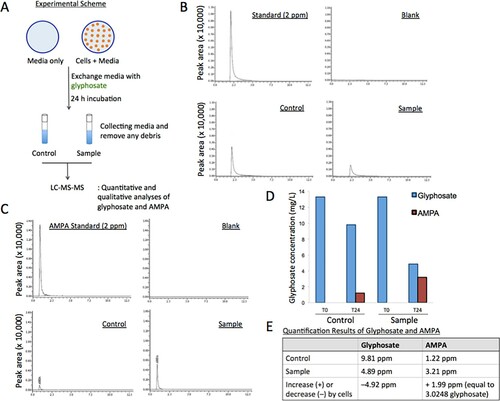
LC-MS-MS results showed the quantities of glyphosate and AMPA in the control and sample (Figure (B–D) and Figure S5). Glyphosate concentration in the control without cells was 9.81 ng/µl and was reduced to 4.89 ng/µl with the sample with cells at T24 (Figure (B and D–E)). The different amount of glyphosate, 4.92 ng/µl (9.81–4.89 = 4.92 ng/µl) was likely to have contributed to the increased AMPA amount in the sample; for AMPA, 1.22 ng/µl in the control was raised to 3.21 ng/µl in the sample at T24 (Figure (C–E)). It is noted that glyphosate incubated with cells enhanced the rate of glyphosate metabolism to AMPA over 2.5 fold, compared to the control without cells. The difference in AMPA quantities between the control and sample, 1.99 ng/µl (3.21–1.22 = 1.99 ng/µl), corresponds to 3.0248 ng/µl glyphosate, which is calculated using the formula, AMPA × 1.52 [conversion coefficient = 169.1 (glyphosate molecular weight)/111.04 (AMPA molecular weight)]. Out of the reduced glyphosate (4.92 ng/µl), a portion was probably degraded to AMPA; according to the conversion equation, the increased AMPA amount, 1.99 ng/µl, equals to the amount of glyphosate, 3.0248 ng/µl. This enabled us to calculate the lost amount of glyphosate in the sample to be 1.8952 ng/µl (4.92–3.0248 ng/µl = 1.8952 ng/µl), which is conceivably absorbed to cells or digested by cells to another metabolite(s), different from AMPA (Figure (E)).
Therefore, we estimated that the absorption rate of glyphosate to human kidney cells is approximately 11.4 pM/cell/day in our in vitro system. These results suggested the possibility of glyphosate or its metabolite(s) to function as a signaling molecule(s) to modulate physiological pathways, which will be important to be investigated in the future.
Conclusions
In the present study, we examined the physiological roles of glyphosate regarding cell growth and proliferation in human cells. From our understanding, it seemed to be an urgent task to validate the effects of this chemical in human cells in vitro along with the in vivo animal studies using mice. Although in vivo mice studies are extremely informative and beneficial, it cannot exclude the possibility of different physiological outcomes for substances exhibited by mice and human (Akhtar Citation2015; Perlman Citation2016). In spite of the limitations of in vitro cell culture in mimicking the cellular environment in tissue context, these cells preserve most cellular physiologies and serve as a potent tool to study functional and molecular mechanisms due to the controllable and definable nature. Therefore, we believe that our study and the findings presented here provide important information and insightful perspectives regarding the relation between glyphosate and human physiology.
Our findings indicate that glyphosate enhances cell proliferation by activating cell cycle progression in HEK293 cells. Interestingly, glyphosate-mediated cell growth alteration is dose-sensitive. The most effective concentrations to stimulate cell growth were between 0.6 and 18 µM, with the highest effectiveness seen between approximately 3 and 8 µM (Figures –). On the other hand, glyphosate at very low concentrations such as 0.06 µM did not improve cell growth. Higher concentrations such as 45 µM appear to interfere with cell growth. These observations seem to agree with other human or mouse studies in that some studies reported the carcinogenic effects of glyphosate but others not. In particular, it has been reported that glyphosate inhibits cancer cell growth (Li et al. Citation2013; Parajuli et al. Citation2016). These studies have the common aspect: using high concentrations of glyphosate in the range from 50 µM to 50 mM. On the other hand, some mouse studies have reported glyphosate as carcinogenic. A few studies evidenced mutagenic effect of glyphosate on DNA, increasing DNA adducts in glyphosate-treated human or mouse cells (Peluso et al. Citation1998; Kwiatkowska et al. Citation2017). Our study utilized relatively low concentrations, 0.006 < [glyphosate] <18 µM, at which humans could be exposed to glyphosate through contaminated foods and environment, and found that these moderate glyphosate concentrations positively affect cell proliferation. Although we haven’t tested DNA damage in context of glyphosate, which could lead to tumor development, high glyphosate concentrations appear to neutralize the positive effect of cell growth. We reason that this may attribute to the strong chelating, potential DNA damaging, or another unknown effect(s) to cells that high glyphosate concentrations may exert. It is also possible that glyphosate below certain thresholds can stimulate cell proliferation by acting as a mild stressor and thus inducing a hermetic response (Mattson Citation2008).
Our data showed that glyphosate activates the mRNA expression of major cell cycle regulators including cyclin B1, cyclin D1, and p21, immediate early transcription factors including EGR1, JUN, FOS, and MYC, and a lncRNA NEAT1. It is of interest to determine the mechanism of how glyphosate signals to turn on the transcription of these cell cycle activators in future studies. Here, glyphosate and its metabolic derivative, AMPA, were traced after a day-incubation with HEK293 cells. From this approach, we learned that glyphosate conversion to AMPA is more facilitated in the presence of human kidney cells. It is uncertain whether the effect shown in Figure attributes to the cells directly or indirectly and how the cells facilitate the degradation of glyphosate to AMPA. We calculated that approximately 11 pM glyphosate is likely to be taken or absorbed by a cell per day. It appears important to determine whether glyphosate or its metabolite can function as a signaling molecule directly from the surface or the inside of cells or through some indirect mechanism, to stimulate cell growth, in the future.
In this study, we provide multiple pieces of in vitro evidence that glyphosate modulates human kidney cell growth and this regulation appears to be dependent on the concentration of glyphosate. For molecular mechanisms, the accelerated cell growth by glyphosate attributes to an alteration of gene expression in the cell. In particular, deregulation of a couple of critical cell cycle-controlling genes has been monitored in the presence of glyphosate in moderate concentrations. Although animal/in vivo analyses have been done to test the safety of glyphosate and they are important and essential, the caveat is that animals do not mimic human physiologies and responses to environments exactly. In addition, most of the animal studies use high concentrations of glyphosate, much higher than the amount that humans have been ingesting or exposed through foods and environments. Therefore, it is essential to test glyphosate both with human cells or organoids in vitro and with animals/in vivo using the ingested/permitted concentrations to ensure public and sustainable safety. In this regard, our study can be considered as one of the initial steps for further, more rigorous mechanistic validations in vitro with this chemical. More human cells should be also tested to establish the findings shown in this study. We also tried to estimate the amount of glyphosate degraded into AMPA and absorbed by the HEK293 cell. It will be important to know whether glyphosate enters the cell or produces regulatory signals from the cell surface to control transcription, and we anticipate to determine and to answer this question continuously through further studies.
Methods
Cell culture and experimental conditions
HEK293 cells (obtained from ATCC) in the study were grown in DMEM supplemented with 10% FBS and 1% Penicillin/Streptomycin (P/S) solution. For ChIP-PCR ±glyphosate assay, HEK293 cells grown in a dish were supplied with glyphosate dissolved in water to corresponding working concentrations, were incubated for 24 h, and cross-linked in 0.75% formaldehyde followed by quenching cross-linking with glycine in a final concentration of 125 mM to media. Cells were rinsed with cold PBS twice before scraping them for next steps or snap freezing at −80. Except for the cells for qRT-PCR, HEK293 cells were grown to about 80–100% confluence (for qRT-PCR, 60–80%). Control cells were prepared side-by-side with sample ones in each and every experiment in the study. Glyphosate was obtained from Sigma-Aldrich (Cat # 45521) and dissolved in H2O to make a 266 ng/µl (1.57 mM) stock solution and stored as small aliquots at −70 degree.
Chromatin immunoprecipitation & PCR
ChIP-PCR experiment was conducted as described (Bunch et al. Citation2014, Citation2015). ChIP experiment was conducted following Abcam X-ChIP protocol with mild modifications. Cell lysis buffer includes 5 mM PIPES (pH 8.0), 85 mM KCl, 0.5% NP-40 and fresh protease inhibitors described above. Nuclei lysis buffer including 50 mM Tris-Cl (pH 8.0), 10 mM EDTA, 1% SDS was added before sonication. Sonication was performed at 12% amplitude for 30 sec with 2 m intervals on ice, Sonic Dismembrator Model 500, Fisher Scientific and was optimized to produce DNA segments ranging between +100 and +1000 bp on a DNA gel. Antibody used in IP was Pol II antibody (A300-653A, 3 µg/IP) from Bethyl Laboratories Inc. After IP and reverse cross-linking, DNA was purified through Qiagen PCR purification kit. Input DNAs were quantified for qPCR analysis. qPCR was performed using Platinum Tag DNA Polymerase High Fidelity (Invitrogen) under the thermal cycling as 2 m at 94 degree followed by 30 cycles of 20 s at 94 degree, 30 sec at 55 degree, and 30 sec at 68 degree. The antibody listed above has been validated for the relevant species and applications, and the validation is provided on the manufacturers’ websites.
Wound healing assay
HEK293 cells were grown in 6 well plates in the condition described above. When the confluence reached 80–100%, a scratch was introduced carefully on the cell lawn using a yellow pipette tip, followed by removing the media and washing off the released cells with prewarmed PBS. The cells were replenished with fresh media with an appointed concentration of glyphosate or water control and monitored and taken images of using a light microscope (Leica DMi1) in designated time points. The collected images were analyzed using Image J program. The wound area of each image was measured: the initial wound area was set as 100%, and the relative percentage values in later time points were calculated to generate graphs. When no gap was visible, meaning a complete closure of wound was set as 0%.
Cell proliferation assay using WST
Approximately 1 × 10⁴ or 2 × 10⁵ HEK293 cells were seeded in each well of a 96 well plate with the media including glyphosate at corresponding concentrations or water as a control. The same volume of glyphosate stock or water was applied to each well in any set of experiment in the study. The cells were grown for 16.5 h and then 10 µl WST reagent (EZ-Cytox, DoGen Bio Inc.) was added to every 100 µl cell-media mixture. The enzyme–substrate reaction was allowed for 0.5–2 h at room temperature with gentle shaking before the absorbance at 450 nm was measured using a microplate reader (Sunrisetm Absorbance Reader, Tecan).
Crystal violet staining
An equal amount of approximately 7 × 10³–1.5 × 10⁴ HEK293 cells were seeded in each well of a 96 well plate including DMEM media (10% FBS, 1% P/S) with varying concentrations of glyphosate or H2O as a control. Crystal violet staining solution includes 0.1% w/v Crystal violet (Sigma), 1% formaldehyde, 1% methanol, and 1 × PBS. After 16 h of incubation of the cells, the media were removed, and the staining solution was applied to the cells for 20 m at room temperature. The 96 well plate including the staining samples was dipped into bucket of water with the water continuously running, and then was air-dried before taken pictures of and subjected to spectrophotometry analysis at 595 nm.
RT-qPCR
HEK293 cells were grown to 60–70% confluence before glyphosate was treated to the cells according to indicated concentrations for 24 h. The cells were washed with cold PBS and collected by scraping. Total RNAs were extracted from the cells using Qiagen RNeasy kit, and cDNAs were constructed from 600 ng of the collected RNAs using Reverse Transcription System (Promega, Japan). cDNA was analyzed through quantifying PCR using KOD FX Neo DNA Polymerase (Toyobo, Japan) according to the manufacturer’s instructions (PCR System, Bio-Rad). The primers used for the experiments are listed in Supplementary Information.
Mass spectrometry
Briefly, HEK293 cells grown in DMEM (10% FBS and 1% P/S) in 80–100% confluence in a 6 well plate were treated with glyphosate to a final concentration of 13.3 ng/µl (80 µM). The DMEM medium only without cells was treated with glyphosate side-by-side as a control. After the control and cells were incubated for 24 h with 5% CO2 supply at 37 degree, the media from the no-cell control and sample were collected and the debris was removed using centrifugation and filtration. To identify glyphosate and AMPA and measure their residual quantities in the media, tandem MSD (LC/MS 8030 plus, Shimadzu Co., Kyoto, Japan) based on ultra high-performance liquid chromatogram (UHPLC, Nexera UFLC, Shimadzu Co., Kyoto, Japan) and Hypercarb column (2.1 mm [I.D.] × 100 mm [L.], 3.0 µm; Thermo Scientific, USA) were used. Electrospray ionization (ESI) condition was optimized through multiple reaction monitoring (MRM) before analyzing the samples (Lehotay et al. Citation2010). Acetonitrile or water including 0.1% formic acid was utilized as mobile phase solvents. The control and sample were diluted to 1:10 before LC-MS-MS, and 20 ng/µl glyphosate and the same amount of AMPA were included to the measurement as references. From a precursor, two product ions with the most ideal sensitivity were selected: the first ions (63.10 m/z for glyphosate and 79.15 m/z for AMPA) for quantification and the second ions (150.05 m/z for glyphosate and 63.15 m/z for AMPA) for identification.
Author contributions
S.J. performed wound healing and crystal violet assays. H.B. carried out RT-qPCR experiments. J.R. and H.B. carried out ChIP-PCR analysis. J.-E.K. and S.-H.L. performed mass spectrometry. H.B. performed WST cell proliferation assay. H.B. designed the experiments and wrote the manuscript.
Availability of data and materials
All data and materials generated to conclude the findings of this study are included as additional files and available upon request.
Supplemental Material
Download PDF (1.9 MB)Acknowledgements
We appreciate the faculty members in the College of Agriculture and Life Sciences and the Department of Applied Biosciences at Kyungpook National University (KNU) for their support and interest in the manuscript. We thank J. Y. Jo, Y. H. Kim, M. Singh, and Bunch Lab members for technical assistance and B. W. Yun’s and J. H. Shin’s labs for sharing the equipment and technical support. H. B is grateful to S. J. Park, G. Hugenberger, J. Christ, John, and D. Bunch, for loving encouragement throughout the work.
Disclosure statement
No potential conflict of interest was reported by the authors.
Additional information
Funding
Related Research Data
References
- Abbas T, Dutta A. 2009. P21 in cancer: intricate networks and multiple activities. Nat Rev Cancer. 9:400–414. doi: https://doi.org/10.1038/nrc2657
- Akhtar A. 2015. The flaws and human harms of animal experimentation. Camb Q Healthc Ethics. 24:407–419. doi: https://doi.org/10.1017/S0963180115000079
- Alt JR, Gladden AB, Diehl JA. 2002. P21(Cip1) promotes cyclin D1 nuclear accumulation via direct inhibition of nuclear export. J Biol Chem. 277:8517–8523. doi: https://doi.org/10.1074/jbc.M108867200
- Baldin V, Lukas J, Marcote MJ, Pagano M, Draetta G. 1993. Cyclin D1 is a nuclear protein required for cell cycle progression in G1. Genes Dev. 7:812–821. doi: https://doi.org/10.1101/gad.7.5.812
- Barrett KA, McBride MB. 2005. Oxidative degradation of glyphosate and aminomethylphosphonate by manganese oxide. Environ Sci Technol. 39:9223–9228. doi: https://doi.org/10.1021/es051342d
- Belkaid Y, Hand TW. 2014. Role of the microbiota in immunity and inflammation. Cell. 157:121–141. doi: https://doi.org/10.1016/j.cell.2014.03.011
- Benbrook CM. 2016. Trends in glyphosate herbicide use in the United States and globally. Environ Sci Eur. 28:3. doi: https://doi.org/10.1186/s12302-016-0070-0
- Bunch H. 2016. Role of genome guardian proteins in transcriptional elongation. FEBS Lett. 590:1064–1075. doi: https://doi.org/10.1002/1873-3468.12152
- Bunch H. 2018. Gene regulation of mammalian long non-coding RNA. Mol Genet Genomics. 293:1–15. doi: https://doi.org/10.1007/s00438-017-1370-9
- Bunch H, Lawney BP, Lin YF, Asaithamby A, Murshid A, et al. 2015. Transcriptional elongation requires DNA break-induced signalling. Nat Commun. 6:10191. doi: https://doi.org/10.1038/ncomms10191
- Bunch H, Zheng X, Burkholder A, Dillon ST, Motola S, et al. 2014. TRIM28 regulates RNA polymerase II promoter-proximal pausing and pause release. Nat Struct Mol Biol. 21:876–883. doi: https://doi.org/10.1038/nsmb.2878
- Chamkasem N. 2017. Determination of glyphosate, Maleic Hydrazide, Fosetyl Aluminum, and Ethephon in Grapes by liquid chromatography/tandem mass spectrometry. J Agric Food Chem. 65:7535–7541. doi: https://doi.org/10.1021/acs.jafc.7b02419
- Conrad A, Schroter-Kermani C, Hoppe HW, Ruther M, Pieper S, et al. 2017. Glyphosate in German adults – time trend (2001 to 2015) of human exposure to a widely used herbicide. Int J Hyg Environ Health. 220:8–16. doi: https://doi.org/10.1016/j.ijheh.2016.09.016
- Cressey D. 2015. Widely used herbicide linked to cancer. Nature. doi:https://doi.org/10.1038/nature.2015.17181.
- Defarge N, Spiroux de Vendomois J, Seralini GE. 2018. Toxicity of formulants and heavy metals in glyphosate-based herbicides and other pesticides. Toxicol Rep. 5:156–163. doi: https://doi.org/10.1016/j.toxrep.2017.12.025
- Dominguez A, Brown GG, Sautter KD, de Oliveira CM, de Vasconcelos EC, et al. 2016. Toxicity of AMPA to the earthworm Eisenia andrei Bouche, 1972 in tropical artificial soil. Sci Rep. 6:19731. doi: https://doi.org/10.1038/srep19731
- Evrensel A, Ceylan ME. 2015. The gut-brain axis: The missing link in depression. Clin Psychopharmacol Neurosci. 13:239–244. doi: https://doi.org/10.9758/cpn.2015.13.3.239
- Feoktistova M, Geserick P, Leverkus M. 2016. Crystal violet assay for determining viability of cultured cells. Cold Spring Harb Protoc. pdb prot087379. doi:https://doi.org/10.1101/pdb.prot087379.
- Funke T, Han H, Healy-Fried ML, Fischer M, Schonbrunn E. 2006. Molecular basis for the herbicide resistance of Roundup ready crops. Proc Natl Acad Sci U S A. 103:13010–13015. doi: https://doi.org/10.1073/pnas.0603638103
- Gonzalez-Valenzuela LE, Dussan J. 2018. Molecular assessment of glyphosate-degradation pathway via sarcosine intermediate in Lysinibacillus sphaericus. Environ Sci Pollut Res Int. 25:22790–22796. doi: https://doi.org/10.1007/s11356-018-2364-9
- Hwang A, Maity A, McKenna WG, Muschel RJ. 1995. Cell cycle-dependent regulation of the cyclin B1 promoter. J Biol Chem. 270:28419–28424. doi: https://doi.org/10.1074/jbc.270.45.27058
- Jung JM, Bruner JM, Ruan S, Langford LA, Kyritsis AP, et al. 1995. Increased levels of p21WAF1/Cip1 in human brain tumors. Oncogene. 11:2021–2028.
- Kryuchkova YV, Burygin GL, Gogoleva NE, Gogolev YV, Chernyshova MP, et al. 2014. Isolation and characterization of a glyphosate-degrading rhizosphere strain, Enterobacter cloacae K7. Microbiol Res. 169:99–105. doi: https://doi.org/10.1016/j.micres.2013.03.002
- Kwiatkowska M, Reszka E, Wozniak K, Jablonska E, Michalowicz J, et al. 2017. DNA damage and methylation induced by glyphosate in human peripheral blood mononuclear cells (in vitro study). Food Chem Toxicol. 105:93–98. doi: https://doi.org/10.1016/j.fct.2017.03.051
- Langenfeld J, Kiyokawa H, Sekula D, Boyle J, Dmitrovsky E. 1997. Posttranslational regulation of cyclin D1 by retinoic acid: a chemoprevention mechanism. Proc Natl Acad Sci U S A. 94:12070–12074. doi: https://doi.org/10.1073/pnas.94.22.12070
- Lehotay SJ, Son KA, Kwon H, Koesukwiwat U, Fu W, et al. 2010. Comparison of QuEChERS sample preparation methods for the analysis of pesticide residues in fruits and vegetables. J Chromatogr A. 1217:2548–2560. doi: https://doi.org/10.1016/j.chroma.2010.01.044
- Li Q, Lambrechts MJ, Zhang Q, Liu S, Ge D, et al. 2013. Glyphosate and AMPA inhibit cancer cell growth through inhibiting intracellular glycine synthesis. Drug Des Devel Ther. 7:635–643.
- Macleod KF, Sherry N, Hannon G, Beach D, Tokino T, et al. 1995. p53-dependent and independent expression of p21 during cell growth, differentiation, and DNA damage. Genes Dev. 9:935–944. doi: https://doi.org/10.1101/gad.9.8.935
- Mattson MP. 2008. Hormesis defined. Ageing Res Rev. 7:1–7. doi: https://doi.org/10.1016/j.arr.2007.08.007
- Mertens M, Hoss S, Neumann G, Afzal J, Reichenbecher W. 2018. Glyphosate, a chelating agent-relevant for ecological risk assessment? Environ Sci Pollut Res Int. 25:5298–5317. doi: https://doi.org/10.1007/s11356-017-1080-1
- Mesnage R, Defarge N, Spiroux de Vendomois J, Seralini GE. 2014. Major pesticides are more toxic to human cells than their declared active principles. Biomed Res Int. 2014:179691. doi: https://doi.org/10.1155/2014/179691
- Muise-Helmericks RC, Grimes HL, Bellacosa A, Malstrom SE, Tsichlis PN, et al. 1998. Cyclin D expression is controlled post-transcriptionally via a phosphatidylinositol 3-kinase/Akt-dependent pathway. J Biol Chem. 273:29864–29872. doi: https://doi.org/10.1074/jbc.273.45.29864
- Parajuli KR, Zhang Q, Liu S, You Z. 2016. Aminomethylphosphonic acid inhibits growth and metastasis of human prostate cancer in an orthotopic xenograft mouse model. Oncotarget. 7:10616–10626.
- Peluso M, Munnia A, Bolognesi C, Parodi S. 1998. 32P-postlabeling detection of DNA adducts in mice treated with the herbicide Roundup. Environ Mol Mutagen. 31:55–59. doi: https://doi.org/10.1002/(SICI)1098-2280(1998)31:1<55::AID-EM8>3.0.CO;2-A
- Perlman RL. 2016. Mouse models of human disease: an evolutionary perspective. Evol Med Public Health. 2016:170–176.
- Selvaraj A, Prywes R. 2004. Expression profiling of serum inducible genes identifies a subset of SRF target genes that are MKL dependent. BMC Mol Biol. 5:13. doi: https://doi.org/10.1186/1471-2199-5-13
- Shehata AA, Schrodl W, Aldin AA, Hafez HM, Kruger M. 2013. The effect of glyphosate on potential pathogens and beneficial members of poultry microbiota in vitro. Curr Microbiol. 66:350–358. doi: https://doi.org/10.1007/s00284-012-0277-2
- Stur E, Aristizabal-Pachon AF, Peronni KC, Agostini LP, Waigel S, et al. 2019. Glyphosate-based herbicides at low doses affect canonical pathways in estrogen positive and negative breast cancer cell lines. PLoS One. 14:e0219610. doi: https://doi.org/10.1371/journal.pone.0219610
- Tarazona JV, Court-Marques D, Tiramani M, Reich H, Pfeil R, et al. 2017. Glyphosate toxicity and carcinogenicity: a review of the scientific basis of the European Union assessment and its differences with IARC. Arch Toxicol. 91:2723–2743. doi: https://doi.org/10.1007/s00204-017-1962-5
- Torretta V, Katsoyiannis I, Viotti P, Rada E. 2018. Critical review of the effects of glyphosate exposure to the environment and humans through the food supply chain. Sustainability. 10:950. doi: https://doi.org/10.3390/su10040950
- Wang Y, Hu SB, Wang MR, Yao RW, Wu D, et al. 2018. Genome-wide screening of NEAT1 regulators reveals cross-regulation between paraspeckles and mitochondria. Nat Cell Biol. 20:1145–1158. doi: https://doi.org/10.1038/s41556-018-0204-2
- West JA, Davis CP, Sunwoo H, Simon MD, Sadreyev RI, et al. 2014. The long noncoding RNAs NEAT1 and MALAT1 bind active chromatin sites. Mol Cell. 55:791–802. doi: https://doi.org/10.1016/j.molcel.2014.07.012