
Abstract
We proposed that autophagy activated through PPARγ in prostate cancer could protect cancer against androgen deprivation. Our MTT and western blotting assay results showed that mimics of miR-337-3p repressed autophagy flux under androgen deprivation, whereas inhibitors had the opposite effect. Neither mimics nor inhibitors influenced cell motility and invasion. miR-337-3p downregulated PPARγ expression in dual luciferase reporter assays and promoted AMPK phosphorylation. The overexpression of PPARγ or AMPK agonists partly diminished the adverse influence of mimics on proliferation and cell autophagy. In a mouse xenograft model, tumors transplanted with LNCap cells having a miR-337-3p deficiency had a significantly larger volume and lower rate of apoptosis than in controls after orchidectomy. Our findings showed that the negative effects of miR-337-3p on cell survival after androgen deprivation through PPARγ degeneration and modulated autophagy could serve as a novel therapeutic target for androgen-dependent prostate cancer and provide a strategy against resistance to anti-androgen therapy.
Introduction
Autophagy is the removal of damaged organelles by cell degradation and recycling; it is a cell survival mechanism that could promote the progression of prostate cancer (PCa) (Farrow et al. Citation2014; Blessing et al. Citation2017). Blessing et al. reported the importance of autophagy in the progression of PCa, demonstrated the mechanism of enhanced autophagy, and proposed that autophagy has potential for treating advanced PCa (Blessing et al. Citation2017). Many studies have indicated that pharmacologically suppressing autophagy with agents such as chloroquine and metformin, as well as the agents described herein, could enhance the cell-killing effect of cancer therapeutic agents (Qu et al. Citation2017; Yoshida Citation2017; Kotcherlakota et al. Citation2018).
The role of peroxisome proliferator activator receptor-gamma (PPARγ) in autophagy and endoplasmic stress is widely studied and PPARγ is associated with various types of cancers, including PCa (Farrow et al. Citation2014; Grada et al. Citation2017). The upregulation of PPARγ results in the increased expression of genes associated with autophagy including LC3B, Beclin-1, and Atg7, and the induction of autophagy by activating p-AMPK and suppressing p-mTOR. However, PPARγ and AMPK inhibitors could reverse these reactions (Wang et al. Citation2018). Previous studies have shown that several components (e.g. MCL) enhance the AMPK/mTOR-dependent expression of PPARγ (Zhong et al. Citation2017). A study on non-neoplastic diseases showed that telmisartan, a partial agonist of PPARγ and a target of NAD-dependent deacetylase (SIRT1), improved the sensitivity of insulin in obese db/db mice fed with a high-fat diet, decreased the size of hypertrophic pancreatic islets, and increased AMPK phosphorylation. Further, it showed that a relationship between increased AMPK phosphorylation and PPARγ activation in metabolic diseases might lead to the activation of autophagy-dependent upregulation of AMPK signaling (Shiota et al. Citation2012).
Therefore, we proposed that autophagy activated through PPARγ in PCa could protect cancer from androgen deprivation. We showed that PPARγ promoted autophagy in PCa cells through AMPK signaling after miR-337-3p inhibition and caused resistance to apoptosis under androgen deprivation. Our findings provide a novel target for the regulation of abnormally activated autophagy in PCa and might help to design novel strategies to treat hormone-resistant PCa.
Materials and methods
Xenograft experiments
The Animal Care Committee at the First Affiliated Hospital of University of South China approved the present study that included 15 six-week-old male BALB/c nude mice. Lymph node carcinoma of the prostate (LNCap) cells (1 × 10⁶) were transfected using an adenovirus vector containing miR-337-3p inhibitors or scramble controls (constructed by GeneChem Bio Tech, Shanghai, China), and injected into 8–10-week-old male immunodeficient mice after castration. Suspended prostate tumor cells (250 μL; 5 × 10⁵/mL) were subcutaneously injected into the mice using a 25 G needle and a 1-mL syringe. One week later, tumor volumes were measurable in only 10 mice (average volume, 11.6 mm3) and we also weighed the xenograft tumors in these mice. Thereafter, xenograft tissues were TUNEL stained in situ and the expression of apoptosis-related proteins was measured.
Cell culture
We incubated LNCap cells (ATCC, Manassas, VA, USA) in RPMI 1640 medium supplemented with 10% FBS (Invitrogen, Carlsbad, CA, USA), 100 µg/mL of streptomycin (Sigma) and 100 U/mL of penicillin (Sigma-Aldrich, St. Louis, MO, USA) at 37°C in an atmosphere containing 5% CO2. After reaching 80– 90% confluence, the cells were sub-cultured and used in experiments after two–three passages.
RNA extraction and qPCR
Total RNA was separated from LNCap cells and clinical tissue samples using TRIzol Reagent as described by the manufacturer and RNA was extracted from serum samples using Plasma/Serum Circulating and Exosomal RNA Purification Mini Kits (Norgen Biotek Corporation, Thorold, ON, Canada). We obtained 200–400 ng of RNA from ∼1 mL of serum. Total RNA was reverse transcribed to the corresponding cDNA using Superscript III reverse transcriptase with random hexamers (Invitrogen, Carlsbad, CA, USA) and reverse transcriptase PCR (RT–PCR). After the reverse transcription of mRNA and miRNA, quantitative real-time polymerase chain reaction (qRT-PCR) proceeded using SYBR Green PCR Master Mix, to analyze the expression of mRNA candidates. Table shows the sequences of the forward and reverse primers used to amplify specific genes. We also analyzed the miRNA-337-3p gene using RT–PCR. Briefly, total RNA was reverse transcribed to cDNA using TaqMan™ MicroRNA Reverse Transcription (Applied Biosystems, Waltham, MA, USA) and PrimeScript® mRNA cDNA synthesis kits (Takara Bio Inc., Tokyo, Japan), and qPCR for miRNA proceeded as described by the manufacturer. We confirmed cDNA amplification by PCR using SYBR Premix Ex TaqTM II, miR-337-3p, and the following U6-specific primers: miR-337-3p forward, 5′-CTGTGACACACTTATGCCTAACAGGAC-3′ and reverse, 5′-GTCATCCAAGACAGGCTTACATGCATC-3′; QINGKE Bio, (Guangzhou, China), and U6 forward (5′-CTCGCTTCGGCAGCACA)-3′ and reverse, 5′-AACGCTTCACGAATTTGCGT-3. Expression levels were normalized with GAPDH for mRNA and U6 for miRNA from tissue samples. Levels of miRNA in serum samples were determined using miR-16 as the endogenous control as described (Pan et al. Citation2017). The qRT-PCR data were analyzed using the 2-ΔΔCt formula. Results are presented as fold change over control values.
Table 1. The primers for the quantitative real-time PCR.
Patient and tissue specimens
The Medical Ethics Committee at the First Affiliated Hospital of the University of South China approved the study, and all involved patients provided written informed consent to participate. Serum and tumor tissue samples were collected from 252 patients with PCa and were divided into groups with high or low expression based on the median expression of miR-337-3p. The clinical samples were obtained from the First Affiliated Hospital of the University of South China, and patients who had progressed to advanced PCa or androgen-independent PCa were excluded from the study. The amount of miR-337-3p transcribed in serum and tissue samples was retrospectively analyzed using qPCR. Cryopreserved cancerous and normal prostate tissues specimens were also collected for qPCR and western blotting. Follow-up and patient data were collected from medical records and retrospectively assessed.
Luciferase assays
We amplified the 3′-UTR sequence of the human PPARγ gene from genomic DNA by PCR and cloned it into the psiCHECK vector downstream of the Renilla luciferase reporter gene using standard cloning protocols. Cloned inserts were verified by DNA sequencing. The luciferase vector carrying a fragment of 3′-UTR of PPARγ mRNA, which might contain miR-337-3p binding sites, was transfected into the cervical cancer cell line, SiHa, after nucleofection (Lonza Group AG, Basel, Switzerland) with oligo controls, a miR-337-3p mimic, or a negative control. The cells were lysed 2 days later, and the activities of Renilla and endogenous control firefly luciferases were determined using a Dual-Luciferase Reporter Assay System. Results were normalized to the activity of firefly luciferase and are presented as fold change over control.
Transfection
We used pcDEF3 vectors encoding human-PPARγ and GFP (Shanghai Jikai Gene Chemical Technology Co., Ltd., Shanghai, China) to overexpress PPARγ in the LNCap cell line. A scramble control (NC) was constructed by scrambling a sequence that was incapable of encoding a target gene. Transfection proceeded as described (Choi et al. Citation2016). Model LNCap cells (∼ 3,000/well) inoculated into 96-well plates were incubated at 37°C for 24 h, then transfected with the pcDEF3 vector for 10–12 h as described by the manufacturer. Cells emitting green fluorescence represented stable transfection with the adenoviral-mediated vector. Over 85% of the cells were detected by fluorescence microscopy, and our results confirmed that the scramble control and PPARγ overexpression had been established in the cell model.
TUNEL staining in situ
The mice with xenograft transplants were sacrificed after 28 days, then tumor samples were collected and embedded in paraffin. We followed the described protocols for immunofluorescence and TUNEL staining, and obtained fluorescence microscopy images (Lawrence et al. Citation2013) from which apoptotic scores were calculated based on the numbers of TUNEL-positive nuclei.
Prediction of target mRNA
We predicted an mRNA molecule that might have the potential to target degradation by miR-337-3p using the online miRanda tool and the TargetScan web server. Binding specificity and affinity between miR-337-3p and PPARγ mRNA were evaluated based on predictive scores and corresponding percentile ranks.
Transwell assays
We evaluated cell invasion using the HTS transwell-24 system. After culture in serum-free RPMI 1640 medium for 24 h, LNCap cells (5 × 10⁴ in 100 µL) were added to the serum-free upper chamber, and RPMI 1640 medium containing 10% FBS was added to the lower chamber. Cells tend to pass through the membrane from the upper, to the lower compartment, which allows estimates of cell migration and invasion ability. After an incubation at 37°C for 24 h, cells in the lower compartment were stained, fixed, and counted.
Western blotting
Total protein isolated from LNCap cells, clinical tissue samples and xenografts using RIPA lysis buffer were denatured in a water bath at high temperature. An equal amount of protein lysates separated by gel electrophoresis was transferred onto nitrocellulose (NC) membranes. Non-specific protein binding was blocked with 5% (w/v) dried skimmed milk in TBST at ∼25°C for 60 min, then proteins on the membranes were probed overnight at 4°C with primary anti-human PPARγ (1:3000), anti-caspase-3 (1:1000), anti-caspase-8 (1:1500), anti-AMPK (1:1000), anti-p-AMPK (1:1000), anti-mTORC1 (1:1000), anti-p-mTORC1 (1:1000), anti-LC3II (1:1000) and anti-LC3I (1:2000) and anti-GAPDH (1:2000) antibodies (all from Abcam Plc., Cambridge, UK). After three washes with 1× TBST, the membranes were incubated for 2 h with the corresponding secondary antibodies bound to horseradish peroxidase at room temperature. The internal control was GAPDH. After three washes with TBST, protein bands were detected via enhanced chemiluminescence (ECL).
Cell proliferation and migration assays
The proliferation of LNCap cell lines in vitro was measured using MTT assays as described by the manufacturer. Wound-healing was assayed in cell monolayers as described (Grada et al. Citation2017). In brief, LNCap cells were incubated in serum-free medium for 48 h. A linear wound was introduced at the center of a monolayer, followed by stimulating the cells with a high concentration of glucose for 24 h and dynamic observation for a further 24 h. Images were acquired using an IX 71 microscope (Olympus Corp., Tokyo Japan).
Statistical analysis
All experiments proceeded in parallel at least five times, and data are presented as means ± average standard error. Differences in statistics between two groups were measured using unpaired t-tests. Groups of three or more were compared using one-way repeated ANOVA. Different pairs of means in multiple comparisons among groups were determined using Student–Newman–Keuls tests. Statistical significance was taken at p < 0.05. Overall survival (OS) and progression-free survival (PFS) were respectively determined as the amount of elapsed time between diagnosis and cancer-related death, and that between surgery and the onset of recurrence. We determined cut-offs using Cutoff Finder, then Kaplan-Meier survival curves were created and analyzed using log-rank tests. All data were statistically analyzed using SPSS software.
Results
Higher serum miR-337-3p levels and miR-337-3p expression in carcinoma tissues might be associated with better 3-year PFS among patients with androgen receptor (AR)-positive PCa
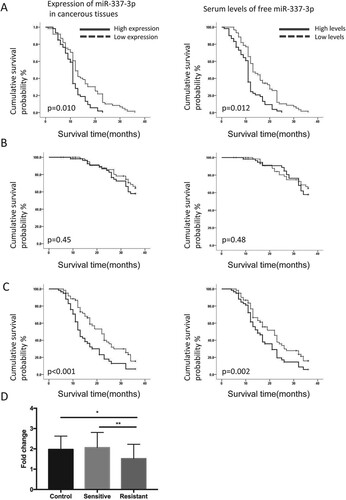
The effects of miR-337-3p expression on OS and PFS were investigated in patients with PCa, and then the patients were classified according to whether expression was above or below the median value of miR-337-3p expression. Patients with high levels of serum-free microRNA-337-3p or high microRNA-337-3p expression in AR-positive PCa progressed significantly more slowly to independent PCa than those with low levels of serum free miR-337-3p (Figure (A)). The expression and serum levels of miR-337-3p did not influence the 3-year OS rates in patients with AR-positive PCa (Figure (B)). However, the patients with higher miR-337-3p expression in PCa tissues or higher serum levels of miR-337-3p had significantly better PFS (Figure (C)). The expression of miR-337-3p was lower in androgen-resistant than in androgen-sensitive PCa and normal prostate tissues (Figure (D)). These clinical data implied that more miR-337-3p expression or higher levels of serum miR-337-3p could indicate better survival for patients with PCa. In addition, miR-337 might be involved in the regulation of cancer biology in hormone-dependent cancerous cells and associated with the transition from androgen-sensitive to androgen-resistant PCa.
Figure 1. Overall survival rate and time to androgen-independent prostate cancer in prostate cancer patients according to the expression or serum levels of miR-337-3p. (A) The time to androgen-independent prostate cancer in prostate cancer patients according to expression or serum levels of miR-337-3p. The left panel indicates a longer time to androgen-independent prostate cancer in patients with a higher expression of miR-337-3p in the cancer tissues than in those with a lower expression. The right panel indicates a longer time to androgen-independent prostate cancer in patients with higher serum levels of free miR-337-3p than in those with lower serum levels. (B) The similar 3-year overall survival rate in two groups of prostate cancer patients according to the expression (left) or serum levels of miR-337-3p (right). (C) The 3-year progression-free survival in prostate cancer patients with higher expression (left) or higher levels of serum-free miR-337-3p compared with that in the other group (right). (D) The expression of miR-337-3p measured by quantitative real-time PCR in the cancer tissues from androgen-sensitive (n = 33) and androgen-resistant (n = 27) prostate cancer patients. Survival curve and Log-rank test were used for the statistical description and analysis. In each group for survival analysis, n = 65. P < 0.05 indicate statistical significance.
Mimics of miR-337-3p repressed proliferation and promoted apoptosis after androgen deprivation in androgen-dependent LNCap cells
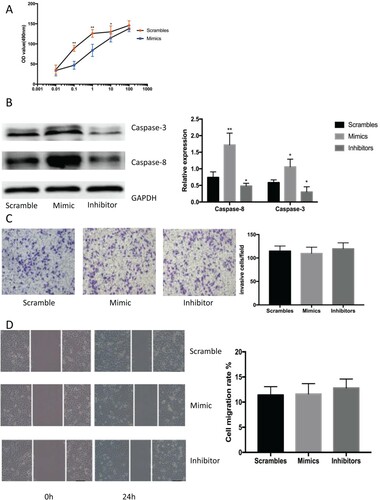
We transfected LNCap cells with miR-337-3p mimics, inhibitors, and scramble controls to determine whether mimicking miR-337-3p could repress malignant biological behavior in an androgen-dependent PCa cell line. The results showed that the mimics significantly repressed the proliferation of androgen-sensitive LNCap cells incubated with 0.1, 1, 10, and 100 nM androgen (Figure (A)). Western blotting showed that the mimics significantly promoted the expression of apoptotic caspase-3 and −8 proteins in androgen-deprived LNCap cells (Figure (B)). In contrast, miR-337-3p had the reverse effect on cellular proliferation and apoptosis in androgen-deprived LNCap cells. However, mimics and inhibitors did not influence invasion and metastasis in LNCap cells (Figure (C and D)). These findings showed that exogenously delivered miR-337-3p attenuated cellular proliferation and promoted apoptosis in androgen-dependent PCa cells deprived of androgen in vitro. Thus, miR-337-3p might regulate cell growth under exogenous androgen stimulation.
Figure 2. The mimics or inhibitors of miR-337-3p influence cellular proliferation and apoptosis. (A). Results of the MTT assay showing cell growth and viability under stimulation by different androgen concentrations as measured by optical density (OD) at 490 nm. Repeated measurement analysis of variance was used for statistical analysis. (B) The expression of apoptotic proteins measured using western blot in LNCap cells after treatment with mimics or inhibitors of miR-337-3p. The mimics significantly promoted the expression of caspase-3 and caspase-8 after androgen deprivation. (C) The results of transwell assays in LNCap cells after treatment with mimics or inhibitors of miR-337-3p. (D) The results of wound healing test in LNCap cells after treatment with mimics or inhibitors of miR-337-3p. Student’s t-test was used for the statistical analysis for graphs B–D. P < 0.05 indicates statistical significance. *p < 0.05 and **P < 0.01 vs. scramble control. All in vitro experiments were repeated five times to exclude occasionality.
Mimics of miR-337-3p inhibited cell survival by targeting PPARγ degeneration
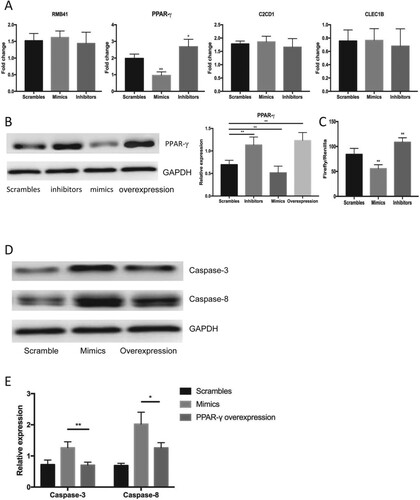
An miRNA exerts biological effects by the targeted degeneration of a specific mRNA and the subsequent downregulation of a target gene that plays a vital role in the physiological process and pathogenesis of various diseases. We predicted the plausible mRNA target molecule of miR-337-3p using data from the open predictive tools miRase and TargetScan online, and found four overlapping mRNA molecules PPARγ, RMB41, CLEC1B, and C2CD1 in both. Our qRT-PCR and western blotting results notably showed that only PPARγ expression was significantly reduced by the mimics and that miR-337-3p inhibitors significantly increased PPARγ expression (Figure (A)). Changes in PPARγ expression in the presence of specific mimics, inhibitors and an overexpressing plasmid were determined by western blotting. The expression of PPARγ was significantly increased in cells incubated with the inhibitors and the overexpressing plasmid, but decreased in those incubated with the mimics (Figure (B)). Furthermore, dual luciferase reporter assays revealed that transfection with mimics decreased luciferase gene activity, suggesting that the miR-337-3p mimics targeted PPARγ degeneration (Figure (C)). Transfection with plasmids overexpressing PPARγ partly diminished the promotion of apoptosis in androgen-deprived LNCaP cells because the expression of apoptotic proteins decreased (Figure (D and E)). These data showed that miR-337-3p mimics could silence PPARγ transcription and that inhibiting PPARγ might be vital to the promotion of apoptosis in androgen-deprived LNCap cells.
Figure 3. The target degeneration of PPARγ by miR-337-3p. (A) The identification of decreased expression of PPARγ after administration of mimics among all nominated genes with a decreased expression after treatment with mimics according to bioinformatic prediction. (B) The expression of PPARγ after administration of miR-337-3p scrambles, mimics, inhibitors and overexpression plasmids of PPARγ. (C) The results of dual luciferase reporter assays in the LNCap cells under the administration of mimics and inhibitors of miRNA-337-3p. The ratio of Firefly’s enzymatic activities to background value was used for the measurement of luciferase activities. (D and E) The representative immunoblot figures (D) and quantitative analysis (E) on the expression of apoptotic proteins measured by immunoblot assays under the administration of scramble controls, mimics, and mimics in combination with PPARγ overexpressing plasmid. Student’s t-test was used for the statistical analysis. P < 0.05 indicates statistical significance. *p < 0.05 and **P < 0.01 vs. scramble control. All in vitro experiments were repeated five times to exclude occasionality.
Decreased PPARγ expression is associated with decreased AMPK phosphorylation and autophagy flux suppression under androgen deprivation
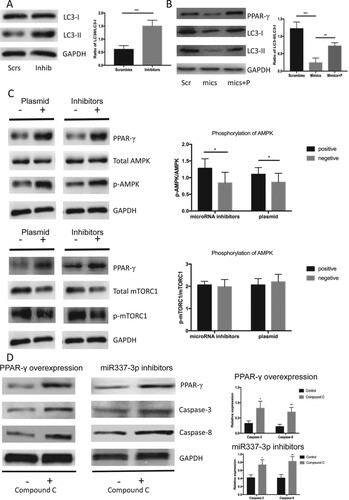
Autophagy has attracted attention in terms of cell survival under adverse conditions, including hypoxia, energy deficiency, and malnutrition. We postulated that autophagy is crucial to apoptosis resistance in androgen-dependent PCa cells deprived of androgen. Reports indicate that PPARγ can promote AMPK phosphorylation and activate downstream autophagy. We found a significant increase in LC3-II expression and a higher ratio of LC3-II to LC3-I in androgen-deprived LNCap cells incubated with miR-337-3p inhibitors (Figure (A)). The overexpression of PPARγ by the plasmid also enhanced LC3-II expression, and the mimics increased the ratio of LC3-II to LC3-I in androgen-deprived LNCap cells (Figure (B)). The phosphorylation of AMPK was increased regardless of the overexpressing plasmid or inhibitors that significantly increased PPARγ expression (Figure (C)). Furthermore, the inhibitors and the overexpressing plasmid did not significantly alter mTORC1 phosphorylation (Figure (D)). An AMPK inhibitor compensated for the inhibition of apoptosis caused by miR-337-3p inhibitors and the overexpressing plasmid (Figure (E)). Thus, PPARγ promoted cell survival through increased autophagy-dependent AMPK phosphorylation signaling in androgen-deprived LNCap cells.
Figure 4. miR-337-3p inhibitor promoted autophagy through the AMPK signaling. (A) miR-337-3p inhibitor promoted the expression of LC3-II and led to a higher ratio of LC3-II to LC3-I in the LNCap cells. (B) miR-337-3p mimics inhibited the expression of PPARγ and LC3-II, leading to a lower ratio of LC3-II to LC3-I in the LNCap cells, but the overexpression of PPARγ reversed the inhibition of autophagy. (C) The inhibition of miR-337-3p or overexpression of PPARγ promoted the expression of PPARγ and phosphorylation of AMPK but did not influence the phosphorylation of mTORC1 in the LNCap cells. (D) The compound C (AMPK inhibitor) aggravated the apoptosis after administration of inhibitors or overexpression of PPARγ in the LNCap cells. Student’s t-test was used for the statistical analysis. P < 0.05 indicates statistical significance. *p < 0.05 and **P < 0.01 vs. scramble control. All in-vitro experiments were repeated five times to exclude occasionality.
Volume was smaller and apoptosis rates lower compared with controls in a xenograft deficient in miR-337-3p
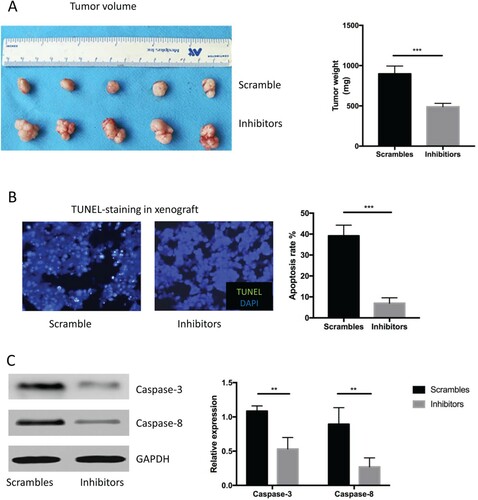
We transplanted mice with PCa cells to create a xenograft mouse model in vivo. The tumor volume of the xenograft administered with an miR-337-3p inhibitor containing an adenovirus vector sequence was larger than that of controls even after castration (Figure (A and B)). Fewer TUNEL-positive cells were found in the xenograft administered with an adenovirus vector containing an miR-337-3p sequence inhibitor after castration (Figure (C)), and western blot findings were consistent with these (Figure (D)), indicating that the expression of apoptosis-related proteins was decreased. In brief, the data provided evidence that anti-androgen therapeutic effects in vivo might hinge on the expression of some non-coding small RNA molecules and perhaps other potential transcription regulators, which control responses or resistance to an androgen excess and deficiency in transplanted prostate tumor cells.
Figure 5. miR-337-3p inhibitor resulted in larger tumor volume in the in vivo xenograft experiments. (A) Representative figures of tumor volume and quantitative analysis of tumor weight in the xenograft with an adenovirus vector expressing miR-337-3p inhibitors or controls. (B) Representative figures and semi-quantitative analysis of TUNEL staining in the xenograft. (C) The expression of caspase-3 and caspase-8. Student’s t-test was used for the statistical analysis. P < 0.05 indicates statistical significance. *p < 0.05 and **P < 0.01 vs. scramble control. All in vitro experiments were repeated five times to exclude occasionality.
Discussion
The dysregulation of PPARα and PPARγ would result in a change of autophagy flux in metabolic stress. Li et al. reported that the expression of proteins related to autophagy, cathepsin D, LC3-II, and Beclin-1, increases in an animal model of spinal cord injury. Rosiglitazone (an agonist of PPARγ) downregulates the expression of proteins associated with autophagy and improves locomotor function, which could be antagonized by GW9662, a PPARγ inhibitor (Li et al. Citation2017). Xu et al. also found that 15d-PGJ(2), a PPARγ agonist, decreases the expression of proteins associated with autophagy in the ischemic cortex in cerebral ischemia-reperfusion injury (Xu et al. Citation2013). These findings indicated that 15d-PGJ(2) inhibits neuronal autophagy after cerebral I/R injury to protect neurons. Isorhamnetin improves acute fulminant hepatitis induced by concanavalin A (ConA) via the P38/PPARα pathway, thus inhibiting the expression of proteins associated with apoptosis and autophagy (Lu et al. Citation2018). However, the present findings of androgen-deprived PCa cells led to a contradictory conclusion. Initially, PPARγ was regarded as a tumor-inhibitory factor that inhibits the growth of PCa cells (Ouyang et al. Citation2006). However, others have found that PPARγ agonists inhibit tumor cell growth independently of PPARγ (Yan S et al. Citation2014; Tao et al. Citation2018), which might be attributed to autophagy regulation. Furthermore, more PPARγ is expressed in advanced PCa than in low-risk PCa tissues and specimens of benign prostate hyperplasia, suggesting that PPARγ is not a tumor-inhibitory factor but might rather function in PCa progression. If so, PPARγ inhibition might help to prevent and treat PCa. These data indicated that PPARγ inhibition could promote autophagy in PCa. Moreover, PPARγ is associated with the progression of PCa in clinical practice, which might be attributed to increased autophagy under androgen deprivation as shown herein.
The mechanisms underlying the relationship between AR inhibition and autophagy remain elusive; however, AMPK and mTORC1 might play vital roles in the regulation of autophagy (Carroll and Dunlop Citation2017; Yan Q et al. Citation2017). Here, we found that the decrease in autophagy is not dependent on PPARγ degeneration caused by miR-337-3p and is instead associated with a change in AMPK phosphorylation after androgen deprivation. Further, miR-337-3p decreased AMPK phosphorylation, which is associated with the downregulation of autophagy. These findings indicated that AMPK, rather than mTORC1 signaling, plays an important role in the regulation of autophagy in androgen-deprived PCa cells. Androgen withdrawal prevents angiogenesis and the resultant nutrient deprivation and hypoxia further stimulate autophagy, which might lead to increased disease severity as a compensating mechanism to protect against cell death under adversity imposed by deficiencies of nutrition, oxygen, and androgen (Ambrosio et al. Citation2015; Murakami et al. Citation2018).
Considering that androgens and ARs are valuable targets of PCa treatment, and that their therapeutic benefit is somewhat limited by autophagy, our preliminary studies suggest that autophagy modulation might further improve malignant biological behavior, such as apoptosis and tumor growth, but have no influence on invasion and metastasis (Culig and Santer Citation2014; Olson et al. Citation2017).
Our results indicate that miR-337-3p mainly promotes apoptosis and cell growth inhibition under androgen deprivation in castrated animals in vivo and in vitro by simulating clinical anti-androgen therapies. The downregulation of autophagy indeed promoted apoptosis in the absence of androgen stimulation. Therefore, we propose that autophagy could protect PCa cells from androgen deprivation and subsequent apoptosis and provide a potential therapeutic strategy for PCa that is insensitive to anti-androgen.
Disclosure statement
No potential conflict of interest was reported by the author(s).
Data availability statement
The datasets used and/or analyzed during the current study are available from the corresponding author on reasonable request.
References
- Ambrosio MR, Rocca BJ, Barone A, Ginori A, Crivelli F, Pirtoli L, Del Vecchio MT. 2015. Lymphatic vascularization in prostate adenocarcinoma: correlation with tumor grade, androgen withdrawal and prognosis. Anticancer Res. 35(10):5595–5600.
- Blessing AM, Rajapakshe K, Reddy Bollu L, Shi Y, White MA, Pham AH, Lin C, Jonsson P, Cortes CJ, Cheung E, et al. 2017. Transcriptional regulation of core autophagy and lysosomal genes by the androgen receptor promotes prostate cancer progression. Autophagy. 13(3):506–521. doi: https://doi.org/10.1080/15548627.2016.1268300
- Carroll B, Dunlop EA. 2017. The lysosome: a crucial hub for AMPK and mTORC1 signalling. Biochem J. 474(9):1453–1466. doi: https://doi.org/10.1042/BCJ20160780
- Choi KW, Suh H, Oh HL, Ryou C, Lee CH. 2016. p21CIP1 induces apoptosis via binding to BCL2 in LNCaP prostate cancer cells treated with MCS-C3, a novel carbocyclic analog of pyrrolopyrimidine. Anticancer Res. 36(1):213–220.
- Culig Z, Santer FR. 2014. Androgen receptor signaling in prostate cancer. Cancer Metastasis Rev. 33(2-3):413–427. doi: https://doi.org/10.1007/s10555-013-9474-0
- Farrow JM, Yang JC, Evans CP. 2014. Autophagy as a modulator and target in prostate cancer. Nat Rev Urol. 11(9):508–516. doi: https://doi.org/10.1038/nrurol.2014.196
- Grada A, Otero-Vinas M, Prieto-Castrillo F, Obagi Z, Falanga V. 2017. Research techniques made simple: analysis of collective cell migration using the wound healing assay. J Invest Dermatol. 137(2):e11–e16. doi: https://doi.org/10.1016/j.jid.2016.11.020
- Kotcherlakota R, Rahaman ST, Patra CR. 2018. Nanomedicine for cancer therapy using autophagy: an overview. Curr Top Med Chem. 18(30):2599–2613. doi: https://doi.org/10.2174/1568026619666181224104838
- Lawrence MD, Blyth BJ, Ormsby RJ, Tilley WD, Sykes PJ. 2013. False-positive TUNEL staining observed in SV40 based transgenic murine prostate cancer models. Transgenic Res. 22(5):1037–1047. doi: https://doi.org/10.1007/s11248-013-9694-7
- Li H, Zhang Q, Yang X, Wang L. 2017. PPAR-gamma agonist rosiglitazone reduces autophagy and promotes functional recovery in experimental traumaticspinal cord injury. Neurosci Lett. 650:89–96. doi: https://doi.org/10.1016/j.neulet.2017.02.075
- Lu X, Liu T, Chen K, Xia Y, Dai W, Xu S, Xu L, Wang F, Wu L, Li J, et al. 2018. Isorhamnetin: A hepatoprotective flavonoid inhibits apoptosis and autophagy via P38/PPAR-alpha pathway in mice. Biomed Pharmacother. 103:800–811. doi: https://doi.org/10.1016/j.biopha.2018.04.016
- Murakami T, Obata H, Akitake N, Shiota M, Takeuchi A, Kashiwagi E, Inokuchi J, Tatsugami K, Eto M. 2018. Prognostic and predictive Factors for anti-androgen withdrawal in castration-resistant prostate cancer. Anticancer Res. 38(7):4115–4121. doi: https://doi.org/10.21873/anticanres.12702
- Olson BM, Gamat M, Seliski J, Sawicki T, Jeffery J, Ellis L, Drake CG, Weichert J, McNeel DG. 2017. Prostate cancer cells express more Androgen Receptor (AR) following androgen deprivation, improving recognition by AR-specific T cells. Cancer Immunol Res. 5(12):1074–1085. doi: https://doi.org/10.1158/2326-6066.CIR-16-0390
- Ouyang N, Williams JL, Rigas B. 2006. NO-donating aspirin isomers downregulate peroxisome proliferator-activated receptor (PPAR)delta expression in APC(min/+) mice proportionally to their tumor inhibitory effect: Implications for the role of PPARdelta in carcinogenesis. Carcinogenesis. 27(2):232–239. doi: https://doi.org/10.1093/carcin/bgi221
- Pan X, Murashov AK, Stellwag EJ, Zhang B. 2017. Using quantitative real-time PCR to detect microRNA expression profile during embryonic stem cell differentiation. Methods Mol Biol. 1622:255–265. doi: https://doi.org/10.1007/978-1-4939-7108-4_18
- Qu X, Sheng J, Shen L, Su J, Xu Y, Xie Q, Wu Y, Zhang X, Sun L. 2017. Autophagy inhibitor chloroquine increases sensitivity to cisplatin in QBC939 cholangiocarcinoma cells by mitochondrial ROS. PLoS One. 12(3):e0173712. doi: https://doi.org/10.1371/journal.pone.0173712
- Shiota A, Shimabukuro M, Fukuda D, Soeki T, Sato H, Uematsu E, Hirata Y, Kurobe H, Maeda N, Sakaue H, et al. 2012. Telmisartan ameliorates insulin sensitivity by activating the AMPK/SIRT1 pathway in skeletal muscle of obese db/db mice. Cardiovasc Diabetol. 11:139. doi: https://doi.org/10.1186/1475-2840-11-139
- Tao T, Zhao F, Xuan Q, Shen Z, Xiao J, Shen Q. 2018. Fenofibrate inhibits the growth of prostate cancer through regulating autophagy and endoplasmic reticulum stress. Biochem Biophys Res Commun. 503(4):2685–2689. doi: https://doi.org/10.1016/j.bbrc.2018.08.024
- Wang L, Yin Y, Hou G, Kang J, Wang Q. 2018. Peroxisome proliferator-activated receptor (PPARgamma) plays a protective role in cigarette smoking-induced inflammation via AMP-activated protein kinase (AMPK) signaling. Med Sci Monit. 24:5168–5177. doi: https://doi.org/10.12659/MSM.909285
- Xu F, Li J, Ni W, Shen YW, Zhang XP, Mohanraj R. 2013. Peroxisome proliferator-activated receptor-gamma agonist 15d-prostaglandin J2 mediates neuronal autophagy after cerebral ischemia-reperfusion injury. PLoS One. 8(1):e55080. doi: https://doi.org/10.1371/journal.pone.0055080
- Yan Q, Han C, Wang G, Waddington JL, Zheng L, Zhen X. 2017. Activation of AMPK/mTORC1-mediated autophagy by metformin reverses Clk1 deficiency-sensitized dopaminergic neuronal death. Mol Pharmacol. 92(6):640–652. doi: https://doi.org/10.1124/mol.117.109512
- Yan S, Yang X, Chen T, Xi Z, Jiang X. 2014. The PPARgamma agonist troglitazone induces autophagy, apoptosis and necroptosis in bladder cancer cells. Cancer Gene Ther. 21(5):188–193. doi: https://doi.org/10.1038/cgt.2014.16
- Yoshida GJ. 2017. Therapeutic strategies of drug repositioning targeting autophagy to induce cancer cell death: from pathophysiology to treatment. J Hematol Oncol. 10(1):67. doi: https://doi.org/10.1186/s13045-017-0436-9
- Zhong J, Gong W, Lu L, Chen J, Lu Z, Li H, Liu W, Liu Y, Wang M, Hu R, et al. 2017. Irbesartan ameliorates hyperlipidemia and liver steatosis in type 2 diabetic db/db mice via stimulating PPAR-gamma, AMPK/Akt/mTOR signaling and autophagy. Int Immunopharmacol. 42:176–184. doi: https://doi.org/10.1016/j.intimp.2016.11.015