
 ?Mathematical formulae have been encoded as MathML and are displayed in this HTML version using MathJax in order to improve their display. Uncheck the box to turn MathJax off. This feature requires Javascript. Click on a formula to zoom.
ABSTRACT
Hardy-Weinberg equilibrium is the study of the distribution of allelic and genotypic frequencies in a population. The objective of this study is to evaluate the allelic and genotypic frequency of different qualitative traits of men and women in Punjab, Pakistan. A total of 909 individuals were recruited for this study. In population, the frequency order of the blood group is B > O > A > AB and the same in both males and females. Rh-positive is more elevated (86.03%) than the negative (13.97%) in the whole population. Tongue rolling ability is higher in both males (58.92%) and females (61.46%). The presence of free earlobe (71.29%) and straight hairs (52.81%) is more in the whole population. Straight hair is more common in the population than the wavy (30.14%) and curly (17.05%), the male and female order is the same as in the whole population. In the whole population, the ear lobe is non-significant but other traits are significant. This study indicated that the alleles for the ear lobe are in equilibrium in the population, based on a Mendelian ratio. Hence, only the ear lobe follow the Mendelian ratio in the population of Punjab, Pakistan.
Introduction
The discovery of Mendel’s law of segregation and independent assortment has led to the foundation of population genetics. In 1908, British mathematician Godfrey H. Hardy and German physician Wilhelm Weinberg independently discovered the relationship between gene and genotype frequencies, known as the Hardy-Weinberg (HW) principle, or HW equilibrium. HW principle has become a powerful research tool in both theoretical and applied research in population and quantitative genetics (Chen, Citation2010). A population is a set of organisms that belongs to the same species, live in a specific environment, affect each other and by mating, give fertile offsprings (Jankowska et al., Citation2011). Population genetics refers to the study of the distribution of genes or alleles in a population. It also refers to a study of the evolutionary changes within and between the ethnic groups (Milgroom, Citation2015; Grunwald et al., Citation2017).
HW Principle (Hartl and Clarke, Citation2007) which formally states that: ‘If a genetic population is such that (1) organisms are diploid, (2) sexual reproduction, (3) generations do not overlap, (4) mating is random, (5) population size is significantly large, (6) allele frequencies are equal in the sexes, and (7) there is no migration, mutation, or selection, then the genotype frequencies in the population are given by weighted products of the allele frequencies. In the case of the one locus, two allele system have allele frequencies [(A, a) or (p, q)] give directly the genotype frequencies (AA, aa, Aa) p2 + q2 + 2pq = 1 (Bosco et al., Citation2012). But deviation from the Hardy-Weinberg equilibrium itself strongly suggests that at least one of the assumptions is violated (Chen, Citation2010).
Blood is the most important fluid for the transport of nutrients, hormones, and oxygen to the whole body (Cavalli-forza and Feldman, Citation2003). Before 1900, it was thought that all blood was the same. This misconception causes fetal transfusion. After the discovery of ABO blood type in 1901 by Karl Landsteiner and AB blood type in 1902 by Adriano Sturli and Alfred von Decastello, people led to know that human blood is not the same. People have different blood groups depending upon the surface markers (antigen) found on the membrane of red blood cells (Dean, Citation2005). The antigen for the ABO blood group is a complex carbohydrate (oligosaccharides) and rhesus (Rh) factor is protein in nature (Dean, Citation2005). ABO blood type is an example of multiple allelism and the allele for A and B is co-dominant over O (Pasha et al., Citation2009). It was reported that the alleles for ABO blood type are present on chromosome 9 controlling four different phenotypes A, B, AB, and O while Rh factor which is governed by allele D and d present on chromosome number 1 have two phenotypes, positive (with antigen D) and negative (without antigen D). These both the ABO blood group and Rh factor have antigenic property on the surface of the membrane of red blood cells (Alimba et al., Citation2010).
Tongue rolling is the tendency to turn up the lateral edges of the tongue and it is due to the single dominant gene (Liu and Hsu, Citation1949). However, according to Tahir et al. (Citation2014), tongue rolling might have a non-genetic character or may be controlled by multiple genes. Attached or free ear lobes are two possible phenotypes governed by a single gene. A person having a homozygous dominant and heterozygous genotype possesses a free ear lobe while homozygous recessive genotype possesses the attached ear lobe (Monheit, Citation2012). However other factors such as sexual and age effect the length of the earlobes (Azaria et al., Citation2003).
Hair morphology is a qualitative trait and a detectable feature of a human for the study of population genetics. It has three phenotypes, straight, wavy and curliness and the composition of hair is keratin protein. Hair has three internal structure cuticle, cortex, and medulla. The investigation showed that there are three types of cells in the cortex region of hair namely orthocortex, mesocortex and paracortex. As the curly nature of hair increases, the mesocortical cells decrease while in straight hair mesocortical macrofibrils have more in concentration (Thibaut et al., Citation2007).
Dimples on the cheek can be unilaterally (on one side) or bilaterally (on both sides). It is an indentation of muscles on the cheeks. Dimples are a dominant trait that transfers to the next generation is only due to a single gene (Kosif, Citation2015). In some people, dimples last only until adolescence, while this trait is a lifetime for some people (Omotoso et al., Citation2010). In 2009, Starr indicates facial dimples are inherited as autosomal dominant traits and one copy of a dominant gene is sufficient to cause dimples. People having both recessive genes lack the ability to express the dimples on the cheeks (Starr, Citation2009). The present study will help us to ensure the demand and supply of blood. Further, different morphogenetic characters can help to sort out the inheritance pattern of the population. It has been assumed that with the passage of time human undergoes evolutionary changes. So, the present study will give us a clue about evolution, human diversity and taxonomy. The objective of this study is to evaluate the allelic and genotypic frequency of Blood Groups, Rhesus (Rh) factor, Tongue rolling, Earlobe, Nature of hair and Dimple in Punjab, Pakistan.
Materials and methods
A total of 909 individuals were randomly selected containing male and female in 538 (59.19%) and 371(40.81%) proportion. The study carried out at the University of Agriculture Faisalabad, Punjab, Pakistan. This study used a descriptive research design. The data was collected by morphological observations of different traits shown in Table . The target populations for this study belong to different cities of Punjab in Pakistan as shown in Figure .
Figure 1. Data collected from areas in Punjab, Pakistan.
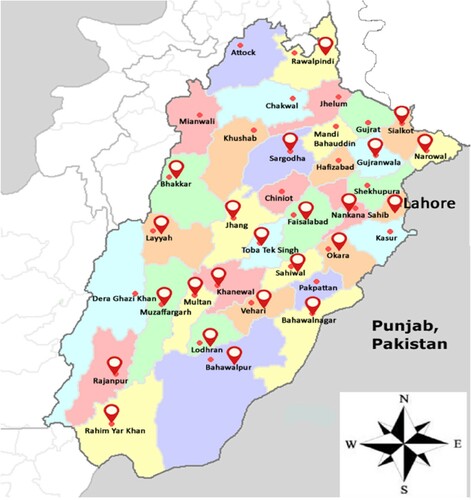
Table 1. Observed characters and traits in individuals.
The individuals were randomly selected, total 909 in which males 538 (59.19%) and female 371(40.81%) had ages ranged from 4 to 70 years for the study. The allele frequency of a recessive and dominant allele is calculated by using the following equations (Figures –).
Data are analyzed from goodness-of-fit X2 tests at a 95% confidence interval by using the following equation.
The mendelian ratio is used for calculating the expected value of the chi-square test. In diallelic, the expected mendelian phenotypic ratio is 3:1 for complete dominance and 1:2:1 for incomplete dominance while in triallelic, the expected phenotypic ratio 3:3:2:1 is used to estimate the expected value in chi-square. (Table ).
Blood group: Blood group is controlled by multiple alleles. Allele IA has antigen ‘A’, allele IB has antigen ‘B’ while allele ‘i’ does not have an ?>antigen on Red Blood Cells (RBCs). A person with ?>genotype IA IA, IAi have blood group A; IA IB for blood group AB; IB IB, IBi for blood group B and ii for O blood group.
Rh factor: Two different alleles for Rh factor know as Rh+ and Rh-. Rh+ individual has Rh antigen on RBCs and Rh – individual does not have.
Tongue rolling: The ability to turn up the lateral edges of the tongue is due to the single dominant gene (Liu and Hsu, Citation1949).
Earlobe: Ear lobes may be attached or free in an individual. The attached ear lobe is controlled by a recessive gene while free ear lobe is controlled by a dominant gene (Ebeye et al., Citation2014).
Hair nature: It is assumed that hair straightness and curliness is control by a single pair of alleles showing partial dominance. An individual with curly hair possesses homozygous dominant allele (IsIs) and straight hair is governed by a homozygous recessive allele (IcIc). An individual with wavy hair has a heterozygous (IsIc) genotype.
Dimples: Dimples is a depression in the cheeks. It is inherited as an autosomal dominant trait (Ebeye et al., Citation2014).
Figure 2. Rolling Tongue.
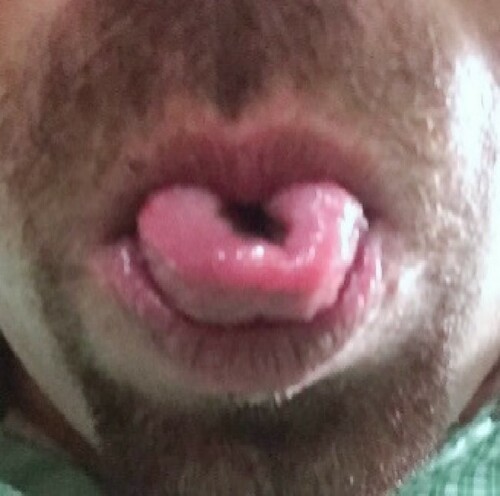
Figure 3. Non-Rolling Tongue
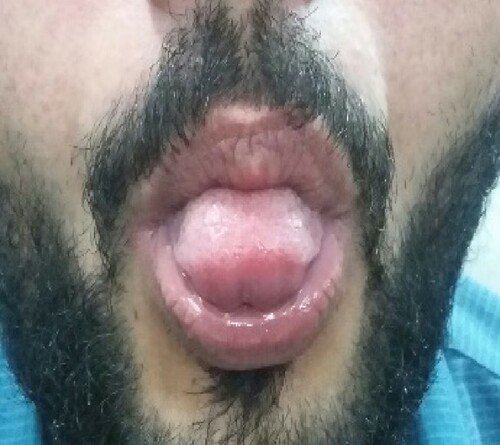
Figure 4. Attach Earlobe.
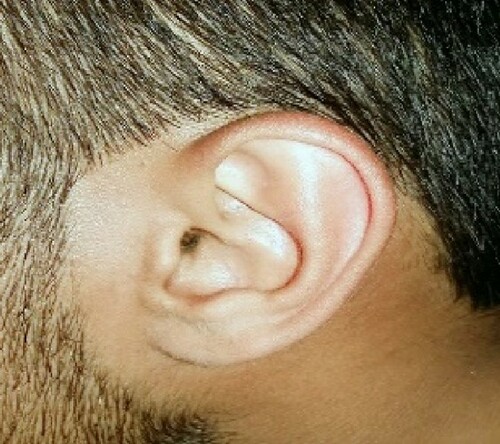
Figure 5. Free Earlobe.
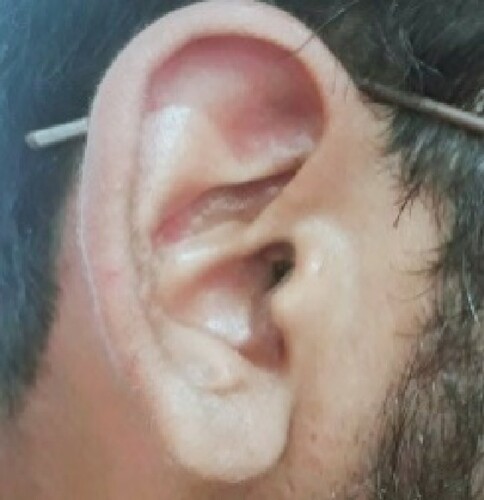
Figure 6. Straight Hair.

Figure 7. Wavy Hair.
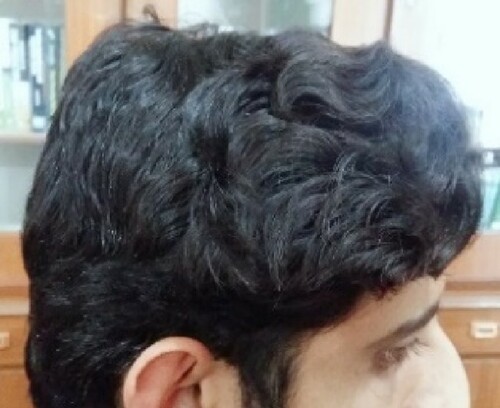
Figure 8. Curling Hair.
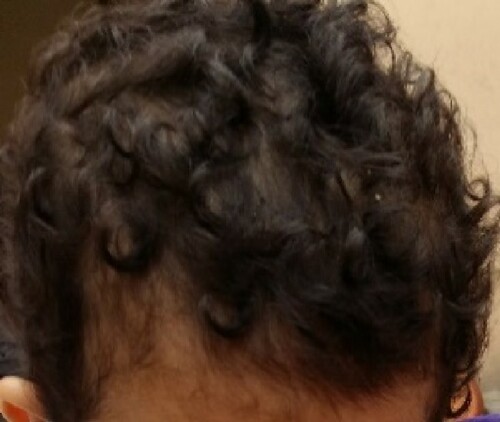
Figure 9. Dimple present.
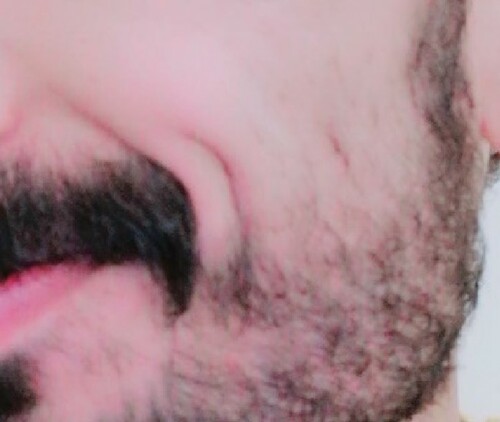
Figure 10. Dimple Absent.

Figure 11. Sample size in percentage originated from different cities of Punjab. Other cities include Bahawalnagar, Bahawalpur, Bhakkar, Burewala, Layyah, Lodhran, Muzaffargarh, Narowal, Okara, Rahim Yar Khan, Rajanpur, Sahiwal, Toba Tek Singh, Vehari and Nankana sahib.
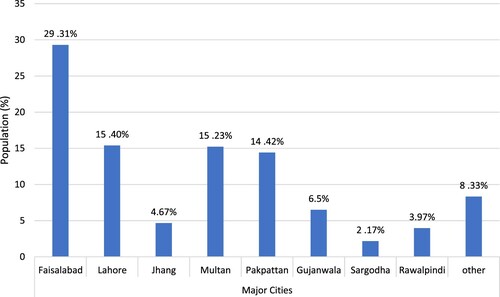
Table 2. Calculating the expected Mendelian phenotypic ratio for triallelic and diallelic characters in population.
Table 3. Percentage of different traits in population, males and females.
Table 4. Chi-square analysis and Allelic frequency of different traits of human characters in the whole population.
Table 5. Chi-square analysis and Allelic frequency of different traits of human characters in males.
Table 6. Chi-square analysis and Allelic frequency of different traits of human characters in females.
Results
The frequency of blood group ‘B’ (38.28%) is the most commonly present in the population followed by group ‘O’ (27.61%), group ‘A’ (24.75%), and ‘AB’ group have the least frequency of 09.35%. The ABO percentage frequencies order is B > O>A > AB. The frequency order of both males and females showed a similar result to the whole population. Rh-D positive phenotype has more frequency 86.03% and Rh-negative have a low frequency of 13.97% in the population. Rh-positive phenotype is more in females (87.33%) as compared to males (85.13%). Rh-negative is more in males (14.87%) but low in females (12.67%).
The distribution of tongue rolling in population shows 59.96% of people have an ability to roll their tongue while 40.04% can’t. It was observed that tongue rolling in females (61.46%) is more as compared to males (58.92%). While 41.08% of males are unable to roll their tongue as compared with females (38.54%). In the population, persons with free earlobe (71.29%) are more as compared to attach (28.71%). Free earlobe (73.05%) is more common in females as compared to males (70.07%) ().
Straight hair (52.81%) is the most commonly present in the population followed by wavy (30.14%) and least is curly (17.05%). In male and female, straight, wavy and curly hairs are in equal proportion. In population, the absence of dimple (77.23%) is more as compared to the presence of dimple (22.77%). Males with dimples are more in number (24.16%) than females (20.75%).()
The result showed that the ABO blood group, Rh factor, tongue rolling, Nature of hairs and dimples are significant which means that the population is not in equilibrium on the basis of mendelian ratio and therefore, at least one assumption of HW equilibrium might be violated. Only ear lobe is not significant in the whole and female population (Tables and ).
Discussion
As the result has shown the prevalence for B blood type in Punjab province was highest, next followed by O, A and AB. We can deduce that the result is similar to Bangladesh and India (B > O>A > AB) (Chandra T, & Gupta A., Citation2012; Dewan G., Citation2015) but little difference in allelic frequency due to different ethnic groups and regions. The results of different cities of Punjab also shown a similar order of ABO blood group and Rh factor while FATA and Karachi which belong to different provinces (KPK and Sindh) shown little difference in the order of blood group. The prevalence of O blood type is more followed by B, A and AB in both FATA and Karachi (Rehman, Atta ur., et al. Citation2014; Ahmed., Citation2019). The percentage varies among different blood types, but the order is the same. Gujranwala, Sahiwal, Rawalpindi/Islamabad, Lahore and Sialkot have more prevalence of B blood type followed by O, A and AB. (Anees and Aksa., Citation2011; Shakir et al., Citation2012; Ilyas et al., Citation2013; Khan et al., Citation2014; Ilyas., Citation2015).
The study has shown that cholera infections are severe for blood group O instead of blood group B because current vaccines are not provided protection against cholera infections. It is assumed that, blood group B has some resistance against cholera infection. A significant correlation was observed between blood group and cholera infection, but its severity depends on cholera strains (Glass RI., et al Citation1985; Holmner A, et al Citation2010). It was studied that Diabetes Type II is associated with blood group B since the diabetic patient is more common in our population with blood group B. (Qureshi, M. A., & Bhatti, R. Citation2003). The blood type O is associated with malarial resistance which might have an evolutionary advantage. The antigen present on the surface of RBCs (erythrocytes) of blood groups A and B is presumed to act as a receptor to form a rosette structure. (Barragan A., et al Citation2000). While the lack of oligosaccharide on RBCs of blood group O has not suitable for rosette structure infected by Plasmodium falciparum but it is more sensitive to cholera disease.
The combined study of ABO and Rh factor has shown the prevalence of B+ and least is AB- (B + > O+ > A+ > AB+ > B- = O- > A- > AB-). This result is more similar with the study of Butt et al (Citation2016), except AB- has more than A- (B+ > O+ > A+ > AB+ > B- > O- > AB- > A-). The result for a blood group in the whole population, as well as both male and female, is significantly differing with the expected frequencies. This indicates that assumptions are violated from Hardy-Weinberg equilibrium. The presence of Rh (D) antigen is more frequent in India, which is 95.71% compare with this study having 86.02% (Chandra T, & Gupta A Citation2012). It was observed that the frequency of Rh (D) is quite similar in both genders.
The present study showed that the population contains 28.71% attached ear lobe which is close to the result of Indian and Ekpoma Nigeria population containing 35.1% (Sharma, A. et al., Citation2007) and 31.61% (Ordu, K. S. et al., Citation2014) respectively. Punjab population (59.96%) can roll their tongue which is approximately matched with the result of Razzaq et al (Citation2015). The Punjabi and Saraiki collectively contribute 52.3% of peoples who can roll their tongue. (Razzaq et al., Citation2015). In Punjab, 22.77% population has dimpled compare with the study of Razzaq et al (Citation2015) has 33.5% in Punjabi and Saraiki population in Punjab.
In the three classes of hairs morphology, the result of straight (52.81%) and wavy (30.14%) phenotype of hairs are different with European population having 45% and 40% respectively, but the curly (17.05%) nature of hair is close with the study in Europe (15%). It was reported that straight hair is specifically present in an Asian population frequently (Fujimoto et al., Citation2007, Citation2009).
Pakistan is a country having different ethnic groups and races. The study is mainly concern with the Punjab region of Pakistan. So, this region has some variation within the population. It might be assumed that the result which is non-significant is due to because alleles are moving within the same population. Mainly this region has two ethnic groups Punjabi and Saraiki. These two groups have their own traditions, customs and language. Some other migrants have also been settled in this region. Due to this, the variation which causes a significant result in the population. Further, migration and immigration of peoples from the Punjab region might cause significant results in some characters. Mutation and selection pressure might also have a role in disequilibrium the population. The purpose of blood groups allelic and genotypic frequency helps in the distribution of blood and transfusion. This study may have multipurpose benefits to study evolutionary changes about disease control in Pakistan.
Conclusion
This study concludes that the prevalence of B blood type, Rh+, Free ear lobe, straight hair, absence of dimple and ability of tongue rolling have more in population. It also concluded that the alleles of ear lobe are in equilibrium in the whole and female population. In the whole population, ear lobe is in equilibrium is due to the female population.
Disclosure statement
No potential conflict of interest was reported by the author(s).
Data availability statement
The data that support the findings of this study are openly available in figshare at [https://doi.org/10.6084/m9.figshare.12014817.v1].
References
- Ahmed M, Memon A, Iqbal K. 2019. Distribution pattern of ABO and Rhesus blood groups among different ethnic population of Karachi. J Pak Med Assoc. 69(10):1474.
- Alimba CG, Adekoya KO, Oboh BO. 2010. Prevalence and gene frequencies of phenylthiocarbamide (PTC) taste sensitivity, ABO and Rhesus factor (Rh) blood groups, and haemoglobin variants among a Nigerian population. Egyptian J Med Human Gen. 11(2):153–158. doi: https://doi.org/10.1016/j.ejmhg.2010.10.003
- Anees M, Aksa J. 2011. Distribution of ABO and Rh blood group alleles in Sahiwal district of the Punjab, Pakistan. Proc Pak Acad Sci. 48(1):39–43.
- Azaria R, Adler N, Silfen R, Regev D, Hauben DJ. 2003. Morphometry of the adult human earlobe: a study of 547 subjects and clinical application. Plast Reconstr Surg. 111(7):2398–2402. doi: https://doi.org/10.1097/01.PRS.0000060995.99380.DE
- Barragan A, Kremsner PG, Wahlgren M, Carlson J. 2000. Blood group A antigen is a coreceptor in Plasmodium falciparum rosetting. Infect Immun. 68:2971–2975. doi: https://doi.org/10.1128/IAI.68.5.2971-2975.2000
- Bosco F, Castro D, Briones MRS. 2012. Neutral and stable equilibria of genetic systems and the Hardy–Weinberg principle: limitations of the chi-square test and advantages of auto-correlation functions of allele frequencies. Front Genet. 3:1–10. doi: https://doi.org/10.3389/fgene.2012.00276
- Butt DS, Malik S, Khalid MZ, Aziz M, Humayun A. 2016. Gender distribution of ABO and Rhesus blood groups among medical students of a public medical school in Lahore, Pakistan. Proc Shaikh Zayed Postgrad Med Comp. 30(2):77–81.
- Cavalli-Sforza LL, Feldman M. 2003. The application of molecular genetic approaches to the study of human evolution. Nat Genet. 33(3s):266. doi: https://doi.org/10.1038/ng1113
- Chandra T, Gupta A. 2012. Frequency of ABO and rhesus blood groups in blood donors. Asian J Trans Sci. 6(1):52–53. doi: https://doi.org/10.4103/0973-6247.95057
- Chen JJ. 2010. The Hardy-Weinberg principle and its applications in modern population genetics. Front Biol. 5(4):348–353. doi: https://doi.org/10.1007/s11515-010-0580-x
- Dean L. Blood group antigens are surface markers on the red blood cell membrane, National Center for Biotechnology Information (US). 2005.
- Dewan G. 2015. Comparative frequency and allelic distribution of ABO and Rh (D) blood groups of major tribal communities of southern Bangladesh with general population and their determinants. Egypt J Med Hum Genet. 16(2):141–147. doi: https://doi.org/10.1016/j.ejmhg.2015.01.002
- Ebeye OA, Chris-Ozoko LE, Ogeneovo P, Onoriode A, et al. 2014. A study of some morphogenetic traits among the Esan ethnic group of Nigeria. East African Med J. 91(11):420–422.
- Fujimoto A, Kimura R, Ohashi J, Omi K, Yuliwulandari R, Batubara L, Mustofa MS, Samakkarn U, Ishida T, et al. 2007. A scan for genetic determinants of human hair morphology: EDAR is associated with Asian hair thickness. Hum Mol Genet. 17(6):835–843. doi: https://doi.org/10.1093/hmg/ddm355
- Fujimoto A, Nishida N, Kimura R, Miyagawa T, Yuliwulandari R, Batubara L, Mustofa MS, Samakkarn U, Settheetham-Ishida W, Ishida T, et al. 2009. FGFR2 is associated with hair thickness in Asian populations. J Hum Genet. 54(8):461. doi: https://doi.org/10.1038/jhg.2009.61
- Glass RI, Holmgren J, Haley CE, Khan MR, Svennerholm AM, Stoll BJ, Belayet Hossain KM, Black RE, Yunus M, Barua D. 1985. Predisposition for cholera of individuals with O blood group. Possible evolutionary significance. Am J Epidemiol. 121(6):791–796. doi: https://doi.org/10.1093/oxfordjournals.aje.a114050
- Grünwald NJ, Everhart SE, Knaus BJ, Kamvar ZN. 2017. Best practices for population genetic analyses. Papers in Plant Pathology. 421.
- Hartl DL, Clarke AG. 2007. Principles of population genetics, 4th ed. Sunderland, MA: Sinauer.
- Holmner A, Mackenzie A, Krengel U. 2010. Molecular basis of cholera blood-group dependence and implications for a world characterized by climate change. FEBS Lett. 584(12):2548–2555. doi: https://doi.org/10.1016/j.febslet.2010.03.050
- Ilyas M. 2015. Distribution of blood groups ABO and Rh reported from district Sialkot (Punjab) Pakistan. Sci Int. 27(3):2021–2023.
- Ilyas M, Iftikhar M, Rasheed U. 2013. Frequency of ABO and Rh blood groups in Gujranwala (Punjab), Pakistan. Biologia (Pakistan). 59(1):107–114.
- Jankowska D, Milewski R, Cwalina U, Milewska AJ. 2011. Application of Hardy-Weinberg law in biomedical research. Stud Log Gramm Rhetor 25(38):7–27.
- Khan MU, Bashir M W, Rehman R, Kiani RA. 2014. Frequency of ABO and Rh (D) blood groups among blood donors in Lahore, Pakistan. Int J Adv Biolog Biomed Res. 2(3):597–600.
- Kosif R. 2015. Anatomical skin dimples. Innov J Med Health Sci. 5:8–15.
- Liu TT, Hsu TC. 1949. Tongue-folding and tongue-rolling in a sample of the Chinese population. J Heredity. 40(1):19–21. doi: https://doi.org/10.1093/oxfordjournals.jhered.a105945
- Milgroom MG. 2015. Population biology of plant pathogens: genetics, ecology, and evolution. St. Paul, MN: American Phytopathological Society.
- Monheit, G. Commentary: Hidradenitis Suppurativa: surgical and other management techniques. Dermatol Surg 38(4): 536, 2012. doi: https://doi.org/10.1111/j.1524-4725.2011.02173.x
- Omotoso GO, Adeniyi PA, Medubi LJ. 2010. Prevalence of facial dimples amongst south- western Nigerians: a case study of Ilorin, Kwara state of Nigeria. Int J Biomed Health Sci. 6(4):241–244.
- Ordu KS, Didia BC, Egbunefu N, et al. 2014. Inheritance pattern of earlobe attachment amongst Nigerians. Green. J. Hum. Phys. Anat. 2:1–7. doi: https://doi.org/10.15580/GJHPA.2014.1.012214054
- Pasha J, Kumar S. 2009. Frequency of ABO blood groups among medical students. J Surg Pak. 14(2):93.
- Qureshi MA, Bhatti R. 2003. Frequency of ABO blood groups among the diabetes mellitus type 2 patients. J College Phys Surgeons–Pakistan: JCPSP. 13(8):453–455.
- Razzaq R, Kanwal S, Sajjad N. 2015. Tongue rolling, folding, cheek dimple and chin cleft; study of a morphogenetic traits in Quetta population. World J Zool. 10(3):237–240.
- Rehman Au, Wahab Zu, Khattak MNK, Malik S. 2014. ABO and Rh (D) blood groups polymorphism in four tehsils of Bajaur Agency (Federally Administered Tribal areas), Pakistan. The Anthropologist. 18(1):259–261. doi: https://doi.org/10.1080/09720073.2014.11891543
- Shakir CM, Khan SA, Ghani E. 2012. Frequency of ABO and Rh (D) blood groups among blood donors in Rawalpindi/Islamabad area. Pakistan Armed Forces Med J. 62(2):304–306.
- Sharma A, Sidhu NK, Sharma MK, Kapoor K. 2007. Morphometric study of ear lobule in northwest Indian male subjects. Anat Sci Int. 82(2):98–104. doi: https://doi.org/10.1111/j.1447-073X.2007.00166.x
- Starr B. 2009. Ask a geneticist. Understanding genetics. Human Health and the Genome. 1–3.
- Tahir HM, Aqeel J, Mishal R, Ahsan MM, Bilal M, Khan SK. 2014. Some interesting facts about tongue rolling trait in humans. Pak J Zool. 46(4):1173–1175.
- Thibaut S, Barbarat P, Leroy F, Bernard BA. 2007. Human hair keratin network and curvature. Int J Dermatol. 46:7–10. doi: https://doi.org/10.1111/j.1365-4632.2007.03454.x