
Abstract
Background: Obesity is associated with serious health risks, including premature mortality. This study investigated the anti-obesity effects of individual or combination treatment with Spirulina platensis and green coffee bean aqueous extracts in high-fat diet-induced (HFD) obese rats. Methods: Rats were fed on HFD to induce obesity. Corn oil in the HFD accounted for 50.98% of the calories. Fifty rats were divided into five groups (10 rats/group): control, HFD, HFD-Spirulina, HFD-coffee, HFD-Spirulina and coffee cotreatment groups. The serum levels of lipid, leptin, and insulin, as well as the hepatic mRNA levels of fatty acid synthase (FAS), peroxisome proliferator-activated receptor gamma coactivator-1 alpha (PGC-1α), and peroxisome proliferator-activated alpha receptor (PPARα) were estimated. Results: The Spirulina and/or green coffee bean aqueous extracts decreased the final bodyweight and liver weight, and the serum levels of alanine aminotransferase, aspartate aminotransferase, and alkaline phosphatase. The extracts decreased the serum levels of total cholesterol, triacylglycerol, low-density lipoprotein-cholesterol, leptin, and glucose, and enhanced the serum insulin level. Furthermore, the extracts enhanced the PGC-1α and PPARα mRNA levels and decreased the FAS mRNA levels. Conclusion: The individual or combination treatment with Spirulina platensis and green coffee bean extracts decreased obesity-induced hyperlipidemia and they can be potentially used to treat obesity.
Abbreviations: ACC: Acetyl Co-A carboxylase; AF: Activity factor; ALP: Alkaline phosphatase; ALT: Alanine amino transferase; AMP: Adenosine monophosphate; AMPK: AMP activated protein kinase; AST: Aspartate amino transferase; BMI: Body mass index; cAMP: Cyclic adenosine monophosphate; CBE: Coffee bean extract; CVD: Cardiovascular disorder; DRD4: Dopamine receptor D4; FAS: Fatty acid synthase; FFA: Free fatty acid; FTO: Fat mass and obesity gene; GOD: Glucose oxidase; G-6-P: Glucose-6-phosphatase; HDL-C: High-density lipoprotein-cholesterol; HFD: High-fat diet; HMGRCR: 3-hydroxy-3-methylglutaryl CoA reductase; LDL-C: Low-density lipoprotein-cholesterol; LXR α: Liver X receptor α; MC4R: Melanocortin 4 receptor gene’; NO: Nitric oxide; PGC-1α: Peroxisome proliferator-activated receptor gamma coactivator-1 alpha; PPARα: Peroxisome proliferator-activated alpha; PPARγ: Peroxisome proliferator-activated receptor γ; REE: Resting energy expenditure; ROS: Reactive oxygen species; TC: Total cholesterol; T2DM: Type 2 diabetes; TG: Triacyl glycerol; TP: Total protein; VLDL: Very low-density lipoprotein; WLS: Weight loss surgery
Introduction
Obesity is a chronic disease that is associated with serious health risks and premature mortality (Pilch and Bergenhem Citation2006). The consumption of high-fat diet (HFD) has increased the incidence of obesity in recent years. The imbalance between calorie intake and energy expenditure results in the accumulation of body fat, which progresses to obesity (Lau et al. Citation2007; Osborn and Olefsky Citation2012). Obesity is frequent among populations associated with a positive long-term energy balance due to a sedentary lifestyle, low resting metabolic rate, or both. In some cases, obesity is caused due to genetic factors, medical conditions, or psychiatric illness (Keith et al. Citation2006; Bleich et al. Citation2008). Dyslipidemia is characterized by enhanced circulating levels of cholesterol, triglycerides, and free fatty acid, as well as a decreased ratio of circulating levels of high-density lipoprotein-cholesterol (HDL-C) to those of low-density lipoprotein-cholesterol (LDL-C) (Adiels et al. Citation2008).
Treatment with natural products can be a potential therapeutic strategy for obesity. Natural products can be used to develop novel effective and safe anti-obesity drugs. Various natural products, including crude extracts and isolated pure natural compounds, can promote bodyweight reduction and prevent diet-induced obesity (Han et al. Citation2005). Spirulina platensis is a blue–green microalga with super food characters due to their high content of protein (70% dry weight), polyunsaturated fatty acids, phospholipids, polysaccharides, provitamins, vitamin A, vitamin E, different B vitamins; and minerals (Ghaeni and Roomiani Citation2016). Spirulina is a potential therapeutic agent for hepatotoxicity caused by oxidative stress and the antioxidative potential of Spirulina was related to its phycocyanin component (Hussein et al. Citation2015). Recent clinical trials showed promising effects of Spirulina for reducing body weight in obese humans (Moradi et al. Citation2019) and mice (Zhao et al. Citation2019).
Globally, coffee is one of the most commonly consumed beverages. Several studies have reported the beneficial effects of coffee on human health (Tanaka et al. Citation2009). One of the common traditional forms of coffee beans is green coffee beans, which are raw coffee beans that have not been roasted (Ochiai et al. Citation2004; Kozuma et al. Citation2005; Blum et al. Citation2007). The raw green coffee beans are rich in caffeine, chlorogenic acid, and its related metabolites, such as quinic acid, caffeic acid, and p-coumaric acid (Hasegawa and Mori Citation2000; Zheng et al. Citation2004; Lopez-Garcia et al. Citation2006). Moreover, recent clinical trials showed promising therapeutic effects of green coffee for improvement lipid and hormonal profiles in obese humans (Gorji et al. Citation2019; Nikpayam et al. Citation2019) and mice (Choi et al. Citation2016).
This study aimed to investigate the anti-obesity effects of individual and combination of S. platensis and green coffee aqueous extracts by evaluating the biochemical and molecular parameters of dyslipidemia in HFD-induced obese rats.
Material and methods
Chemicals
The powder of S. platensis was obtained from Free Trade Egypt Co., Behira, Egypt. The aqueous extract was prepared by suspending 1 g of S. platensis powder in 1 mL of distilled water (Farag et al. Citation2016). The aqueous extract of green coffee beans was prepared by infusing 30 g of ground beans of Coffea arabica in 175 mL of distilled water. The filtrate was evaporated in a hot oven at 60°C. The extract crystals obtained were pulverized before use. The amount of dry extract obtained using this method was 3 g. The powder was stored in a sealed sterilized glass bottle, which was stored in a refrigerator until use (Angelo et al. Citation2017). These extracts were freshly prepared every 3–4 days throughout the experiment.
Experimental animals
In total, 50 male albino rats with a bodyweight of approximately 120 ± 10 g were purchased from the farm of Faculty of Veterinary Medicine, Zagazig University. The animals were housed individually under a 12-h light/dark cycle. The animals had free access to food and water. After 2 weeks of adaptive feeding, all animals were weighed once every week. The rats were fed on HFD to induce obesity. As shown in Table , 50.98% of the calories in the HFD were derived from corn oil (Griffin et al. Citation2012). The study protocol was approved by the Zagazig University Research Center, Institutional Animal Care and Use Committee (IACUC) (approval number: ZU-IACUC/3/F/119/2019).
Table 1. The composition of the diet for the experimental rats.
Experimental design
The rats were divided into the following two main groups: Group I, control group (control diet) (n = 10) and Group II, HFD group (n = 40). The control group rats had free access to normal diet and water during the experimental period. The HFD group rats were further subdivided into the following four subgroups (10 rats/subgroup): Group IIa (untreated HFD group), fed on HFD throughout the experimental period; Group IIb (S. platensis extract-treated HFD group), fed on HFD for 16 weeks, followed by oral administration of S. platensis (150 mg/kg bodyweight) suspended in water using a water bottle during the last six weeks (Farag et al. Citation2016); Group IIc (green coffee bean extract-treated HFD group), fed on HFD for 16 weeks, followed by oral administration of green coffee bean extract (200 mg/kg bodyweight) suspended in water using a water bottle during the last six weeks. This dose of green coffee bean extract was selected based on a mouse study (Choi et al. Citation2016), which was converted to rat dosage using a previously described calculation method (Nair and Jacob Citation2016); Group IId (S. platensis and green coffee bean extract-treated HFD group), fed on HFD for 16 weeks, followed by oral administration of S. platensis (150 mg/kg bodyweight) and green coffee bean (200 mg/kg bodyweight) extract suspended in water using a water bottle during the last six weeks. Body weight and food intake were measured once weekly.
Sampling
After the end of the experimental period of 16 weeks, the rats were allowed to fast for 12 h. Next, the rats were sacrificed by decapitation. The blood samples were collected in centrifuge tubes in the absence of an anticoagulant. The blood samples were centrifuged at 3000 rpm for 20 min. The serum samples were separated and stored at −20°C until biochemical analysis. The abdominal circumference and nose-anus length (NAL) of the rats in the control and experimental groups were measured. BMI was determined by dividing the weight (g) and the square of the nose-anus length (cm). The liver and subcutaneous WAT were harvested and weighted from all groups of rats. The liver samples (30 mg) were snap-frozen in liquid nitrogen and stored in a liquid nitrogen container until quantitative real-time polymerase chain reaction (qRT-PCR) analysis.
Biochemical analysis
The serum levels of glucose, total protein, albumin, alkaline phosphatase (ALP), total cholesterol, and triglycerides were measured following previously described protocols (Hussein et al. Citation2020). The serum levels of HDL-C, LDL-C, and very low-density lipoprotein-cholesterol (VLDL-C) were determined following previously described protocols (Burstein et al. Citation1970; Wieland and Siedel Citation1983; and Wilson et al. Citation1985, respectively). The kits for previous biochemical analysis were provided from Spectrum, Egyptian Company for Biotechnology, Cairo, Egypt. The serum levels of leptin and insulin were measured using the respective solid-phase enzyme-linked immunosorbent assay (ELISA) kits (RayBio and MyBioSource, respectively).
qRT-PCR
Total RNA was extracted from the liver tissues using the RNeasy mini kit, following the manufacturer’s instructions (Intron Biotech, Daegon, Korea). The first-strand cDNA was synthesized using the HiSenScript™ RH (-) cDNA Synthesis Kit. cDNA was subjected to qRT-PCR using the Power SYBR® green PCR master mix. The primer sequences used for qRT-PCR analysis are listed in Table . The PCR conditions were as follows: 1 cycle of 95°C for 12 min for denaturation, followed by 40 cycles of 95°C for 15 s for denaturation, 60°C for 20 s for annealing, and 72°C for 20 S for extension. The threshold cycle (Ct) of the target gene was normalized to that of the housekeeping gene (β-actin). The relative expression level of the target gene was determined by the (2-ΔΔCt) method (Livak and Schmittgen Citation2001).
Table 2. Primers used for quantitative real-time polymerase chain reaction (qPCR).
Statistical analysis
The normality of the data was tested using the Shapiro–Wilk test. All data were normally distributed. The data are represented as mean ± standard error of mean (SEM). The data were analyzed by one-way analysis of variance (ANOVA) test. The data of different groups were compared by two-way ANOVA using the general linear model (GLM). Duncan multiple range test and least significant difference (LSD) multiple comparison tests were performed as post hoc tests. All statistical analyses were performed in IBM SPSS (version 25). The graphs were plotted in GraphPad prism 8.
Results
Effects of aqueous extracts on anthropometric measurements, daily food intake, liver and subcutaneous WAT weights of HFD-induced obese rats
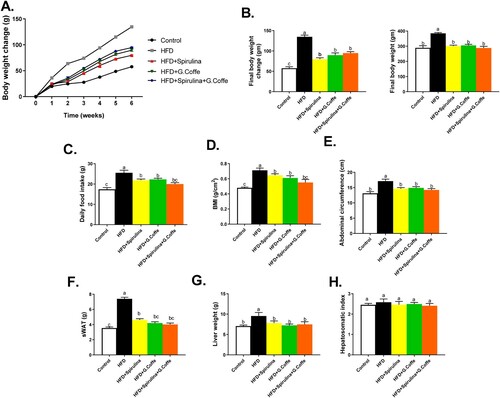
The group IIa rats exhibited significantly higher bodyweight change (P < 0.001), final body weight, BMI, abdominal circumference and daily food intake than the group I rats (Figure (A–E)). The group IIb, IIc, and IId rats exhibited significantly lower (P < 0.05) bodyweight change, final body weight, BMI, abdominal circumference and daily food intake than the group IIa rats (Figure (A–E)). The group IIa rats exhibited significantly higher liver weight (P < 0.05), but not hepatosomatic index, and subcutaneous WAT than the group I rats (Figure (F–H)). The group IIb, IIc, and IId rats exhibited significantly lower liver weight, but not hepatosomatic index, and subcutaneous WAT than the group IIa rats (Figure (F–H)).
Figure 1. Effects of the individual or combination treatment with Spirulina platensis and green coffee bean aqueous extract anthropometric measurements, daily food intake. liver and subcutaneous WAT weights of HFD-induced obese rats (A-H). A. Body weight change, B. Final body weight change (left panel) and final body wight (right panel), C. Daily food intake, D. BMI, E. Abdominal circumference, F. subcutaneous WAT weight, G. liver weight, and H. Hepatosomatic index. Values are represented as mean ± standard error of mean (SEM) in each group (n = 8–10). The means bearing different superscripts are significantly different (P < 0.05).
Effects of aqueous extracts on liver function
The group IIa rats exhibited non-significantly higher serum levels of total proteins than the group I, IIb, IIc, and IId rats (Table ). Moreover, the serum albumin levels in the group IId rats were significantly (P < 0.01) higher than those in the group IIa rats. The group IIb, IIc, and IId rats exhibited significantly higher serum total globulin levels than the group I and group IIa rats (P < 0.01). However, the group IIa rats exhibited non-significantly higher albumin/globulin ratio than the group I, IIb, IIc, and IId rats. The serum alanine aminotransferase (ALT) levels in the group IIa rats were significantly (P < 0.001) higher than those in the group I rats. Meanwhile, the group IIb, IIc, and IId rats exhibited significantly lower serum ALT levels than the group IIa rats. The group IIa rats exhibited significantly higher serum levels of aspartate aminotransferase (AST) (P < 0.01) than the group I rats. In contrast, the group IId rats exhibited significantly lower serum levels of AST than the group IIa rats. The serum ALP levels in the group IIa rats were significantly (P < 0.001) higher than those in the group I rats. The group IIb, IIc, and IId rats exhibited significantly lower serum ALP levels than the group IIa rats.
Table 3. Effects of the individual or combination treatment with Spirulina platensis and green coffee bean aqueous extract on liver function in HFD-induced obese rats.
Effects of aqueous extracts on lipogram of HFD-induced obese rats
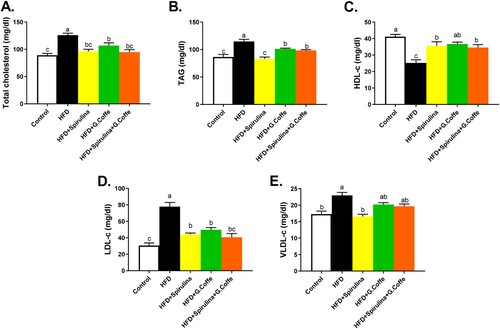
The group IIa rats exhibited significantly higher serum levels of total cholesterol (P < 0.001) than the group I rats (Figure (A)). The group IIb, IIc, and IId rats exhibited significantly lower serum levels of total cholesterol than the group IIa rats (Figure (A)). The group IIa rats exhibited significantly higher serum levels of triacylglycerol (P < 0.001) than the group I rats (Figure (B)). Moreover, the group IIb, IIc, and IId rats exhibited significantly lower serum levels of triacylglycerol than the group IIa rats (Figure (B)). The group IIa rats exhibited significantly lower serum levels of HDL-C (P < 0.001) than the group I rats (Figure (C)). The serum HDL-C levels in the group IIb, IIc, and IId rats were significantly higher than those in the group IIa rats (Figure (C)). The group IIa rats exhibited significantly higher serum levels of LDL-C (P < 0.001) than the group I rats (Figure (D)). The group IIb, IIc, and IId rats exhibited significantly lower serum levels of LDL-c than the group IIa rats (Figure (D)). The group IIa rats exhibited significantly higher serum levels of VLDL-C (P < 0.01) than the group I rats (Figure (E)). The group IIb rats exhibited significantly lower serum levels of VLDL-C than the group IIa rats (Figure (E)).
Figure 2. Effects of the individual or combination treatment with Spirulina platensis and green coffee bean aqueous extracts on lipid profile in HFD-induced obese rats (A-E). A. Total cholesterol, B. Triacylglycerol, C. High-density lipoprotein-cholesterol, D. Low-density lipoprotein-cholesterol and Very low-density lipoprotein-cholesterol. Values are represented as mean ± standard error of mean (SEM) in each group (n = 8–10). The means bearing different superscripts are significantly different (P < 0.05).
Effects of aqueous extracts on the serum levels of leptin, insulin, and glucose in HFD-induced obese rats
The group IIa rats exhibited significantly higher serum leptin levels (P < 0.001) than the group I rats (Table ). The group IIb, IIc, and IId rats exhibited significantly lower serum leptin levels than the group IIa rats. The serum insulin level in the group IIa rats was significantly lower (P < 0.001) than that in the group I rats. The group IIb, IIc, and IId rats exhibited significantly higher serum insulin level than the group IIa rats. The group IIa rats exhibited significantly higher blood glucose levels (P < 0.001) than the group I rats. The group IIb, IIc, and IId rats exhibited significantly lower blood glucose level than the group IIa rats.
Table 4. Effects of the individual or combination treatment with Spirulina platensis and green coffee bean aqueous extract on the serum levels of leptin, insulin, and glucose in HFD-induced obese rats.
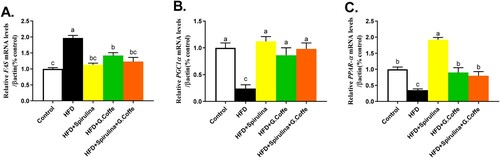
Effects of aqueous extracts on the mRNA levels of FAS, PGC-1α, and PPAR-α in HFD-induced obese rats
Figure 3. Quantitative real-time PCR analysis to determine the hepatic mRNA expression levels of FAS (A), PGC-1α (B), and PPARα (C) in the control, HFD (high-fat diet-fed group), Spirulina (HFD + Spirulina platensis extract-treated group), G. coffee (HFD + green coffee bean extract-treated group), and Cotreated (HFD + Spirulina platensis and green coffee bean extract-treated group) groups. Values are represented as mean ± standard error of mean (SEM) in each group. The means bearing different letters (a, b, and c) are significantly different (P < 0.05).
Discussion
The imbalance between energy intake and energy expenditure causes obesity, a chronic metabolic disorder. Obesity is characterized by the accumulation of fat mass and elevated lipid concentration in the blood. Additionally, obesity is a major risk factor for cardiovascular disease (CVD) which related to hypercholesterolemia and hypertriglyceridemia (Balasubramanian et al. Citation2013).
The results of this study indicated that rats fed with HFD exhibited significantly higher bodyweight than the rats fed with control diet. Treatment with S. platensis aqueous extract significantly decreased the HFD-induced bodyweight gain in rats. This may be because of the presence of phycocyanin pigment in S. platensis, which inhibits oxidation of fatty acids or lipolysis (Alonso and Maroto Citation2000; Colla et al. Citation2008). The presence of unsaturated fatty acids, such as oleic acid, linoleic acid, gamma-linolenic acid, and other phytochemical constituents like fixed oils, amino acids, and flavonoids may contribute to the anti-obesity activity of S. platensis (Colla et al. Citation2004).
The rats treated with green coffee bean aqueous extract also exhibited decreased bodyweight. This may be due to the phytochemical constituents of green coffee beans. Previous studies have reported that the phytochemical constituents of green coffee beans prevent bodyweight gain and fat accumulation by inhibiting fat absorption and increasing fat metabolism in the liver (Shimoda et al. Citation2006; Meng et al. Citation2013). The beneficial effects of green coffee beans are majorly due to the chlorogenic acid content (Meng et al. Citation2013; Meng et al. Citation2016). Green coffee bean extract was reported to suppress bodyweight gain better than chlorogenic acid or caffeine, which was attributed to the synergistic activity of caffeine and chlorogenic acid in the green coffee bean (Suzuki et al. Citation2008; Zheng et al. Citation2014).
As the liver is the major organ involved in detoxification, it is important to maintain liver function. The damage of organs or tissues results in the release of high amounts of cellular enzymes into the bloodstream. Several studies have reported that the activities of most enzymes in the blood of healthy individuals remain constant (González de Rivera et al. Citation1993; Torres-Durán et al. Citation1999).
In this study, the biochemical parameters, such as total protein level, globulin level, and albumin/globulin ratio in the group IId rats were not significantly different from those in the group IIa rats. However, the levels of ALT, AST, ALP, and albumin were significantly different between the group IIb and group IIa. Treatment with Spirulina is reported to significantly decrease the levels of cholesterol, serum triacylglycerol, and LDL-C and to significantly increase the levels of HDL-C (El-Sheekh et al. Citation2014; Zhao et al. Citation2019).
Treatment with Spirulina decreases the serum lipid levels because of the presence of antioxidant compounds, such as phycocyanins and phenolic compounds, which inhibit oxidation of fatty acids or lipolysis, and polyunsaturated fatty acids, which contribute to the anti-obesity activity of S. platensis (Balasubramanian et al. Citation2013). The hypolipidemic effect of S. platensis is mediated by C-phycocyanin, which inhibits jejunal cholesterol absorption and ileal bile acid reabsorption (Nagaoka et al. Citation2005). Additionally, glycolipid H-b2 of S. platensis was reported to dose-dependently inhibit pancreatic lipase activity and to reduce postprandial triacylglycerol level (Han et al. Citation2006). The essential fatty acid content in S. platensis can prevent the accumulation of fat and cholesterol (Kurdikeri Citation2006).
Green coffee directly affects all the parameters of the lipid profile (Shimoda et al. Citation2006). The phytoconstituent of green coffee beans was reported to significantly improve the levels of HDL and VLDL (Meng et al. Citation2013). Additionally, green coffee was reported to decrease the levels of cholesterol, triglyceride, and LDL (Yukawa et al. Citation2004). Chlorogenic acid in green coffee beans decreases the lipid content and subsequently bodyweight gain and fat accumulation through inhibition of fat absorption and activation of fat metabolism in the liver (Shimoda et al. Citation2006).
Leptin is secreted by the adipocytes to regulate food intake and fatty acid oxidation. Leptin is transported to the brain, which signals the inhibition of lipid accumulation in the adipose tissue (Arch Citation2005). Treatment with green coffee bean extract is reported to reduce leptin concentrations (Choi et al. Citation2016). Treatment with S. platensis extract decreased the blood glucose level. Some studies suggest that the high fiber content of S. platensis interferes with glucose absorption, which subsequently reduces blood glucose levels (Layam and Reddy Citation2006). Other studies suggest that the peptides and polypeptides generated by the digestion of S. platensis may lower the blood glucose level (Mani et al. Citation2000).
Treatment with S. platensis extract increased the insulin levels. S. platensis may exert antihyperglycemic effect through potentiation of the pancreatic secretion of insulin from the islet β-cell or through enhanced transport of blood glucose to the peripheral tissue. S. platensis exerts hypoglycemic effects via downregulation of NADPH (nicotinamide adenine dinucleotide phosphate) and NADH (nicotinamide adenine dinucleotide), which are co-factors of fat metabolism (Layam and Reddy Citation2006).
Treatment with green coffee extract also decreased the blood glucose level and increased the insulin level. Chlorogenic acid, a phytoconstituent of green coffee, inhibits glucose absorption in the small intestine by inhibiting glucose-6-phosphate translocase 1 (Ma et al. Citation2015) and glucose release by inhibiting hepatic glucose-6-phosphatase activity. This results in decreased glucose levels in the general circulation and consequently low insulin activity.
Treatment with green coffee extract was reported to inhibit fatty acid synthase (FAS) in rats (Cho et al. Citation2010). Hepatic lipid metabolism has an important role in whole-body lipid metabolism. Lipid metabolism occurs through the opposing activities of liver X receptor α (LXRα) and peroxisome proliferator-activated α (PPARα), which are nuclear receptor transcription factors that are highly expressed in the liver. Fatty acid and triglyceride syntheses are regulated by LXRs through direct activation of the genes encoding lipogenic enzymes, such as FAS and acetyl CoA-carboxylase (ACC) (Santana-Gálvez et al. Citation2017). Moreover, chlorogenic acid showed concomitant down-regulation of LXRα, ACC and FAS mRNA levels with a paradoxical up-regulation of PPARα mRNA expression in the liver (Huang et al. Citation2015). PPARα, which is activated by ligands, regulates the metabolism of lipids, carbohydrates, and amino acids (Contreras et al. Citation2013). In this study, the group IIb rats exhibited higher PPARα mRNA expression levels than the group IIa rats. S. platensis is reported to inhibit fatty acid synthesis and activate fatty acid β-oxidation in the livers of HFD-fed rats (Hua et al. Citation2018). Additionally, PPARα is a ligand-activated transcription factor. The activation of PPARα induces the mRNA expression of several genes involved in fatty acid oxidation and reduces the circulating lipid levels (Takahashi et al. Citation2011). PPARα activates the intestinal fatty acid oxidation, which suppresses postprandial lipemia in rats (Torres-Durán et al. Citation1999).
The group IIc rats exhibited higher mRNA expression levels of PPARα than the group IIa rats. Chlorogenic acid in green coffee beans affects the enzymes that regulate lipid metabolism, which exerts beneficial effects on obesity and dyslipidemia (Santana-Gálvez et al. Citation2017). PPARα enhances fatty acid degradation through β-oxidation (Huang et al. Citation2015). The reduction in serum and hepatic lipids in rats treated with green coffee extract was reported to be due to enhanced PPARα expression, which accelerates fatty acid β-oxidation (Santana-Gálvez et al. Citation2017).
Conclusion
This study demonstrated the biochemical and molecular changes associated with individual or combination treatment with S. platensis and green coffee aqueous extracts in HFD-induced obese rats. The group IId rats exhibited lower bodyweight gain than the group IIa rats. Treatment with S. platensis and green coffee extracts ameliorated HFD-induced lipid profile changes in rats. The levels of leptin, insulin, and blood glucose improved upon treatment with S. platensis and green coffee extracts in HFD-induced obese rats. Additionally, treatment with S. platensis and green coffee extract ameliorated the HFD-induced changes in the mRNA levels of FAS, PGC-1α and PPARα. Based on the results of this study, we recommend using S. platensis and green coffee for treating obesity.
Availability of data and materials
The data that support the findings of this study are openly available at this link https://doi.org/10.5281/zenodo.3841050.
Ethics approval and consent to participate
The study was approved by the Zagazig University Research Center, Institutional Animal Care and Use Committee (IACUC) under number ZU-IACUC/3/F/119/2019.
Acknowledgments
We would like to thank the Researchers supporting project program (RSP-2019/84), King Saud University, Riyadh, Saudi Arabia for funding this work.
Disclosure statement
No potential conflict of interest was reported by the author(s).
Additional information
Funding
References
- Adiels M, Taskinen MR, Boren J. 2008. Fatty liver, insulin resistance, and dyslipidemia. Curr Diab Rep. 8:60–64. doi: https://doi.org/10.1007/s11892-008-0011-4
- Alonso DL, Maroto FG. 2000. Plant as chemical factories for the production of polyunsaturated fatty acids. Biotechnol Adv. 18(6):481–497. doi: https://doi.org/10.1016/S0734-9750(00)00048-3
- Angelo AFB, Claude KAL, Séraphin KC. 2017. Effects of aqueous and ethanolic extracts of roasted and ground coffee beans of Coffea canephora Robusta on glycemia and release and storage of hepatic glucose in normoglycemic and diabetic rats. Adv Diabetes Metab. 5(4):59–64.
- Arch JR. 2005. Central regulation of energy balance: inputs, outputs and leptin resistance. Proc Nutr Soc. 64:39–46. doi: https://doi.org/10.1079/PNS2004407
- Balasubramanian VSB, Md G, Samreen S. 2013. Anti obesity activity of Spirulina platensis in high fat diet induced rats. Int J Pharmacol Screen Method. 3(1):1–5.
- Bleich S, Cutler D, Murray C, Adams A. 2008. Why is the developed world obese? Annu Rev Public Health. 29:273–295. doi: https://doi.org/10.1146/annurev.publhealth.29.020907.090954
- Blum J, Lemaire B, Lafay S. 2007. Effect of a green decaffeinated coffee extract on glycemia. Nutra Food Res. 6(3):13–17.
- Burstein M, Selvniek H, Morfin R. 1970. Rapid method for the isolation of lipoproteins from human serum by precipitation with polyanions. J Lipid Res. 11:583–595.
- Cho AS, Jeon SM, Kim MJ, Yeo J, Seo KI, Choi MS, Lee MK. 2010. Chlorogenic acid exhibits anti-obesity property and improves lipid metabolism in high-fat diet-induced-obese mice. Food Chem Toxicol. 48:937–943. doi: https://doi.org/10.1016/j.fct.2010.01.003
- Choi BK, Park SB, Lee DR, Lee HJ, Jin YY, Yang SH, Suh JW. 2016. Green coffee bean extract improves obesity by decreasing body fat in high-fat diet-induced obese mice. Asian Pac J Trop Med. 9(7):635–643. doi: https://doi.org/10.1016/j.apjtm.2016.05.017
- Colla LM, Bertolin TE, Costa JA. 2004. Fatty acids profile of Spirulina platensis grown under different temperature and nitrogen concentrations. Z Naturoforsch C J Biosci. 59:55–59. doi: https://doi.org/10.1515/znc-2004-1-212
- Colla LM, Muccillo-Baisch AL, Costa JAV. 2008. Spirulina platensis effects on the levels of total cholesterol, HDL and triacylglycerols in rabbit fed with a hypercholesterolemic diet. Brazilian Arch Biol Technol. 51:405–411. doi: https://doi.org/10.1590/S1516-89132008000200022
- Contreras AV, Torres N, Tovar AR. 2013. PPAR-α as a key nutritional and environmental sensor for metabolic adaptation. Adv Nutr. 4:439–452. doi: https://doi.org/10.3945/an.113.003798
- El-Sheekh MM, Hamad SM, Gomaa M. 2014. Protective effects of Spirulina on the liver function and hyperlipidemia of rats and human. Braz Arch Biol Technol. 57(1):77–86. doi: https://doi.org/10.1590/S1516-89132014000100012
- Farag MR, Abd EL-Aziz RM, Ali HA, Ahmed SA. 2016. Evaluating the ameliorative efficacy of Spirulina platensis on spermatogenesis and steroidogenesis in cadmium-intoxicated rats. Environ Sci Pollut Res Int. 23:2454–2466. doi: https://doi.org/10.1007/s11356-015-5314-9
- Ghaeni M, Roomiani L. 2016. Review for application and medicine effects of Spirulina, Spirulina platensis microalgae. J Adv Agri Technol. 3(2):114–117.
- González de Rivera G, Miranda-Zamora R, Díaz-Zagoya JC, Juárez-Oropeza MA. 1993. Preventive effect of Spirulina maxima on the fatty liver induced by a fructose-rich diet in the rat, a preliminary report. Life Sci. 53:57–61. doi: https://doi.org/10.1016/0024-3205(93)90611-6
- Gorji Z, Varkaneh HK, Talaei S, Nazary-Vannani A, Clark CCT, Fatahi S, Rahmani J, Salamat S, Zhang Y. 2019. The effect of green-coffee extract supplementation on obesity: a systematic review and dose-response meta-analysis of randomized controlled trials. Phytomedicine. 63:153018. doi: https://doi.org/10.1016/j.phymed.2019.153018
- Griffin TM, Huebner JL, Kraus VB, Yan Z, Guilak F. 2012. Induction of osteoarthritis and metabolic inflammation by a very high-fat diet in mice: effects of short-term exercise. Arthritis Rheum. 64(2):443–453. doi: https://doi.org/10.1002/art.33332
- Han LK, Kimura Y, Okuda H. 2005. Anti-obesity effects of natural products. Stud Nat Prod Chem. 30:79–110. doi: https://doi.org/10.1016/S1572-5995(05)80031-6
- Han LK, Li DX, Xiang L, Gong XJ, Kondo Y, Suzuki I, Okuda H. 2006. Isolation of pancreatic lipase activity-inhibitory component of Spirulina platensis and it reduce postprandial triacylglycerolemia. Yakugaku Zasshi. 126:43–49. doi: https://doi.org/10.1248/yakushi.126.43
- Hasegawa N, Mori M. 2000. Effect of powdered green tea and its caffeine content on lipogenesis and lipolysis in 3T3-L1 cell. J Health Sci. 46:153–155. doi: https://doi.org/10.1248/jhs.46.153
- Hua P, Yu Z, Xiong Y, Liu B, Zhao L. 2018. Regulatory efficacy of Spirulina platensis protease hydrolyzate on lipid metabolism and gut microbiota in high-fat diet-fed rats. Int J Mol Sci. 19:4023. doi: https://doi.org/10.3390/ijms19124023
- Huang K, Liang XC, Zhong YL, He WY, Wang Z. 2015. 5-Caffeoylquinic acid decreases diet-induced obesity in rats by modulating PPARα and LXRα transcription. J Sci Food Agric. 95:1903–1910. doi: https://doi.org/10.1002/jsfa.6896
- Hussein MA, Ali HA, Ahmed MM. 2015. Ameliorative effects of phycocyanin against gibberellic acid induce hepatotoxicity. Pest. Biochem Physiol. 119:28–32.
- Hussein MMA, El-Belbasi HI, Morsy MA, Saadeldin IM, Alshammari GM. 2020. The synergistic effect of fenretinide and metformin to achieve a decrease in insulin resistance and inflammatory mediators: an in vivo study. Front Life Sci. 13:108–119.
- Keith SW, Redden DT, Katzmarzyk PT, Boggiano MM, Hanlon EC, Benca RM, Ruden D, Pietrobelli A, Barger JL, Fontaine KR, et al. 2006. Putative contributors to the secular increase in obesity: Exploring the roads less traveled. Int J Obes (Lond). 30:1585–1594. doi: https://doi.org/10.1038/sj.ijo.0803326
- Kozuma K, Tsuchiya S, Kohori J, Hase T, Tokimitsu I. 2005. Antihypertensive effect of green coffee bean extract on mildly hypertensive subjects. Hypertens Res. 28(9):711–718. doi: https://doi.org/10.1291/hypres.28.711
- Kurdikeri SM. 2006. Effect of spirulina on lipid profile of hyperlipidemics [master’s thesis]. Dharwad (India): University of Agricultural Sciences.
- Lau DC, Douketis JD, Morrison KM, Hramiak IM, SharmaKeith SW, Redden DT, Katzmarzyk PT. 2007. Putative contributors to the secular increase in obesity: Exploring the roads less traveled. Int J Obes (Lond). 30:1585–1594.
- Layam A, Reddy CLK. 2006. Antidiabetic property of Spirulina. Diabetol Croat. Diabetol Croat. 35:29–33.
- Livak KJ, Schmittgen TD. 2001. Analysis of relative gene expression data using real-time quantitative PCR and the 2(-delta C (T)) method. Methods. 25(4):402–408. doi: https://doi.org/10.1006/meth.2001.1262
- Lopez-Garcia E, van Dam RM, Rajpathak S, Willett WC, Manson JE, Hu FB. 2006. Changes in caffeine intake and long-term weight change in men and women. Am J Clin Nutr. 83:674–680. doi: https://doi.org/10.1093/ajcn.83.3.674
- Ma Y, Gao M, Liu D. 2015. Chlorogenic acid improves high fat diet-induced hepatic steatosis and insulin resistance in mice. Pharm Res. 32:1200–1209. doi: https://doi.org/10.1007/s11095-014-1526-9
- Mani UV, Desai S, Iyer UM. 2000. Studies on long term effect of Spirulina supplementation on serum lipid profile and glycated proteins in NIDDM patients. J Nutraceut Funct Medical Foods. 2:25–32. doi: https://doi.org/10.1300/J133v02n03_03
- Meng S, Cao J, Feng Q, Peng J, Hu Y. 2013. Roles of chlorogenic acid on regulating glucose and lipids metabolism: A review. Evid Based Complement Alternat Med. 2013:801457.
- Meng SX, Liu Q, Tang YJ, Wang WJ, Zheng QS, Tian HJ, Yao DS, Liu L, Peng JH, Zhao Y, et al. 2016. A recipe composed of Chinese herbal active components regulates hepatic lipid metabolism of NAFLD in vivo and in vitro. BioMed Res Int. 2016:1026852.
- Moradi S, Ziaei R, Foshati S, Mohammadi H, Nachvak SM, Rouhani MH. 2019. Effects of Spirulina supplementation on obesity: a systematic review and meta-analysis of randomized clinical trials. Complement Ther Med. 47:102211. doi: https://doi.org/10.1016/j.ctim.2019.102211
- Nagaoka S, Shimizu K, Kaneko H, Shibayama F, Morikawa K, Kanamaru Y, Otsuka A, Hirahashi T, Kato T. 2005. A novel protein C-phycocyanin plays a crucial role in the hypocholesterolemic action of Spirulina platensis concentrate in rats. J Nutr. 135:2425–2430. doi: https://doi.org/10.1093/jn/135.10.2425
- Nair AB, Jacob S. 2016. A simple practice guide for dose conversion between animals and human. J Basic Clin Pharm. 7(2):27–31. doi: https://doi.org/10.4103/0976-0105.177703
- Nikpayam O, Najafi M, Ghaffari S, Jafarabadi MA, Sohrab G, Roshanravan N. 2019. Effects of green coffee extract on fasting blood glucose, insulin concentration and homeostatic model assessment of insulin resistance (HOMA-IR): a systematic review and meta-analysis of interventional studies. Diabetol Metabol Synd. 11:91. doi: https://doi.org/10.1186/s13098-019-0489-8
- Ochiai R, Jokura H, Suzuki A, Tokimitsy I, Ohishi M, Kokai N. 2004. Green coffee bean extract improves human vasoreactivity. Hypertens Res. 27:731–737. doi: https://doi.org/10.1291/hypres.27.731
- Osborn O, Olefsky JM. 2012. The cellular and signaling networks linking the immune system and metabolism in disease. Nat Med. 18(3):363–374. doi: https://doi.org/10.1038/nm.2627
- Pilch PF, Bergenhem N. 2006. Pharmacological targeting of adipocytes/fat metabolism for treatment of obesity and diabetes. Mol Pharmacol. 70(3):779–785. doi: https://doi.org/10.1124/mol.106.026104
- Santana-Gálvez J, Cisneros-Zevallos L, Jacobo-Velázquez DA. 2017. Chlorogenic acid: recent advances on its dual role as a food additive and a nutraceutical against metabolic syndrome. Molecules. 22:E358. doi: https://doi.org/10.3390/molecules22030358
- Shimoda H, Seki E, Aitani M. 2006. Inhibitory effect of green coffee bean extract on fat accumulation and body weight gain in mice. BMC Complement Altern Med. 6:19. doi: https://doi.org/10.1186/1472-6882-6-9
- Suzuki A, Fujii A, Jokura H, Tokimitsu I, Hase T, Saito I. 2008. Hydroxyhydroquinone interferes with the chlorogenic acid-induced restoration of endothelial function in spontaneously hypertensive rats. Am J Hypertens. 21:23–27. doi: https://doi.org/10.1038/ajh.2007.3
- Takahashi N, Senda M, Lin S, Goto T, Yano M, Sasaki T, Murakami S, Kawada T. 2011. Auraptene regulates gene expression involved in lipid metabolism through PPARα activation in diabetic obese mice. Mol Nutr Food Res. 55:1791–1797. doi: https://doi.org/10.1002/mnfr.201100401
- Tanaka K, Nishizono S, Tamaru S, Kondo M, Shimoda H, Tanaka J, Okada T. 2009. Anti-obesity and hypotriglyceridemic properties of coffee bean extract in SD rats. Food Sci Technol Res. 15(2):147–152. doi: https://doi.org/10.3136/fstr.15.147
- Torres-Durán PV, Miranda-Zamora R, Paredes-Carbajal MC, Mascher D, Blé-Castillo J, Díaz-Zagoya JC, Juárez-Oropeza MA. 1999. Studies on the preventive effect of Spirulina maxima on fatty liver development induced by carbon tetrachloride, in the rat. J Ethnopharmacol. 64(2):141–147. doi: https://doi.org/10.1016/S0378-8741(98)00120-2
- Wieland H, Siedel D. 1983. A simple specific method for precipitation of low density lipoprotein. J Lipid Res. 24(7):904–909.
- Wilson PW, Zech LA, Gregg RE, Schaefer EJ, Hoeg JM, Sprecher DL, Brewer HB Jr. 1985. Estimation of VLDL cholesterol in hyperlipidemia. Clin Chim Acta. 151(3):285–291. doi: https://doi.org/10.1016/0009-8981(85)90091-9
- Yukawa GS, Mune M, Otani H, Tone Y, Liang XM, Iwahashi H, Sakamoto W. 2004. Effects of coffee consumption on oxidative susceptibility of low-density lipoproteins and serum lipid levels in humans. Biochemistry (Mosc). 69(1):70–74. doi: https://doi.org/10.1023/B:BIRY.0000016354.05438.0f
- Zhao B, Cui Y, Fan X, Qi P, Liu C, Zhou X, Zhang X. 2019. Anti-obesity effects of Spirulina platensis protein hydrolysate by modulating brain-liver axis in high-fat diet fed mice. PLoS One. 14:e0218543–e0218543. doi: https://doi.org/10.1371/journal.pone.0218543
- Zheng GY, Qiu QF, Zhang LD, Li D. 2014. Chlorogenic acid and caffeine in combination inhibit fat accumulation by regulating hepatic lipid metabolism-related enzymes in mice. Br J Nutr. 28(6):1034–1040. doi: https://doi.org/10.1017/S0007114514001652
- Zheng G, Sayama K, Okubo T, Juneja LR, Oguni I. 2004. Anti-obesity effects of three major components of green tea, catechins, caffeine and theanine, in mice. In Vivo. 18:55–62.