
Abstract
Dendrobium officinale caulis is the dried mature stems (Mat) of D. officinale Kimura et Migo. D. officinale protocorms (DOPs) are the conical embryonic tissues formed after seed germination. Previous studies suggest that these different plant parts possess similar pharmacological activities. However, the metabolic profiles and gene expression across different growth stages of D. officinale remain unknown. In this study, metabolome analysis based on GC and LC/MS/MS was carried out to assess the metabolic profile of both DOPs and Mat. Transcriptome analysis was used to reveal internal relationships between metabolites and the differing gene regulation. The results indicated that although DOPs and Mat had a similar chemical composition, they exhibited different patterns of content. GO classification and KEGG clustering of the differentially expressed genes (DEGs) between DOPs and Mat demonstrated that gene enrichment was mainly related to flavonoid biosynthetic and metabolic processes, carbohydrate metabolic processes, and polysaccharide catabolic processes. An alteration in gene expression related to specific metabolic pathways offered a probable explanation for the observed differences in metabolites between DOPs and Mat. This work provides a foundation for subsequent studies regarding the biosynthetic pathways of related metabolites from D. officinalis.
1. Introduction
Dendrobium officinale Kimura et Migo belongs to the Orchidaceae family; it is an important herb that has both ornamental value and is understood to have a broad range of therapeutic effects in many Asian countries (Bulpitt et al. Citation2007). In China, D. officinale is used for maintaining tonicity of the stomach and promoting body fluid production (Cui et al. Citation2015). The fresh stems of D. officinale can be consumed orally or used as a soup or tea stock. The stems of triennial D. officinale are regarded as the most appropriate tissues for medicinal usage (Figure A1).
D. officinale grown naturally in the wild has been listed as a national key protected medicinal plant in China. This protected status has been necessary because the plant has been overexploited during the past few decades. The situation has been made worse due to the long growth cycle and harsh growing environment of this species (Kong et al. Citation2015). Therefore, studies on the sustainability of D. officinale are urgently needed and now draw a vast and continuous attention from researchers. In recent years, tissue culture and rapid propagation technology for D. officinale have been greatly improved and this has eased some of the urgent demand. At the same time, attention has been paid to the development of alternative substances from D. officinale. D. officinale protocorms (DOPs) are analogous to somatic embryos, which can be induced from explants of Dendrobium and are used for micropropagation in in vitro plant culture systems. Reports indicate that the pharmacological activities of DOPs are similar to those of its mature stems (Mat); these include immune-enhancing (Gao et al. Citation2002), antibacterial (Wang et al. Citation2016), anticancer, and antioxidant effects (Tie-Guang et al. Citation2007). DOPs are analogous to Mat in terms of their morphological and metabolic evolution, as well as their metabolic potency. Accordingly, DOPs might represent an alternative resource of D. officinale for medicinal purposes. Furthermore, in our previous study, we investigated the antiphotoaging activity of DOPs using a hairless mouse model with skin damaged by UV irradiation. The results suggested that DOPs could be used as a potential therapeutic agent to protect skin against UV-induced photoaging (Mai et al. Citation2019).
Researchers’ attention has been drawn to the chemical composition and pharmacological effects of D. officinale in recent years. Polysaccharides and flavonoids are important pharmacology-related chemical components within D. officinale that are essential for both biological and pharmacological activities. Polysaccharides with extensive pharmaceutical activities are ubiquitous among Dendrobium species. Modern pharmacological research has revealed that D. officinale and its polysaccharide fraction exhibit anticancer, hepatoprotective, hypolipidemic, antifatigue, antioxidant, anticonstipation, hypoglycemic, gastric ulcer-protective, and antihypertensive effects, as well as immune-boosting properties (Lv et al. Citation2013; Pan et al. Citation2014; He et al. Citation2016; Huang et al. Citation2016; Luo et al. Citation2016). Flavonoids have been widely developed within the pharmaceutical industry and serve as excellent chemical markers for quality control of medicinal plants (Cao et al. Citation2013; Kroslakova et al. Citation2016) that produce a range of phytochemicals with diverse biological functions. In this study, we used a comprehensive approach to examine differences in composition and gene regulation in polysaccharides and flavonoids between DOPs and Mat; we also identified several genes related to the biosynthesis of these compounds using transcriptome analysis.
The chemical constituents within medicinal herbs are largely responsible for their pharmacodynamic effects. However, little is known about the metabolic differences between DOPs and Mat. Furthermore, the molecular basis of these differences remains poorly understood. Therefore, in the current study, we attempted to elucidate these differences by comparing the transcriptomes and metabolomes of DOPs and Mat.
2. Materials and methods
2.1. Materials
D-Mannose, L-rhamnose, D-glucose, D-xylose, D-galactose, L-arabinose, hydroxyl ammonium chloride, pyridine, acetic oxide, and H2SO4 were purchased from ZHANKE Instrument Co. Ltd.
Analytical reference standards, including schaftoside, isoschaftoside, rutin, eriodictyol, naringenin, apigenin, isorhamnetin, quercetin, and quercitrin, with 98% purity were also purchased from ZHANKE Instrument Co. Ltd.
In addition, absolute ethyl alcohol, glacial acetic acid, isopropanol, chloroform, perchloric acid, hydrochloric acid, sodium hydroxide, sodium acetate, ninhydrin, triethylamine, phenyl isothiocyanate, hydroxylamine hydrochloride, pyridine, acetic anhydride, concentrated sulfuric acid, barium carbonate, and petroleum ether of analytical purity were also purchased from ZHANKE Instrument Co. Ltd. HPLC grade methanol and acetonitrile were purchased from Merck.
2.2. Plant materials
D. officinale Mat and DOPs were obtained from Chaozhou MaoFengYuan Co., Ltd. Guangdong province, China. Plant materials were frozen and then freeze-dried, crushed into fine powder, and stored at −4°C for further use. Fresh plant materials were subjected to transcriptome analysis. For sampling, DOPs and Mat were separately collected from six biological replicates, immediately frozen in liquid nitrogen, and stored in −80°C freezers for further analysis. We defined these repetitions at two development stages as DOPs_1, 2, 3, 4, 5, 6, and Mat_1, 2, 3, 4, 5, 6.
2.3. RNA extraction and library preparation for transcriptome sequencing
Total RNA was extracted using an RNAprep Pure Plant Kit according to the manufacturer’s instructions (Tiangen Biochemical Technology Company, Beijing, China). The integrity and quantity of the RNA samples were analyzed by 1% agarose gel electrophoresis using a NanoDrop 2000 Spectrophotometer (Thermo Scientific, USA). Qualified RNA samples (OD260/280 = 1.8∼2.2, OD260/230 ≥ 2.0, RIN ≥6.5, 28S:18S ≥1.0, >2 µg) were immediately frozen at −80°C until use. To analyze the transcriptome, 2 µg of qualified RNA samples were sent to Majorbio (Shanghai, China) for cDNA library construction, and for sequencing on an Illumina HiSeq X Ten System (Illumina Inc., San Diego, CA, USA). As a result, paired-end (PE) reads were generated and checked using FASTX-Toolkit v. 0.0.14 software (http://hannonlab.cshl.edu/fastx_toolkit/) to assess sequence quality.
2.4. Data filtering, mapping of reads, and functional annotation
In order to ensure the accuracy of subsequent analyses, the raw reads were filtered to obtain high-quality reads using SeqPrep (https://github.com/jstjohn/SeqPrep) and Sickle (https://github.com/najoshi/sickle) software. The processes included removing adapter sequences in the reads, removing reads without inserts due to the connector self-connection, trimming bases with a quality score < Q20, and finally, reads with a final length <30 bp and N-containing (module base) reads were removed. Then, using Bowtie 2 software (http://bowtie-bio. source forge. net/bowtie2/index.shtml), a reference genome index was established, and clean reads were mapped to the reference genome (http://202.203.187.112/herbalplant) using Tophat2 software (http://ccb.jhu.edu/software/tophat/index.shtml).
2.5. Differentially expressed gene enrichment analysis
Raw counts were statistically analyzed using the DESeq2 v. 1.10.1 software based on the negative binomial distribution. Subsequently, the levels of gene expression were standardized by reads per kilobase per million reads (RPKM) using RSEM v1.2.15 software (http://deweylab.github.io/RSEM/) with the default parameters. Unigenes with differential expression between the groups were obtained with the parameters of p-adjust < 0.05 and |log2FC| ≥ 1. Kyoto Encyclopedia of Genes and Genomes (KEGG) enrichment analysis of the DEGs was performed using KOBAS v. 2.1.1 (http://www.genome.jp/kegg/). Gene Ontology (GO) (http://geneontology.org/) functional enrichment analysis was also performed on the DEGs.
2.6. Quantitative real-time PCR validation of the RNA-seq data
Using the TransStar Tip Green qPCR SuperMix (TransGen Biotech, Beijing, China) and the CFX96 Touch Deep Well platform (Bio-Rad, USA), quantitative real-time PCR (qRT-PCR) was conducted. The total reaction volume was 20 µL, comprising 2 µL of cDNA, 10 µL of the Tip Green qPCR Supermix, 0.4 µL of 10 µM primers and 7.2 µL of nuclease-free water. Unigenes that were selected for quantitation included LOC110110417 (Do_sucrose synthase), LOC110092501 (DootsA), LOC110105805 (DootsB), LOC110094182 (DoTREH), LOC110097837 (Doendoglucanase), LOC110105225 (Dobglu), LOC110113575 (DoC4H), LOC110093394 (DoHCT), LOC110110632 (DoC3H), LOC110107833 (DoCHS), LOC110101536 (DoCHI), and LOC110115941 (D0F3H). The β-actin gene (AGA17037.1) and β-tubulin gene (KX524085.1) were used as reference genes. The coding sequences of all 14 genes are listed in Text A2. Primers were designed using Primer Premier 5 software, and all primer sequences are listed in Table A3. The qRT-PCR procedure was as follows: 94°C for 5 min; 94°C for 5 s, 60°C for 15 s, and 72°C for 10 s; this was repeated for 40–45 cycles. Expression levels were evaluated using the 2-ΔΔCt method and the Ct values for all genes were normalized to the Ct value of β-actin and β-tubulin (Gharbi et al. Citation2015).
2.7. Preparation of polysaccharide and monosaccharide test solutions
Total polysaccharides were identified using a UV-spectrophotometer with glucose as the control. Monosaccharides were quantified by gas chromatography (GC), as described below. Three milliliters of polysaccharide extracts mixed with 5 mL 0.25M H2SO4 were hydrolyzed in a 110°C oven for 4 h, neutralized by excess BaCO3, and then centrifuged (3000 rpm, 10 min). The supernatant was dried and served as the testing substance. Derivatization was performed by adding the testing substance, 10 mg hydroxyl ammonium chloride, 5 mg internal standard substance, and 2 mL pyridine in a 25 mL flask, and allowing the reaction to proceed for 30 min at 90°C. After this, 1.0 mL of acetic oxide was added to the reaction mixture for another 30 min of derivatization. The derivatization solution was subjected to GC analysis.
GC conditions were as follows: the oven was temperature-programmed from 120°C (4 min) to 180°C, increased from 180°C to 210°C at 2°C/min, held at 210°C for 4 min, and finally raised to 250°C at the rate of 3°C/min and held for 3 min. The injector was used in split mode with a split ratio of 20:1, an injection volume of 1.0 µL, and an inlet temperature of 250°C.
2.8. Preparation of flavonoid test solution
Total flavonoids were quantified using a UV spectrophotometer with rutin as a control. Individual flavonoids were determined by LC-MS/MS and the details of the method are provided below.
Individual stock solutions (about 0.2 mg/mL) and diluted mix standards were prepared in methanol. For validation purposes, a working standard solution mixture at about 1.0 µg/mL was prepared in a volumetric flask from stock solutions of particular analytical standards.
Next, 3.0 g of powdered sample with 50 mL of 70% ethyl alcohol was reflux extracted twice for 2 h each. The extracts were concentrated and evaporated to dryness, and then purified by passing through a polyamide column. The flavonoid-rich eluent was dried using a rotary evaporator, after which the residue was re-dissolved in 25 mL methanol and stored at 4°C before LC-MS/MS analysis.
Chromatographic separations were performed on a Waters LC-MS/MS system (Waters, USA). Mobile phases consisted of (A) ultrapure water with 0.1% formic acid and (B) methanol. The gradient profile was obtained as follows: 5%–55% B for 0–2 min; 55%–60% B for 2–8 min; 60%–100% B for 8–10 min, and then held for 1 min; returning to 5% B in 11–12 min; and finally re-equilibrating between 12–15 min. The flow rate of the mobile phase was 0.3 mL/min. The UV detection wavelength was 254 nm. MS was performed in negative ion mode with a heater temperature of 350°C, ion source voltage of 3000 V, ion source temperature of 100°C, cone voltage of 40 V, source offset of 80 V, cone gas of 50 L/h, and desolvation gas of 550 L/h.
3. Results
3.1. Profiling of major chemical constituents
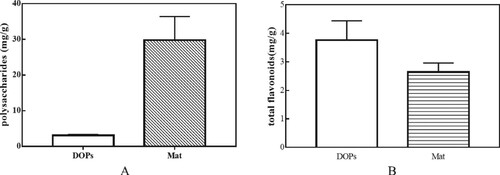
Total polysaccharide and total flavonoid contents of both DOPs and Mat were determined using a UV-spectrophotometer (Figure ). The total polysaccharide content of Mat was almost 10 times higher than that of DOPs; in contrast, the total flavonoid content showed precisely the opposite trend, being higher in DOPs (3.759 ± 0.619 mg/g) than in Mat (2.642 ± 0.290 mg/g).
Figure 1. Total flavonoid content of DOPs and Mat. A Total polysaccharide content of DOPs and Mat. B Total flavonoid content of DOPs and Mat.
The results showed that DOPs and Mat were both comprised of polysaccharides and flavonoids, but with distinguishable accumulation patterns. We assumed that the composition of monosaccharides and flavonoids was variable in DOPs and Mat. To validate this assumption, we utilized GC to determine the content of monosaccharides that were hydrolyzed from the polysaccharides (Figure ). Further, liquid chromatography tandem mass spectrometry (LC-MS/MS) was used to analyze the content of individual flavonoids (Figure ); the results are summarized in Table .
Figure 2. Gas chromatograms of monosaccharides hydrolyzed from the polysaccharides of DOPs and Mat. A Negative control. B Standard mixture. C DOPs. D Mat. 1. Xylose, 2. Arabinose, 3. Rhamnose, 4. Mannose, 5. Glucose, 6. Galactose, 7. Internal standard (Inositol hexaacetate).
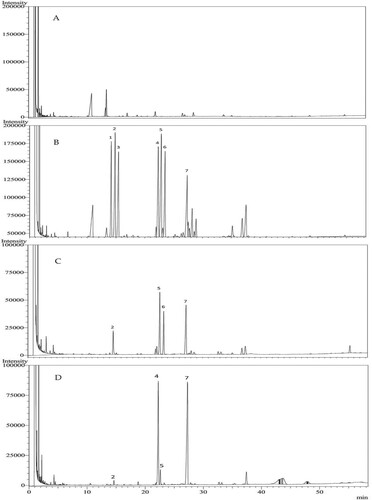
Figure 3. Ion mass spectrum of individual flavonoid.
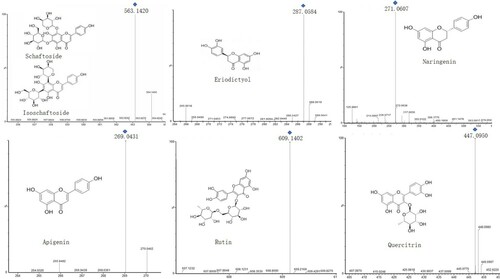
Table 1. The content of monosaccharides and individual flavonoids of DOPs and Mat (n = 6).
As shown in Figure , the types of monosaccharides constituting each polysaccharide and their contents differed between DOPs and Mat. The main monosaccharides constituting the polysaccharides of DOPs were glucose (5.273 ± 2.509 mg/g), galactose (5.835 ± 3.406 mg/g), and arabinose (2.647 ± 1.158 mg/g). At the same time, the main monosaccharides of Mat were mannose (32.569 ± 12.552 mg/g) and glucose (2.833 ± 0.928 mg/g); this was consistent with the Chinese Pharmacopoeia (Citation2015) standard.
Column-chromatography-enriched flavonoids from two sets of samples were analyzed using LC-MS/MS. The structural characterization of these compounds was based on registered mass spectra fragmentation patterns and previous reports (Lv et al. Citation2017), along with flavonoid standard substance confirmation.
Seven flavonoids were identified in both DOPs and Mat, namely schaftoside, isoschaftoside, eriodictyol, naringenin, apigenin, rutin, and quercitrin (as shown in Figure ). The differences in flavonoid type and content between DOPs and Mat are shown in detail in Table . Interestingly, although the composition of total flavonoids was similar in both DOPs and Mat, their abundance was different. The major flavonoids in DOPs were rutin (79.505 ± 13.191 µg/g) and schaftoside (11.095 ± 1.749 µg/g), while the main two flavonoids in Mat were rutin (81.682 ± 6.613 µg/g) and naringenin (49.419 ± 7.303 µg/g). Although some of these flavonoids, such as rutin, naringenin, apigenin, and quercitrin, have been identified in previous studies, their levels of accumulation were not consistent with those determined in the present work (Lv et al. Citation2017).
3.2. Transcriptome profiling
To elucidate the differences in gene expression patterns between the two developmental stages, 12 mRNA libraries were constructed and sequenced using an Illumina HiSeq 2000 platform, with six biological replicates of both DOPs and Mat (DOPs_1 to 6; Mat_1 to 6). Pair-wise Pearson’s correlation coefficients of these samples indicated reasonably high yield and good reproducibility among biological replicates (Figure A).
Figure 4. Characterization of transcriptome sequencing data of DOPs and Mat. A Pair-wise Pearson’s correlation coefficients of the sequencing data from DOPs and Mat. B Gene structure and distribution pattern. C Heat map of gene expression.
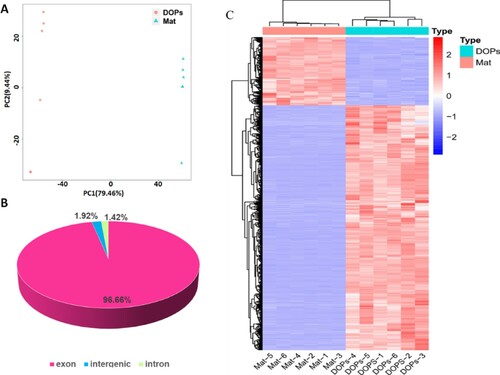
After removing low-quality reads and adaptor sequences, more than 11 million high-quality reads per sample were retained for quantification of unigenes, with GC content ranging from 46.41% to 48.96%. The retained reads were mapped against the reference genome sequence of D. officinale, with mapping rates >88%, while unique mapping rates ranged from 84.1%∼86.8%. From these high-quality clean reads, means of 20,549 and 19,932 unigenes were generated for subsequent analysis from DOPs and Mat, respectively (Table A4, A5).
Gene structure analysis showed that most of those mapped reads were distributed in exons (96.66%, Figure B). DOPs and Mat showed a significant difference in gene expression pattern (Figure C). Genes from DOPs and Mat could be classified into two sub-clusters, the expression patterns of which were completely different.
3.3. Functional annotation of DEGs
The RNA-Seq data were normalized to RPKM values to quantify transcript expression. Only genes with significant differences in expression (p < 0.05 and fold-change >2 or <0.05) were defined as DEGs. Accordingly, 1,842 DEGs were obtained from all 12 sequencing libraries in our study; among these, 1,441 genes were up-regulated while 401 genes were down-regulated in DOPs.
To further identify their biological functions, these DEGs were subjected to GO enrichment analysis. GO is a model biological framework that defines concepts used to describe gene function, and relationships between these concepts (Ana et al. Citation2005; Sato et al. Citation2019; Wang et al. Citation2019). Based on sequence homology, DEGs were assigned to three general categories: cellular component (CC), molecular function (MF), and biological process (BP). A bar plot was used to show the top 10 most enriched GO terms for each category. Integral components of membranes and plasma membranes represented the major proportion of the cellular component categories, while the oxidation–reduction process showed the greatest representation among the various biological processes. In regard to the molecular function categories, the most enriched GO term belonged to DNA binding transcription factor activity (Figure A, Table A6).
Figure 5. Functional enrichment analysis for unigenes A GO enrichment analysis of DEGs in the two groups. B KEGG enrichment analysis of DEGs in the two groups. BP: biological process. CC: cellular component. MF: molecular function.
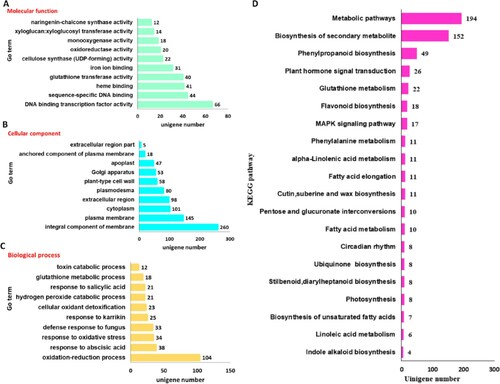
In addition, DEGs were mapped to the KEGG database in order to elucidate their biological functions (Liang et al. Citation2019; Miao et al. Citation2019; Zhou et al. Citation2019). The top 20 most enriched pathways are shown in Figure B and Table A7. Genes involved in metabolic pathways, biosynthesis of secondary metabolites, and phenylpropanoid biosynthesis comprised the greatest number of DEGs, with a minimum q-value observed.
3.4. Expression pattern of relevant metabolic pathways
Previous studies have shown that polysaccharides and flavonoids are responsible for the pharmacological activities of D. officinale. The quantification data from our study suggested that the abundance of specific components varied between DOPs and Mat. Furthermore, a general comparison of the transcriptomes of DOPs and Mat was performed. On this basis, further dissection of the underlying DEGs and their expression patterns in the corresponding polysaccharide and flavonoid metabolic pathways was required.
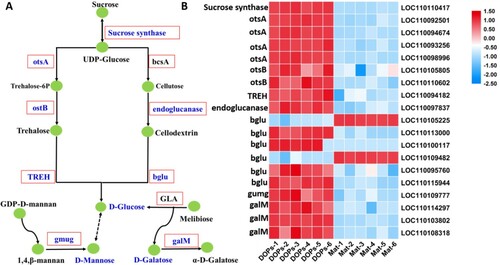
According to the metabolic pathways analyzed by KEGG, combined with the monosaccharides identified in DOPs and Mat in this study, a final schema summarizing the carbohydrate metabolomic pathways of DOPs and Mat are shown in Figure A. In addition, the expression pattern of DEGs related to polysaccharide biosynthesis is displayed as a heat map in Figure B, while the expression data are shown in Table A8. As illustrated in Figure B, the gene expression pattern of polysaccharides in DOPs and Mat was obviously different. A total of 15 DEGs were annotated as polysaccharide biosynthesis-related genes, 13 of which were significantly up-regulated in DOPs. We found that the expression of a sucrose synthase-encoding gene, whose product is involved in converting sucrose into UDP-glucose, was much higher in DOPs than in Mat. UDP-glucose is converted into trehalose and ultimately glucose. These substrates are eventually converted into glucose for plant growth and development.
Figure 6. Genes related to polysaccharide biosynthetic pathways in D. officinale. A Schematic diagram of the polysaccharide biosynthetic pathway drawn according to the KEGG database. Red boxes represent enzymes, while green circles represent metabolites. Enzymes and metabolites identified in this study were highlighted in blue color. Dotted arrows indicated more than one enzymes needed, while solid arrows were the opposite. OtsA: trehalose 6-phosphate synthase. bcsA: cellulose synthase (UDP-forming). otsB: trehalose 6-phosphate phosphatase. TREH: alpha, alpha-trehalose. bglu: Beta-glucosidase. B Heat map showing the expression levels of unigenes in the DOPs and Mat comparison.
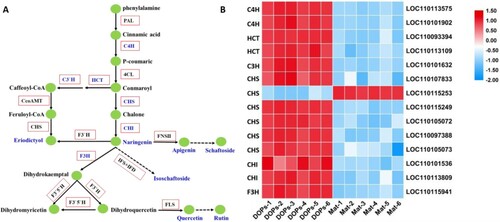
Based on the metabolic pathways analyzed by KEGG, combined with the flavonoids identified in DOPs and Mat in this study, a final schema summarizing the flavonoid metabolomic pathways of DOPs and Mat are shown in Figure A. The expression patterns of DEGs related to flavonoid biosynthesis are displayed as a heat map in Figure B, with data shown in Table A9. The results indicated that 14 DEGs were annotated as flavonoid biosynthesis-related genes, 13 of which were significantly up-regulated in DOPs. Interestingly, all the differentially expressed genes were those upstream of the flavonoid synthesis pathway. A number of DEGs (six out of 14) were annotated as CHS (chalcone synthase), which catalyzes the synthesis of eriodictyol from feruloyl-CoA as well as the conversion of conmaroyl into chalcone. Chalcone is transformed into naringenin through CHI (chalcone isomerase) catalysis in the metabolic pathway of flavonoids, CHS catalyzes the first step of the reaction, and CHI is the second step of the catalysis. The expression levels of these two genes directly affect the abundance of flavonoid metabolites, which also provides an explanation for the higher total flavonoid content in DOPs over Mat. Furthermore, among the six annotated CHS, only one was upregulated in Mats compared to DOPs. Since no eriodictyol was detected in DOPs, we speculate that this CHS may use feruloyl-CoA as a substrate and catalyze its conversion to eriodictyol in Mats.
Figure 7. Genes related to flavonoid biosynthesis pathways in D. officinale. A Schematic diagram of the flavonoid biosynthetic pathway drawn according to the KEGG database. Red boxes represent enzymes, while green circles represent metabolites. Enzymes and metabolites identified in this study were highlighted in blue color. Dotted arrows indicated more than one enzymes needed, while solid arrows were the opposite. PAL: phenylalanine ammonia lyase. C4H: cinnamate 4-hydroxylase. 4CL: 4-coumarate CoA ligase. HCT: shikimate O-hydroxycinnamoyl-transferase. C3’H: coumaroylquinate 3’-monooxygenase. CCoAMT: caffeoyl-CoA O-methyl-transferase. CHS: chalcone synthase. CHI: chalcone isomerase. F3H: flavanone 3-hydroxylase. F3’H: flavonoid 3’-hydroxylase. F3’5’H: flavonoid 3’,5’-hydroxylase. FLS: flavonol synthase. DFR, dihydroflavonol 4-reductase. ANR: anthocyanidinreductase. ANS: leucoanthocyanidin dioxygenase. LAR: leucoanthocyanidin reductase. B Heat map showing the expression levels of unigenes in the DOPs and Mat comparison.
Overall, the observed differences in the expression patterns of genes in the flavonoid and polysaccharide biosynthetic pathways between DOPs and Mat might play a key role in the differences found in their composition.
3.5. Quantitative real-time PCR (qRT-PCR) validation of DEGs from the RNA-Seq analysis
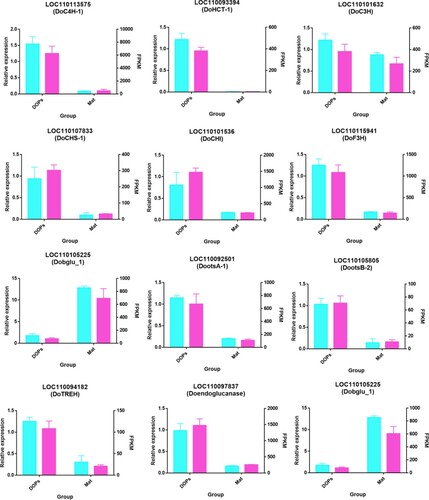
In order to verify the accuracy of the RNA-Seq data, qRT-PCR analysis was conducted to analyze the expression patterns of unigenes related to flavonoid and polysaccharide biosynthesis. The genes selected for quantitative analysis included six genes related to flavonoid biosynthesis and six genes involved in polysaccharide biosynthesis. The expression patterns of all selected genes were similar to those revealed by the RNA-Seq data, which indicated that the results of the transcriptome sequencing analysis in this study were accurate and reliable (Figure ).
Figure 8. qRT-PCR validation of DEG expression from the RNA-seq data. The FPKM data of the unigenes are shown in blue bars, while the red bars indicate the qPCR results. The left Y-axis represents the relative expression calculated by qRT-PCR, and the right Y-axis represents the FPKM value of the RNA sequencing data. The β-actin gene (AGA17037.1) and β-tubulin gene (KX524085.1) were used as housekeeping genes, while the qPCR-data normalized with β-tubulin were shown in supplementary Figure .
4. Discussion
Dendrobium officinale, also known as Tiepi Shihu in Chinese, is a well-known herb in Traditional Chinese Medicine and has been used for more than 2,000 years. Furthermore, this important species has been listed as a health food by the National Health Commission of the People’s Republic of China (He et al. Citation2017; Chen et al. Citation2018; Zhao et al. Citation2019). In the current study, we used a comprehensive approach to examine differences in composition and gene regulation of polysaccharides and flavonoids between DOPs and Mat; in addition, we identified several genes related to the biosynthesis of these compounds using transcriptome analysis.
4.1. Identification of genes associated with polysaccharide metabolism in DOPs and Mat
Approximately 190 compounds have been isolated from D. officinale to date. Among these, flavonoids and polysaccharides are the most abundant. Polysaccharides and their derivatives are essential for a healthy human immune system, reproductive system, disease prevention, blood coagulation, and growth and development (Graphic Records of Dendrobium officinale in China Citation2005).
The current study suggested that the content of polysaccharides and monosaccharides varied between DOPs and Mat. Mat polysaccharides were more abundant than those of DOPs, while the abundance of individual monosaccharides was also different. Monosaccharides, especially glucose, are the main source of energy for metabolism. In plants, excess glucose is converted into space-efficient polysaccharides, usually as starch. The intensive synthesis and differentiation activities of DOPs consume a great amount of energy, leading to low levels of polysaccharide accumulation. Whereas Mat represents a stable developmental stage with a lower growth rate, but greater polysaccharide accumulation (e.g. cellulose, pectin, and starch). This also provides a possible explanation as to why the polysaccharides in DOPs were not as abundant as in Mat, although polysaccharide-related pathways were more active in DOPs. Our results showed that the polysaccharide content in DOPs was much lower than that in Mat, which is consistent with previous studies showing that the wild type contains higher amounts of polysaccharides than the cultivated type (Shang Citation2010).
As outlined in the quality control of D. officinale in accordance with the quality control guidelines in the Chinese Pharmacopoeia (Citation2015), polysaccharides have various pharmacological activities. Previous reports indicate that these activities are closely linked to the composition and content of the corresponding monosaccharides (Xing et al. Citation2015). As our results showed that mannose, which is also listed as a quality control component for D. officinale in Chinese Pharmacopoeia, was the key monosaccharide in Mat. However, no mannose was detected in DOPs. The most abundant monosaccharide in DOPs was galactose, which was not detected in Mat. Therefore, we speculated that DOPs and Mat also differed in terms of their type of polysaccharide.
Differences in the polysaccharide content in DOPs and Mat (Figure B) also provided a new opportunity for analysis of the mechanism underlying polysaccharide accumulation and for the screening and validation of genes related to polysaccharide biosynthesis. The data showed that 15 of the 1,884 DEGs were associated with the starch and sucrose metabolic pathways. Most of the starch and sucrose metabolism genes (14 out of 15) were upregulated in DOPs relative to Mat, which is consistent with finding that the soluble solid content of glucose and galactose was higher in DOPs than in Mat. Nevertheless, there was a contradiction that the content of polysaccharides and mannose were much higher in Mat compared to DOPs while the expression level of genes were much lower in Mat than in DOPs. This may have been a problem with sampling, or it may be that Mat function was restricted to sugar storage with no biosynthesis taking place.
On the other hand, pre-treatment is necessary before the detection of monosaccharides based on UV-HPLC or GC, as they cannot absorb ultraviolet light. GC is more efficient in determining the types and abundance of those monosaccharides over HPLC, although the results may fluctuate due to sample pre-treatment.
4.2. Identification of genes associated with flavonoid metabolism in DOPs and Mat
Numerous plants possess specific colors to attract pollinators; many of these colors are derived from flavonoids in vivo. Flavonoids belong to a widespread group of phytochemicals with diverse biological functions in plants with applications in both the pharmaceutical industry and as chemical markers for quality control of medicinal plants (Liu et al. Citation2010; Cao et al. Citation2013; Kroslakova et al. Citation2016). Our results indicated that the total flavonoid content in DOPs was slightly higher than that of Mat. The main flavonoids in Mat were rutin and naringenin, which was consistent with previous findings (Zhou et al. Citation2018). Although there was no significant difference in the content of rutin between Mat and DOPs, the content of naringenin was nearly 25 times lower in DOPs than in Mat. Differences in the content of active ingredients may explain differences in pharmacological effects; however, detailed elucidation requires further investigation.
The flavonoid biosynthesis pathway is one of the best understood biosynthetic pathways for plant secondary metabolites, and the underlying functional genes have been systematically studied (Zou et al. Citation2016). The CHS gene encodes the first key enzyme in the plant flavonoid biosynthesis pathway, which catalyze the synthesis of eriodictyol from feruloyl-CoA as well as the conversion of conmaroyl to chalcone (Tai et al. Citation2014). The F3H gene, which catalyzes the formation of dihydroflavanone from flavanones, encodes a key enzyme in the flavonoid biosynthesis pathway, and plays an important role in controlling the biosynthesis of flavonoids and anthocyanins (Deng et al. Citation2018). All the key enzymes except one CHS gene were significantly up-regulated in DOPs, which also provides an explanation for the higher total flavonoid content in DOPs over Mat. However, it should be noted that the content of most of the individual flavonoids identified in Mats in the current study were much higher than those of the DOPs, therefore, we hypothesized that there should be other individual flavonoids in DOPs. Of the 14 DEGS involved in the biosynthesis of flavonoids, six were annotated as CHS. Many plants contain more than one CHS. For example, in a Petunia hybrid, 12 CHS genes have been cloned, including four with complete sequences, and two with partial sequences (Koes et al. Citation1986). Additionally, the model plant Arabidopsis thaliana and its related species Arabidopsis halleri have also been shown to have three CHS genes distributed on chromosomes 1, 4, and 5, respectively (Wang et al. Citation2007).
5. Conclusion
In the present study, a comparative metabolomic and transcriptome analysis of DOPs and Mat was performed for the first time. We identified the major monosaccharides and flavonoids in DOPs and Mat and compared their contents. The result indicated that the main components of DOPs and Mat were quite different. In addition, 1,884 DEGs were identified between the DOPs and Mat using transcriptome sequencing. DEGs related to flavonoid and polysaccharide metabolic pathways were assessed and used for further analysis, and their expression levels were validated by qRT-PCR. The results contribute to a deeper understanding of the relationship between gene regulation and metabolite composition of DOPs and Mat.
Acknowledgements
Open operation of Guangdong provincial key laboratory for research and development of traditional Chinese medicine and new drug. Grant number: 2017B030314096-01.
Data availability statement
The authors confirmed that the data supporting the findings of this study are available within the article and its supplementary materials. What’s more, the RNA-seq sequencing data of this study was deposited onto the China National GeneBank (https://db.cngb.org/cnsa/) with a project number of CNP0000967.
Disclosure statement
No potential conflict of interest was reported by the author(s).
Additional information
Funding
References
- Ana C, Stefan GT, Juan Miguel GG, Javier T, Manuel T, Montserrat R. 2005. Blast2GO: a universal tool for annotation, visualization and analysis in functional genomics research. Bioinformatics. 21(18):3674–3676. doi: https://doi.org/10.1093/bioinformatics/bti610
- Bulpitt CJ, Li Y, Bulpitt PF, Wang J. 2007. The use of orchids in Chinese medicine. J R Soc Med. 100(12):558–563. doi: https://doi.org/10.1177/0141076807100012014
- Cao J, Xia X, Chen X, Xiao J, Wang Q. 2013. Characterization of flavonoids from Dryopteris erythrosora and evaluation of their antioxidant, anticancer and acetylcholinesterase inhibition activities. Food Chem Toxicol. 51:242–250. doi: https://doi.org/10.1016/j.fct.2012.09.039
- Chen J, Lu J, Wang B, Zhang X, Huang Q, Yuan J, Hao H, Chen X, Zhi J, Zhao L, et al. 2018. Polysaccharides from Dendrobium officinale inhibit bleomycin-induced pulmonary fibrosis via the TGFbeta1-Smad2/3 axis. Int J Biol Macromol. 118(Pt B):2163–2175. doi: https://doi.org/10.1016/j.ijbiomac.2018.07.056
- Cui HY, Murthy HN, Moh SH, Cui Y-Y, Paek K-Y. 2015. Establishment of protocorm suspension cultures of Dendrobium candidum for the production of bioactive compounds. Horticulture Env Biotechnol 56(1):114–122. doi: https://doi.org/10.1007/s13580-015-0082-5
- Deng Y, Li C, Li H, Lu S. 2018. Identification and characterization of flavonoid biosynthetic enzyme genes in Salvia miltiorrhiza (Lamiaceae). Molecules. 23:6.
- Gao J, Jin R, Wu Y, Zhang H, Zhang D, Chang Y, Hu Z. 2002. Comparative study of tissue cultured Dendrobium protocorm with natural Dendrobium candidum on immunological function. J Chinese Medicinal Mat. 25(7):487.
- Gharbi S, Shamsara M, Khateri S, Soroush MR, Ghorbanmehr N, Tavallaei M, Nourani MR, Mowla SJ. 2015. Identification of reliable reference genes for quantification of MicroRNAs in serum samples of sulfur mustard-exposed veterans. Cell J. 17(3):494–501.
- Graphic Records of Dendrobium officinale in China. 2005.
- He TB, Huang YP, Yang L, Liu TT, Gong WY, Wang XJ, Sheng J, Hu JM. 2016. Structural characterization and immunomodulating activity of polysaccharide from Dendrobium officinale. Int J Biol Macromol. 83(10):34–41. doi: https://doi.org/10.1016/j.ijbiomac.2015.11.038
- He C, Wu K, Zhang J, Liu X, Zeng S, Yu Z, Zhang X, da Silva JA T, Deng R, Tan J, et al. 2017. Cytochemical localization of polysaccharides in Dendrobium officinale and the Involvement of DoCSLA6 in the synthesis of Mannan polysaccharides. Front Plant Sci. 8:173.
- Huang XJ, Nie SP, Cai HL, Cui SW, Xie MY, Phillips GO. 2016. Study on Dendrobium officinale O-Acetyl-Glucomannan (Dendronan): Part VII. The Immunomodulatory and antioxidant activity. J Funct Foods. 15:525–532. doi: https://doi.org/10.1016/j.jff.2015.03.054
- Koes RE, Spelt CE, Reif HJ, Elzen PJ, Van D, Veltkamp E, Mol JN. 1986. Floral tissue of Petunia hybrida (V30) expresses only one member of the chalcone synthase multigene family. Nucleic Acids Res. 14(13):5229. doi: https://doi.org/10.1093/nar/14.13.5229
- Kong D-d, Zy X, Shen H-L. 2015. Effects of interaction between moisture and light on growth photosynthetic characteristics and soluble sugar of Dendrobium officinale. J Huazhong Agri Univ. 34(05):5.
- Kroslakova I, Pedrussio S, Wolfram E. 2016. Direct coupling of HPTLC with MALDI-TOF MS for qualitative detection of flavonoids on phytochemical fingerprints. Phytochem Anal. 27(3–4):222–228. doi: https://doi.org/10.1002/pca.2621
- Liang W, Ni L, Carballar-Lejarazu R, Zou X, Sun W, Wu L, Yuan X, Mao Y, Huang W, Zou S. 2019. Comparative transcriptome among Euscaphis konishii Hayata tissues and analysis of genes involved in flavonoid biosynthesis and accumulation. BMC Genomics. 20(1):24. doi: https://doi.org/10.1186/s12864-018-5354-x
- Liu W, Kong Y, Zu Y, Fu Y, Luo M, Zhang L, Li J. 2010. Determination and quantification of active phenolic compounds in pigeon pea leaves and its medicinal product using liquid chromatography–tandem mass spectrometry. J Chromatograph A. 1217(28):4723–4731. doi: https://doi.org/10.1016/j.chroma.2010.05.020
- Luo QL, Tang ZH, Zhang XF, Zhong YH, Yao SZ, Wang LS, Lin CW, Luo X. 2016. Chemical properties and antioxidant activity of a water-soluble polysaccharide from Dendrobium officinale. Int J Biol Macromol. 89:219–227. doi: https://doi.org/10.1016/j.ijbiomac.2016.04.067
- Lv GY, Yan MQ, Chen SH. 2013. Review of pharmacological activities of Dendrobium officinale based on traditional functions. China J Chinese Materia Medica. 38(4):489–493.
- Lv C, Yang J, Kang C, Li Z, Ma Z, Guo L, Wang Y. 2017. Determination of 10 flavonoids by UPLC-MS /MS and analysis of polysaccharide contents and compositions in Dendrobii officinalis caulis from different habitats. Chinese J Exp Trad Medical Formulae. 23:47–52.
- Mai Y, Niu Z, He W, Lai X, Huang S, Zheng X. 2019. The reparative effect of Dendrobium officinale protocorms against Photodamage Caused by UV-irradiation in hairless Mice. Biol Pharm Bull. 42(5):728–735. doi: https://doi.org/10.1248/bpb.b18-00901
- Miao L, Di Q, Sun T, Li Y, Duan Y, Wang J, Yan Y, He C, Wang C, Yu X. 2019. Integrated metabolome and transcriptome analysis Provide Insights into the effects of Grafting on Fruit Flavor of Cucumber with different Rootstocks. Int J Mol Sci. 20:14. doi: https://doi.org/10.3390/ijms20143592
- Pan LH, Li XF, Wang MN, Zha XQ, Yang XF, Liu ZJ, Luo YB, Luo JP. 2014. Comparison of hypoglycemic and antioxidative effects of polysaccharides from four different Dendrobium species. Int J Biol Macromol. 64(2):420–427. doi: https://doi.org/10.1016/j.ijbiomac.2013.12.024
- Sato Y, Tezuka A, Kashima M, Deguchi A, Shimizu-Inatsugi R, Yamazaki M, Shimizu KK, Nagano AJ. 2019. Transcriptional variation in glucosinolate biosynthetic genes and inducible responses to Aphid Herbivory on field-grown Arabidopsis thaliana. Front Genet. 10:787. doi: https://doi.org/10.3389/fgene.2019.00787
- Shang X. 2010. Study on the distribution of polysaccharides in different sources and different parts of Dendrobium candidum. Chinese J Modern Drug Appl. 04:104–105.
- Tai D, Tian J, Zhang J, Song T, Yao Y. 2014. A Malus crabapple chalcone synthase gene, McCHS, regulates red petal color and flavonoid biosynthesis. PloS one. 9(10):e110570. doi: https://doi.org/10.1371/journal.pone.0110570
- Tie-Guang HE, Yang LT, Yang-Rui LI, Wan CQ. 2007. Physicochemical properties and Antitumor activity of polysaccharide DCPP1a-1 from Suspension-cultured protocorms of Dendrobium candidum. Natural Product Res Dev. 19(3):410–414.
- Wang W, Schaal B, Chiou Y, Murakami N, Ge X, Cc CT. 2007. Diverse selective modes among orthologs/paralogs of the chalcone synthase (Chs) gene family of Arabidopsis thaliana and its relative A-halleri ssp gemmifera. Mol Phylogenet Evol. 44(2):503–520. doi: https://doi.org/10.1016/j.ympev.2007.05.006
- Wang L, Tang D, Wang J, Shang Y, Liu M, Lin Y. 2016. Comparison of antibacterial and Invitroantioxidant activities of polysaccharides from Dendrobium candidum protocorms and wild Dendrobium. J Northwest A & F University (Natural Science Edition). 44:167–172.
- Wang Y, Zhang Y, Zhang Q, Cui Y, Xiang J, Chen H, Hu G, Chen Y, Wang X, Zhu D, et al. 2019. Comparative transcriptome analysis of panicle development under heat stress in two rice (Oryza sativa L.) cultivars differing in heat tolerance. Peer J. 7:e7595. doi: https://doi.org/10.7717/peerj.7595
- Xing X, Cui SW, Nie S, Phillips GO, Goff HD, Qi W. 2015. Study on Dendrobium officinale O-acetyl-glucomannan (Dendronan ®;): Part V. Fractionation and structural heterogeneity of different fractions. Bioact Carbohydr Dietary Fibre. 5(2):106–115. doi: https://doi.org/10.1016/j.bcdf.2014.12.005
- Zhao Y, Li B, Wang G, Ge S, Lan X, Xu G, Liu H. 2019. Dendrobium officinale polysaccharides inhibit 1-methyl-2-nitro-1-nitrosoguanidine induced precancerous lesions of gastric cancer in Rats through regulating Wnt/beta-Catenin pathway and altering serum endogenous metabolites. Molecules. 24(14):2660. doi: https://doi.org/10.3390/molecules24142660
- Zhou T, Luo X, Yu C, Zhang C, Zhang L, Song YB, Dong M, Shen C. 2019. Transcriptome analyses provide insights into the expression pattern and sequence similarity of several taxol biosynthesis-related genes in three Taxus species. BMC Plant Biol. 19(1):33. doi: https://doi.org/10.1186/s12870-019-1645-x
- Zhou C, Xie Z, Lei Z, Huang Y, Gang W. 2018. Simultaneous identification and determination of flavonoids in Dendrobium officinale. Chem Cent J. 12(1):40. doi: https://doi.org/10.1186/s13065-018-0403-8
- Zou LQ, Wang CX, Kuang XJ, Li Y, Sun C. 2016. Advance in flavonoids biosynthetic pathway and synthetic biology. China J Chinese Materia Medica. 41(22):4124–4128.