
Abstract
Hyperlipidemia and oxidative stress are major risk factors for the development of atherosclerosis and cardiovascular disease. This study was designed to investigate the hypolipidemic and hepatic antioxidant potentials of the methanol Leek extract (LE) in a high-fat diet (HFD)-fed rat model. Wistar rats were divided into 6 groups (n = 6/groups) as 1) control fed standard diet, 2) HFD, 3) HFD + (Atorvastatin) (20 mg/kg), and HFD + LE (100, 200, or 300 mg/kg). All treatments were administered by gavage and conducted for 6 weeks, daily. At all tested, but in a dose-independent manner, LE significantly reduced final body weights and food intake and suppressed serum levels of alanine aminotransferase (ALT) and aspartate aminotransferase (AST). Besides, in inhibited serum and hepatic levels of total cholesterol (TC), triglycerides (TGs), and low-density lipoprotein cholesterol (LDL-C) but increased serum and hepatic levels of high-density lipoprotein cholesterol (HDL-C). Concomitantly, LE, at all tested doses increased the activity of superoxidase dismutase (SOD) and glutathione peroxidase (GPx), increased the levels of catalase (CAT) and decreased the levels of malondialdehyde (MDA) in the livers of HFD-fed rats. In conclusion, LE exerts potent hypolipidemic and hepatic antioxidant potentials in HFD-fed rats which highlight its beneficial effects in various metabolic-related disorders.
Abbreviations: LE: Leek extract; HFD: high-fat diet; TC: Total cholesterol; TG: Triglycerides; LDL-C: Low-density lipoprotein; HDL-C: High-density lipoprotein; ALT: Alanine aminotransferase; AST: Aspartate aminotransferase; GPx: Glutathione peroxidase; SOD: Superoxidase dismutase; CAT Catalase; MDA: Malondialdehyde.
Background
Cardiovascular diseases (CVDs) are responsible for the greatest disease burden on a global scale. CVDs are the main cause of death in both developed and developing countries, accounting for approximately 30% of annual deaths and 10% of the disease burden worldwide. Consequently, CVDs are associated with significant nursing and healthcare expenditure (Shukr et al. Citation2019). Hyperlipidemia, primarily defined as higher levels low-density lipoprotein (LDL-c)) Joseph et al. Citation2020), as well as oxidative stress, defined as the increased generation of reactive oxygen species in relative to cell antioxidants are two-related mechanisms which contribute significantly to atherosclerosis and major pathways responsible for the development of CVDs (Elahi et al. Citation2009; Li et al. Citation2013; Surya et al. Citation2017). Therefore, currently available data suggest that amelioration of oxidative stress and hyperlipidemia, by drugs, exercise, and herbal medication can reduce the risk and progression of CVDs and reduce its adverse effects (Jayathilake et al. Citation2016); Jain Citation2017; American Diabetes Association Citation2018).
Leek (Allium ampeloprasum), known in the Arabian area as Korath, belongs to the onion family (Alliaceae) and is widely distributed across the Middle East, especially in Saudi Arabia and Yemen. Leek contains organic sulfur compounds that are believed to possess health-promoting properties (Xiao et al. Citation2005). Allium spp. also contain significant levels of antioxidants such as lutein, β-carotene, vitamin C, and vitamin E, which can protect against several oxidative stress-induced disorders (Hart and Scott Citation1995; Jayathilake et al. Citation2016). Bernaert et al. (Citation2012) reported that green leek leaves have stronger antioxidant properties than the white stem, especially concerning polyphenol and ascorbic acid content. Besides, some reports on other Leek species such as the Persian Leek have reported potent hypolipidemic and anti-inflammatory effects (Fatoorechi et al. Citation2016)
The Arabian-originated Leek is largely consumed in the Kingdom of Saudi Arabia (KSA), with a particular increase in the central area as regular daily food. Despite an abundance of reports describing the antioxidant properties of various Leek species, the chemical constituent of the Arabian leek as well as its antioxidant and hypolipidemic effects were never shown before. Therefore, in this study, it was worthy for us to investigate the chemical composition of the Arabian leek methanol extract and to investigate its antioxidant and hypolipidemic effect in the serum and livers of a high-fat diet fed-rat model.
Methods
Sample extract preparation
Leek (Allium ampeloprasum) leaves (authentication number: 11-975, Ministry of Agriculture, Kingdome of Saudi Arabia (KSA)) were purchased from certified local markets in Riyadh city, KSA. The leaves were washed with distilled water and cut into small pieces. Samples were frozen at −80 °C, freeze-dried, and ground into powder. Exactly, 500 g of this powder was soaked in 1 L methanol in a sterile bottle and kept for 24 h at room temperature with continuous stirring. This step was repeated 3 times. The extract was then filtered using a sterile filter paper. The solvent was removed from the extract under reduced pressure. All extracts obtained after concentration were stored at −20°C until use (Hasan et al. Citation2007).
GC-MS analysis
The GC-MS analysis of the Leek methanolic extract was performed using Agilent 6890N/5973I with a mass selective detector. The sample was injected into a silica capillary column (30 m x 0.25 mm I.D. x 0.25 μm film thickness). The initial oven temperature was programed from 70°C; holding 2 min, to 305°C at 20°C/min, and holding for 1 min. Helium gas (99.999%) was used as a carrier gas at a constant flow rate of 1.2 ml/min. The injector temperature was set at 250°C and the ion source temperature was set at 230°C. The total GC running time was 14 min. The relative percentage amount of each component in each sample was calculated and the mass spectrums of the unknown component were compared with the spectrum of the known components stored in the National Institute of Standard and Technology computer library (NIST08). The database of NIST has more than 62,000 patterns.
Experimental design
Thirty-six adult healthy male Wistar albino rats (150 ± 20 g, 7 weeks old) were obtained from the Experimental Animal Care Centre (EACC), College of Pharmacy, King Saud University (KSU), KSA. During the adaptation period (1 week) and through the experimental conditions, all rats were always kept in controlled environmental conditions of 22°C, 12/12 h light/dark cycle, and relative humidity of 50-55% and had free access to water, ad libitum. The experimental protocol was approved by the institutional review board of KSU (Ref. No.: KSU-SE-18-36). The animals were classified into 6 groups) (n = 6/each) as 1) control group: fed the standard diet; high fat diet-fed group (HFD): which fed HFD; 3) HFLIP: fed HFD and received a concomitant treatment of Lipitor (Atorvastatin) (20 mg/kg/day); 4) HFL 100: fed HFD and received a concomitant dose of Leek extract (LE) at a final concentration of 100 mg/kg; 5) HFL 200: fed HFD and received LE extract at a final concentration of 200 mg/kg; and 6) HFLE 300: fed HFD and concomitantly treated with 300 mg/kg of LE extract for 6 weeks. All treatments were given, orally on a daily basis for 6 weeks. The selected doses of the LE were adopted to be below the LD50 which was shown to be 3000 mg/kg (Shenoy et al. Citation2009). Both the control standard (Cat. No. D12450 K) and HFD (Cat. No. D12451) diets (Table ) were purchased from DIETS INC., New Brunswick, USA, and are shown in Table . Changes in rats’ body weight were recorded weekly.
Table 1. The both standard and high-fat diet formulation of rats.
Collection of body tissues and blood samples
After the end of the treatment period, all rats were anesthetized using an intraperitoneal injection of xylazine hydrochloride (10 mg/kg) and ketamine hydrochloride (90 mg/kg) (Kim et al. Citation2015). Blood samples were collected directly from the heart into plain tubes centrifuged at 3000 rpm for 10 min to obtain the blood serum which was stored at −80°C until analysis. Then the animals were killed by cervical dislocation and liver tissues were collected on ice, washed with ice-cold PBS (pH 7.4), and snap-frozen in liquid nitrogen and stored at −80°C for further use.
Preparation of liver homogenates for the biochemical analysis
Liver samples (200 mg) were homogenized on ice in 10-folds volume ice-cold phosphate buffer saline (PBS) (pH 7.4) using the IKA Ultra-Turrax T-50 Homogenizer (Germany). The homogenates were stored at −80°C until.
Hepatic lipid and protein extraction
Lipids were extracted from frozen liver samples using the method describes by Folch et al. (Citation1957). In brief, 1 g of frozen livers was homogenized with 19 ml of extraction solution containing chloroform and methanol (2:1, v/v) (3X/each of 3 min) on in ice followed by 1 h cooling at 4 °C. The extract was centrifuged at 1400 xg at 4°C for 10 min to separate the upper aqueous layer and lowered the organic layer (containing the lipids fraction). The organic layer was removed and rinsed further with chloroform: methanol mixture (2:1, v/v). The organic solvent was removed by the rotatory evaporator, reconstituted in 250 µl isopropanol, and stored at −80°C until lipid profile analysis. The serum profile in this liver extract was determined using the same kits used for the serum. Protein was extracted from tissues using the salt/alkaline extraction method as described by Mæhre et al. (Citation2016). In brief, 0.25 g of the frozen liver samples were mixed with 15 ml of the lysis buffer (0.1 M sodium hydroxide (NaOH) prepared in 3.5% sodium chloride (NaCl)) using the IKA Ultra-Turrax T-50 Homogenizer (Germany). The mixture was incubated for 90 min at 60 °C and then centrifuged for 30 at 4°C (4000 ×g). The supernatants containing the proteins were collected and kept −20 °C until protein measurements.
Determination of total TC and HDL-C
The levels of serum and hepatic TC and HDL-C were measured by an assay fluorometric kit (Cat. No. STA-384, Cellbiolabs, CA, USA) per the manufacturer’s instructions. This kit provides reagents to separate HDL-c fraction from other lipoproteins before cholesterol assay which was followed before the assay (optional), so it can measure the levels of both TC and HDL-c. The principle of the test is to hydrolyze cholesterol esters, enzymatically by cholesterol esterase into cholesterol. Cholesterol is then oxidized by cholesterol oxidase into cholest-4-en-3-one and hydrogen peroxide (H2O2) where the latter can be detected by a highly specific colorimetric probe in a reaction catalyzed by horseradish peroxidase (HRP). The absorbance of the product is then measured by at 570 nm and the amount of HDL-c or TC in each sample is calculated from a standard curve. To prepare the diluted HDL-C samples, 200 µl of the sample was mixed with 2X precipitation solution in a microcentrifuge tube, vortexed well, and incubated for 10 min at room temperature. The tubes were then centrifuged at 2000 xg for 20 min. The supernatants containing the HDL-C was separated into new tubes and diluted (1:50) with the 1X dilution buffer. For the assay, 50 µl of the diluted HDL-C, diluted TC samples, or cholesterol standards were added to a 96-well plate followed by the addition of 50 µl of the provided cholesterol reaction reagent/well. The plate was incubated in dark at 37°C for 45 min and the fluorescence (RUF) of all wells was read at excitation 570 nm and emission 600 nm using the M-2 Spectramax microplate reader.
Determination of total triglycerides
Levels of hepatic and serum levels of TG were measured by an enzymatically colorimetric assay kit (Cat. NO. STA-396, Cellbiolabs, CA, USA) as established by the manufacturer’s instructions. The principle of the test depends on hydrolyzing TGs to free glycerol by the added lipase which can be then phosphorylated and oxidized to produce H2O2. H2O2 can react and detected by the specific colorimetric probe (provided with the kit) at 570 nm. All reagents were prepared per manufacturer’s instructions and always kept at 4°C. In the assay, 10 µL of the diluted TGs standards or samples were added to a 96-well microtiter plate followed by the addition of 90 µl of the reaction mixture/well (already containing 10 µl of triglyceride standard or sample). The plate was incubated at room temperature in dark for 30 min with continuous shaking. The absorbance was read at 570 nm using the M-2 Spectramax microplate reader and the concentrations of TGs in all samples were obtained from the standard curve.
Determination of total LDL-C
Hepatic and serum concentrations of LDL-C were measured using an enzymatic assay kit (Cat. No. 80069, Crystal Chem, CA, USA) which is based on the modified polyvinyl sulfonic acid (PVS) and polyethylene-glycol methyl ether (PEGME) coupled classic precipitation method with the use of other selected detergents. In the assay, LDL, VLDL, and chylomicron (CM) react with PVS and PEGME to form a complex that prevents their oxidation by cholesterol oxidase (CHOD) and cholesterol esterase (CHER) whereas HDL reacts with the enzymes. In the next step, a second specific reagent releases LDL from the PVS/PEGME complex which can be then reacted with the enzymes to produce H2O2 that can be detected by the Trinder reaction. Briefly, 3 µL of the samples or standard was added to a 96-well microtiter plate followed by the addition of 225 µL PVS/PEGME enzyme solution. The plate was incubated in dark for 5 min at 37°C. Finally, 75 µL of decomplexing agent was added to each well, incubated for 5 min at 37 °C, and the absorbance was read at 600 nm using the M-2 Spectramax microplate reader.
Determination of total protein levels
Total protein levels in all liver samples were determined using the method established by the modified method established by Lawry et al (Lowry et al. Citation1951). To prepare the lowery solution, Solution A (2.8598 g sodium hydroxide (NaOH) and 14.3084 g sodium carbonate (Na2CO3)/500 ml), solution B (1.4232 g copper sulfate pentahydrate (CuSO4·5H2O)/100 ml), and solution C (2.85299 g potassium sodium tartrate hydrate (C4HNa2O6(2H2O)/100 ml) were mixed at a ratio of 100:1:1. At the same time, Folin reagent was prepared by mixing 5 ml of 2N Ciocalteu phenol reagent with 6 ml of distilled H2O. For the assay, bovine serum albumin (BSA) standards were prepared. Briefly, the extracted protein samples were diluted by 1:9 with distilled H2O. Then 0.5 ml of the diluted sample or standard were added a test tube, mixed, and vortexed with 0.7 ml of the Lawry reagent. The whole mixture was incubated in dark for 20 min at room temperature. Then, 100 µl of the Folin reagent was added to each tube and incubated for 40 min at room temperature and absorbance was read at 650 nm. The concentrations of all protein in all samples were calculated using the BSA standard curve.
Determination of serum levels of ALT
Serum levels of Alanine aminotransferase (ALT) were determined using MyBioSource assay kit, (Cat. No. MBS2540581, MyBioSource, CA, USA) following the manufacturer’s instructions. The test catalyzes the amino conversion between alanine and α-ketoglutarate to produce pyruvic acid and glutamic acid at pH 7.4. Then, phenylhydrazine is added to form pyruvic acid phenylhydrazone which can be measured at 510 nm. In brief, 5 reagents are utilized in the kit to prepare the standard and analysis of ALT levels in the samples (reagent 1-5). In the test, 5 µl of the sample was mixed with 30 µl of reagent 3 and incubated at 37°C for 30 min. Then 20 µl of reagent 4 was added to the reaction, mixed well, and incubated for 20 min at 37°C. Finally, 200 µl of the regent 5 was added and the developed color was read at 510 nm and ALT levels were presented as U/l.
Determination of serum levels of AST
Serum levels of aspartate aminotransferase (AST) were measured using an assay kit (Cat. No. MBS2540582, MyBioSource, CA, USA) according to the manufacturer’s instructions. The principle of the test relies on the ability of AST to catalyze the transformation of amino and keto groups between α- ketoglutaric acid and aspartic acid which generates glutamate and oxaloacetic acid can be generated. The decarboxylation of oxaloacetic acid yields pyroracemic acid which in turn reacts with 2,4- dinitrophenylhydrazine (DNPH) and produce 2,4-dinitrophenylhydrazone than can be measured at 510 nm. In brief, 5 µl of the sample was added to 20 ±l of pre-heated (37°C) substrate solution, mixed well, and incubated at 37°C for 30 min. then, 20 µl of DNPH reagent was added to each well, mixed well, and incubated for another 20 min at 37°C. Finally, 200 µl of 0.4 mol/L NaOH solution was added to each well. The plate was incubated in dark at room temperature for 15 min and the developed color was measured at 510 nm using the M-2 Spectramax microplate reader. The concentrations of AST in all samples were determined using a standard curve and presented as U/l.
Measurement of malonaldehyde (MDA) levels
Hepatic levels of MDA were measured using a rat’s ELISA kit (Cat. No. MBS738685, MyBioSource, CA, USA) which utilizes specific MDA antibody and an MDA-HRP conjugate. In brief, 100 μl of the standards or the samples (liver homogenates) were added to the 96-well plate. Control plates contained 100 μl PBS (pH 7.2) only. Then, 10 μl of the provided balance solution was added to the samples well only. 100 μL samples only, After that, 50 μl of the HRP- conjugate reagent was added to all wells and the absorbance was read at 450. The concentration of MDA calculated from the established standard curve was presented as nmol/g protein. All preparation and protocol steps were done per the manufacturer’s instructions.
Measurement of the activity of glutathione peroxidase (GPx)
The activity of GPx was measured using rat’s specific double antibody sandwich ELISA kit (Cat. No. MBS774703, Cat. No. MBS738685, MyBioSource, CA, USA). Briefly, 50 µl of the standards or 10 µl of the liver homogenate samples (plus 40 µl diluent) was added to their designated wells in a 96-well plate. Then, 100 µl of HRP-conjugate reagent was added to all wells, mixed well, and incubated for 1 h at 37°C (except the blank wells). Blank wells remained empty. Then, the wells were washed with 350 µl of washing buffer (5 times/each of 1 min). Finally, 50 µl chromogen solution A and 50 µl chromogen solution B was added to each well, mixed well, and incubated for 15 min at 37°C until the color develops. Then, 50 µl of the stopping solution was added to these wells and the absorbance was read at 450 nm. The activity of GPX has calculated from the established standard curve and presented as U/mg protein.
Measurement of the activity of superoxide dismutase (SOD)
Hepatic levels of SOD were measured in all homogenates using a rat’s specific competitive ELISA kit (Cat. No: MBS036924) following the manufacture’s instruction. In brief, 50 µl of the standards or samples (homogenates) were added to the wells of a 96-well plate followed by the addition of 100 µl of the HRP-conjugate reagent (except for blank wells). The plate was incubated for 1 h at 37°C after which all well were washed with the 300 µl of the washing buffer (4 times/each of 1 min). Then, 50 µl of chromogen A and 50 µl of chromogen B were added to standard and sample wells, mixed and incubated at 37°C for 15 for color development. Lastly, 50 µl of the stopping solution was added to the wells, and absorbance was read at 450 nm. The activity of SOD (U/mg protein) was calculated from the generated standard curve.
Measurement of the levels of catalase (CAT)
Hepatic levels of CAT were calculated using a rat’s ELISA kit (Cat. No. MBS9712526) as per the manufacture’s instruction. In brief, 100 µl of the standards or liver homogenates were added to the appropriate well. However, 100 µL of PBS (7.2) was added to the blank control wells. To the samples wells only, 10 2) Dispense 10 µl of the balance solution were added. Next, 50 µl HRP-conjugate reagent was added to the standard and sample wells and incubated for 1 h at 37°C followed by the addition of 50 µl of the stopping solution. The levels of CAT calculated as ng/mg protein was derived from a standard curve.
Statistical analysis
All data were analyzed using GraphPad Prism (Version 8, Australia). The difference between groups was investigated using the one-way ANOVA followed by the Newman–Keuls Multiple Comparison Test. Differences were considered statistically significant at P < 0.05.
Results
GC–MS analysis
The results of the GC-MS analysis of the leek methanol extract are displayed in Table . About 13 phytochemical compounds were identified after analyzing the methanol leek extract (LE). The 9,12,15-Octadecatrienoic methyl ester, (Z, Z, Z)- acid represents the major compound detected in the extract (71.41%), having activity as anti-inflammatory, hypocholesterolemic, anti-cancer, hepatoprotective, nematicide, insectifuge, antihistaminic, antieczemic, 5-alpha reductase inhibitor, antiandrogenic, anti-coronary agent (Belakhdar et al. Citation2015). Some other identified phytochemical compounds included hexadecanoic acid, methyl ester, Octadecanoic acid, methyl ester, and 9, 12-Octadecadienoic acid (Z, Z)-, methyl ester has also other biological activities including antioxidant and hypolipidemic effects (Table ).
Table 2. GC-MS profile of phytochemical compounds of leek leaf methanolic extract.
Alterations in food intake and body weight gain
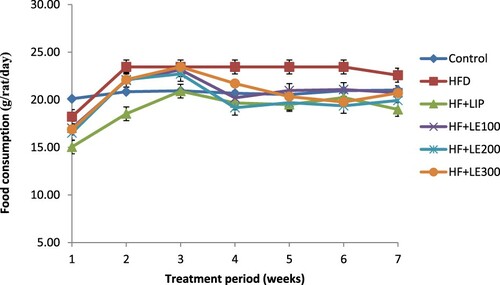
As depicted in Figures and , HFD-fed rats showed a significant increase in their weekly food intake and body weights as compared to control rats fed the standard diet. However, the increased food intake and body weights were significantly decreased in HFD-fed rats which were treated with the methanol LE at all tested doses (100, 200, 300 mg/kg) as compared to HFD rats administered the vehicle. However, these results were comparable to the effects seen by the administration of Lipitor.
Figure 1. The effect of methanolic leek extract on body weight gain of normal and hyperlipidemic rats. Data are expresses as (mean ± SD, n = 6).
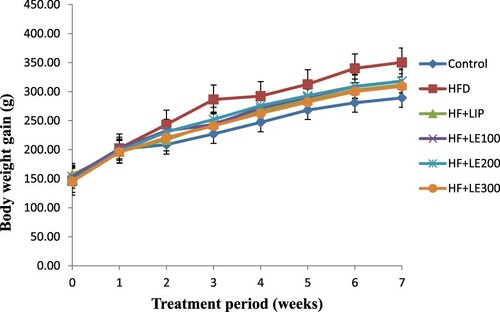
Figure 2. The effect of methanolic leek extract on food intake of normal and hyperlipidemic rats. Data are expresses as (mean ± SD, n = 6).
Alterations in serum and lipid profile
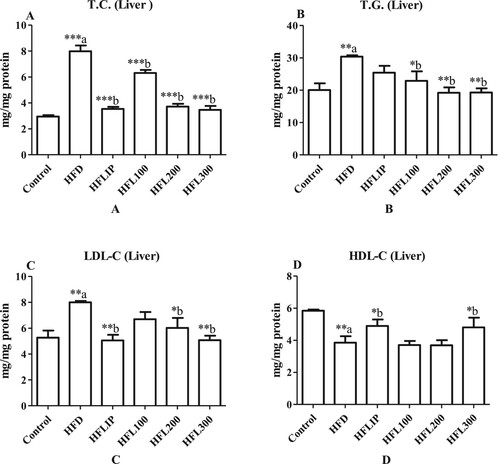
Serum and hepatic levels of TC, TGs, LDL-C were significantly increased whereas serum and hepatic levels of HDL-C were significantly increased HFD-fed rats as compared to control rats fed the standard diet (Figure A-D and Figure A-D). Lipitor Significantly lowered serum levels of TGs and LDL-C but didn’t affect serum levels of HDL-C and TGs in HFD-treated rats as compared to non-treated HFD-fed rats (Figure A-D). With no effect of hepatic TGs levels, Lipitor also significantly increased hepatic levels of HDL-C and lowered TC and LDL-C in HFD-treated rats when compared to non-treated HFD model rats (Figure A-D and Figure A-D). On the other hand, LE at a dose of 100 mg/kg didn’t affect the levels of all measured lipids in the serum, it significantly lowered the levels of TC and increased HDL-C levels in the livers of HFD-treated rats as compared to non-treated HFD-fed rats (Figure A-D and Figure A-D). Nonetheless, LE extract at doses of 100 and 200 mg/kg significantly lowered serum and hepatic levels of TC, TGs, and LDL-C in HFD-fed rats as compared to no-treated HFD-fed rats (Figure A-D and Figure A-D). However, LE extract at the dose of 300 mg/kg was the only dose that caused an increased in HDL-C levels in the serum and livers of treated HFD-fed rats as compared to HFD-fed rats administered the vehicle (Figure A-D and Figure A-D).
Figure 3. The effect of methanolic leek extract on lipid profile in serum of normal and hyperlipidemic rats. Data are expresses as (mean ± SD, n = 6). a: Control vs. HFD, b: HFD vs. other treatments.
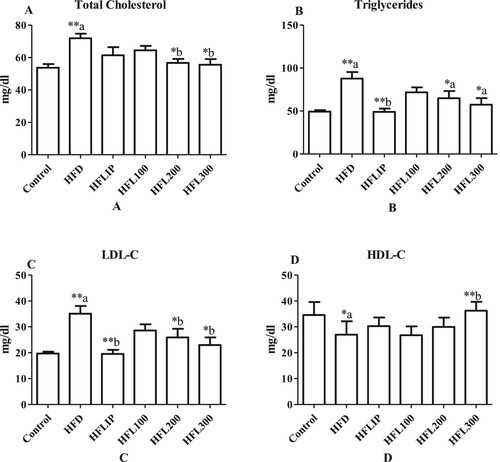
Figure 4. The effect of methanolic leek extract on lipid profile in liver of normal and hyperlipidemic rats. Data are expresses as (mean ± SD, n = 6). a: Control vs. HFD, b: HFD vs. other treatments.
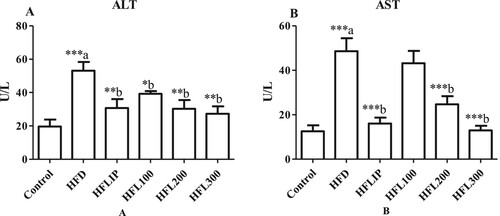
Alterations in serum levels of liver function enzymes
Serum levels of ALT and AST were significantly increased in non-treated HFD-fed rats as compared to control rats fed the standard diets (Figure A&B). However, the levels of all these enzymes were significantly decreased in HFD-fed rats which co-treated with Lipitor or LE extract at the doses of 200 and 300 mg/kg and as compared to non-treated HFD-fed rats (Figure A&B). Although serum levels of ALT were significantly decreased, serum levels of AST remained statistically not changed in HFD-fed rats which received 100 mg/kg of LE extract (Figure A&B).
Figure 5. The effect of methanolic leek extract on hepatic enzymes of normal and hyperlipidemic rats. Data are expresses as (mean ± SD, n = 6). a: Control vs. HFD, b: HFD vs. other treatments.
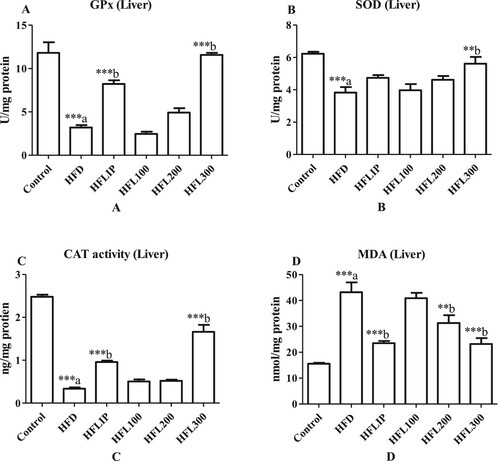
Alterations in hepatic levels of enzymatic antioxidants
Activities of SOD and GPx and levels of CAT were significantly increased but the levels of MDA were significantly increased in the livers of non-treated HFD-fed rats as compared to control rats fed the standard diet (Figure A-D). On the other hand, Lipitor significantly increased GPX activities and CAT levels and significantly suppressed the levels of MDA with no effect on SOD activity in the livers of HFD- treated rats and as compared to non-treated HFD-fed rats (Figure A-D). However, the LE extract at the doses of 100 and 200 mg/kg didn’t affect the activities of SOD and GPX nor CAT levels but significantly reduced MDA levels in the livers of HFD-fed rats as compared to non-treated HFD-fed rats (Figure A-D). Of note, the maximum effect of LE on these markers was observed at the highest given dose (300 mg/kg).
Figure 6. The effect of methanolic leek extract on markers of oxidative stress of normal and hyperlipidemic rats. Data are expresses as (mean ± SD, n = 6). a: Control vs. HFD, b: HFD vs. other treatments.
Discussion
The major findings of this study show that daily consumption of LE at doses of 100, 200, and 300 mg/kg can ameliorate serum and hepatic lipid profile, improve liver function tests, and boost haptic antioxidant enzymatic system in HFD-fed rat model.
In general, HFD feeding in rodents is associated with an increase in food consumption and obesity (Lutz and Woods Citation2012). Unit now, the mechanism for hyperphagia (over-eating) and subsequent weight gain in HFD-fed animal models and humans remains a matter of debate (Licholai et al. Citation2018). However, currently available data suggest that such effect is due to multiple mechanisms including homeostatic (endocrine and neural), hedonic (palatability), and cognitive feedback (Hall et al. Citation2014). Up-to-date, it is well-accepted that dysregulation of the endocrine-hippocampus axis (such as leptin resistance), as well as dysregulation of many brain receptors such as melanocortin 4 receptors (MC4R), is the major mechanisms by which HFD-stimulates over-feeding and obesity (Farooqi and Leptin Citation2009; Friedman, Citation2009 Licholai et al. Citation2018). Besides, HFD is associated with altered liver lipid metabolism due to dysregulation of numerous fatty acid and cholesterol synthesis and fatty acid oxidation pathways, which ultimately leads to over-synthesis of TGs, TC, and LDL, hyperlipidemia, mitochondria, damage, oxidative stress, hyperglycemia, insulin resistance, fatty liver, and hepatic damage and cirrhosis (Wilkes et al. Citation1998; Kakimoto and Kowaltowski Citation2016; Jin et al. Citation2017; Khaleel et al. Citation2018).
In this study, we have first validated our male animal models by measuring the alterations in food intake, body weights, and serum and hepatic lipid profiles. An important note to be mentioned here is that we have selected male rats because their lipid profile is less affected than females. Indeed, it has been demonstrated that female hormones such as estrogen and progesterone reduce serum and hepatic lipids inhibit lipid peroxidation and increase circulatory levels of HDL-C (McCrohon et al. Citation1999; Vedder et al. Citation1999; Ballantyne and Jones Citation2014). As expected, HFD-fed rats showed a significant increase in their body weight gain, food intake, and had higher serum and hepatic levels of serum TC, TGs, and LDL-c and lower levels of HDL-C. All these data are in accordance with the many other similar studies (Lutz and Woods Citation2012; Jin et al. Citation2017; Khaleel et al. Citation2018).
On the other hand, Atorvastatin and other statins such as lovastatin are the best known 3-hydroxy-3-methylglutaryl coenzyme A (HMG CoA) reductase inhibitors with very effective lipid-lowering effects in both human and animals (Chong et al. Citation2001). These drugs are frequently used as reference standard hypoliplidemic drugs (Chong et al. Citation2001). In this study, we have selected Atorvastatin as it has been demonstrated by the others to be a very effective hypolipidemic drug as compared with other statins including pravastatin, lovastatin, and fluvastatin in patients with hypercholesterolemia (Jones et al. Citation1998). Herein, both Atorvastatin and LE, mainly at the higher doses (200 and 300 mg/kg) prevented the increase in rats’ body weights, suppressed food intake, prevented the increase in serum and hepatic levels of TC, TGs, and LDL-C, and increased serum and hepatic levels of HDL-C in HFD-fed rats. In general, it is well accepted that the increase in LDL-C is atherogenic as it stimulated the deposition of LDL-C in the arterial walls at higher levels and in the presence of oxidative stress stimuli (Ahotupa Citation2017). On the other hand, HDL-C is the protective cholesterol that prevent these events and reduces the oxidation of LDL-C (Ahotupa Citation2017). Based on these data, we can strongly argue that LE exhibits anti-obesity and hypolipidemic effects that are more comparable to that of Atorvastatin.
Besides, HFD is associated with increased hepatic fatty acid oxidation and mitochondria overload which results in the generation of high quantities of ROS, oxidative stress, lipid peroxidation, and liver damage. Indeed, disturbance of hepatic lipid metabolism impairing the mitochondria (electron transport chain), induces endoplasmic reticulum (ER) stress and stimulates numerous different ROS-generating enzymes such as NADP(H) oxidase (Rolo et al. Citation2012). Also, ROS impairs hepatic insulin signaling, induces inflammation, and activates key enzymes involved in lipid synthesis (Rolo et al. Citation2012). Therefore, it seems acceptable that the dysregulation of lipid metabolism and over-production of ROS interconnected in a positive feedback loop which ultimately leads to hyperlipidemia and liver damage. ALT and AST are of the best clinical markers for liver necrosis and membrane damage.
In the same line with this evidence, we have shown a significant reduction in the levels of CAT and activities of SOD and GPx with a concomitant increase in MDA (lipid peroxidation marker) in the livers of HFD-fed rats which could be due to enzymes overwhelming. Also, we have found significantly higher circulatory levels of ALT and ATS in the livers of HFD-fed rats. These data may explain the crucial role of oxidative stress in HFD-induced liver damage. However, the observation that Atorvastatin and LE can attenuate HFD-induced alteration in all these markers of oxidative stress and liver enzymes suggest that the hepatoprotective effect of LE is mediated, at least, by an antioxidant potential. This is not strange for statin as their anti-oxidant effect is well reported (Vargas et al. Citation2017). These data may also indicate that the hypolipidemic effect of LE could be due to its antioxidant effect.
Although not investigated in the Arabian Leek, many other studies on different Leek species or family members support our findings. For example, the extract of the Jumbo leek significantly reduced fasting blood glucose and serum levels of ALT and AST with a concomitant improvement in liver architectures in STZ-induced diabetic rats (Uchida et al. Citation2008). Also, the Persian Leek significantly reduced liver triglycerides and attenuated the increase in liver enzymes and hepatic inflammation with no alterations in serum lipid levels and hepatic content of TC (Fatoorechi et al. Citation2016). In the same line, the antioxidant, hypolipidemic, and hepatic protective effect of garlic and onion, 2 related plants, is well reported in various liver damage animal models as well as in humans and animals (Kim et al. Citation2008; Vidyavati et al. Citation2010; El-Din et al. Citation2014) besides, the antioxidant potential of the ultrasonic extracts of LE has been shortly reported (Jelena et al., 2011).
However, it has been recently reported that the Persian Leek is very rich in d-limonene (27%) of the essential oils (Karimi et al. Citation2013). Dietary d-limonene is a potent hypolipidemic agent that prevents the accumulation of TC and TGs in the livers of experimental animals by suppression of the transcription of SREBP1/2 and apolipoprotein E expression (Victor Antony Santiago et al. Citation2012; Jing et al. Citation2013). Also, some other studies have reported that Leek is also rich in ferulic acid which is known for its antioxidant effect and prevention of the accumulation of hepatic TGs by suppressing intestinal fat absorption and inhibition of fatty acid synthesis genes (Adluri et al. Citation2008; Jin Son et al. Citation2010; Bernaert et al. Citation2013). Also, some other studies have shown that some species of Leek are very rich in organosulfur compounds which are well known to reduced hepatic TGs synthesis by suppressing related genes (Liu and Yeh Citation2001). In this study, we have characterized the major ingredients of the Arabian LE and have found the high ratio of these components are Hexadecanoic acid, methyl ester, 11,14,17-Eicosatrienoic acid, and 9,12,15-Octadecatrienoic acid. All these molecules are reported to have antioxidant, hypocholesterolemic, hepatoprotective, and anti-inflammatory effects Rehana and Nagarajan Citation2013; Easwaran and Ramani Citation2014; Kumar et al. Citation2014; Belakhdar et al. Citation2015; Ganesh and Mohankumar Citation2017).
Despite these findings, the precise mechanism by which the LE exhibited its antioxidant and hypolipidemic effects can’t be concluded from these data which a real limitation of this study. Hence, further studies using the whole methanol extract, as well as individual constituents, on molecular pathways in the liver such as SREBP1/2, AMPK, PPARα, HMGCoA reductase, lipid synthesis genes, mitochondria function, and fatty acid oxidation, as well as on antioxidant regulators such as nuclear factor-2 (Nrf-2) and glutathione are highly required. Besides, the effect of LE on intestinal fat absorption should be not neglected.
Conclusion
The current study provides the first evidence in the literature that the Arabian Leek exhibits antioxidant and hypolipidemic effects in HFD-fed rats mainly due to its high fatty acids content. These data are very promising and open a new window for further research to find more safe therapeutic drugs.
Author contributions
SA, AA, and GA were responsible for the concept and design of the study. MY, SA, and FA carried out the experimental analysis on animals including biochemical measurements as well as statistical analysis of data and writing of results. GA, AA, and MY discussed the results and wrote the manuscript draft. All authors read, reviewed, and approved the final manuscript.
Declarations
Ethics approval and consent to participate
The experimental protocol was approved by the institutional review board (Ref. No.: KSU-SE-18-36), King Saud University, Riyadh, KSA.
Consent for publication
Not applicable.
Availability of data and materials
The data generated and analyzed during the study are available from the corresponding author on reasonable request.
Acknowledgments
The authors are grateful to the Researchers Supporting Project number (RSP-2019/84), King Saud University, Riyadh, Saudi Arabia for funding this work.
Disclosure statement
No potential conflict of interest was reported by the author(s).
Additional information
Funding
References
- Adluri RS, Nagarajan D, Periyaswamy V, Venugopal PM. 2008. Dose-response effect of ferulic acid against nicotine-induced tissue damage and altered lipid levels in experimental rats: a pathohistological evaluation. Fundam Clin Pharmacol. 22(5):557–567.
- Ahotupa M. 2017. Oxidized lipoprotein lipids and atherosclerosis. Free Radic Res. 51(4):439–447.
- American Diabetes Association. 2018. 9. Cardiovascular disease and risk management: standards of medical care in diabetes-2018. Diabetes Care. 41(Suppl 1):S86–S104.
- Ballantyne CM, Jones PH. 2014. Overview of general approach to management of elevated low-density lipoprotein cholesterol and mixed dyslipidemia, high triglycerides, and low high-density lipoprotein cholesterol. In: Ballantyne CM, editor. Clinical Lipidology: A Companion to Braunwald's heart disease. Philadelphia: Elsevier Health Sciences; p. 199–201.
- Belakhdar G, Benjouad A, Abdennebi EH. 2015. Determination of some bioactive chemical constituents from Thesium humile Vahl. J Mater Environ Sci. 6(10):2778–2783.
- Bernaert N, De Paepe D, Bouten C, De Clercq H, Stewart D, Van Bockstaele E, et al. 2012. Antioxidant capacity, total phenolic and ascorb ate content as a function of the genetic diversity of leek (Allium ampeloprasum var. porrum). Food Chem. 134:669–677.
- Bernaert N, Wouters D, De Vuyst L, De Paepe D, De Clercq H, Van Bockstaele E, et al. 2013. Antioxidant changes of leek (Allium ampeloprasum var. porrum) during spontaneous fermentation of the white shaft and green leaves. J Sci Food Agric. 93:2146–2153.
- Chong PH, Seeger JD, Franklin C. 2001. Clinically relevant differences between the statins: implications for therapeutic selection. Am J Med. 111(5):390–400.
- Easwaran L, Ramani A. 2014. . phytochemical examination and gc-ms studies of the medicinal plant - Naravelia zeylanica. IJRDPL. 3(5):1180–1188.
- El-Din SH, Sabra AN, Hammam OA, Ebeid FA, El-Lakkany NM. 2014. Pharmacological and antioxidant actions of garlic and.or onion in non-alcoholic fatty liver disease (NAFLD) in rats. J Egypt Soc Parasitol. 44(2):295–308.
- Elahi MM, Kong YX, Matata BM. 2009. Oxidative stress as a mediator of cardiovascular disease. Oxid Med Cell Longev. 2(5):259–269.
- Farooqi IS, Leptin OS. 2009. . a pivotal regulator of human energy homeostasis. Am J Clin Nutr. 89(3):980S–984S.
- Fatoorechi V, Rismanchi M, Nasrollahzadeh J. 2016. Effects of Persian leek (Allium ampeloprasum) on hepatic lipids and the expression of proinflammatory gene in hamsters fed a high-fat/ highcholesterol diet. Avicenna J Phytomed. 6(4):418–424.
- Folch J, Lees M, Sloane Stanley GH. 1957. A simple method for the isolation and purification of total lipides from animal tissues. J Biol Chem. 226(1):497–509.
- Friedman JM. 2009. Obesity: Causes and control of excess body fat. Nature. 459(7245):340–342.
- Ganesh M, Mohankumar M. 2017. Extraction and identification of bioactive components in Sida cordata (Burm.f.) using gas chromatography-mass spectrometry. J Food Sci Technol. 54(10):3082–3091.
- Hall KD, Hammond RA, Rahmandad H. 2014. Dynamic interplay among homeostatic, hedonic, and cognitive feedback circuits regulating body weight. Am J Public Health. 104(7):1169–1175.
- Hart DJ, Scott KJ. 1995. Development and evaluation of an HPLC method for the analysis of carotenoids in foods, and the measurement of the carotenoid content of vegetables and fruits commonly consumed in the UK. Food Chem. 54:101–111.
- Hasan TN, Ahmed SN, Aalam SMM, Kumar C, Shafi G. 2007. Evaluation of cichorium extract for the growth supporting property in rat hepatocyte primary culture. Asian J Plant Sci. 6:431–434.
- Jain KK. 2017. Personalized Management of cardiovascular disorders. Med Princ Pract. 26(5):399–414.
- Jayathilake C, Rizliya V, Liyanage R. 2016. Antioxidant and free radical scavenging capacity of extensively used medicinal plants in Sri Lanka. Proced Food Science. 6:123–126.
- Jin CJ, Engstler AJ, Ziegenhardt D, Bischoff SC, Trautwein C, Bergheim I. 2017. Loss of lipopolysaccharide-binding protein attenuates the development of diet-induced non-alcoholic fatty liver disease in mice. J Gastroenterol Hepatol. 32(3):708–715.
- Jing L, Zhang Y, Fan S, et al. 2013. Preventive and ameliorating effects of citrus D-limonene on dyslipidemia and hyperglycemia in mice with high-fat diet-induced obesity. Eur J Pharmacol. 715(1-3):46–55.
- Jin Son M, W Rico C, Hyun Nam S, Young Kang M. 2010. Influence of oryzanol and ferulic acid on the lipid metabolism and antioxidative status in high fat-fed mice. J Clin Biochem Nutr. 46(2):150–156.
- Jones P, Kafonek S, Laurora I, Hunninghake D. 1998. Comparative dose efficacy study of atorvastatin versus simvastatin, pravastatin, lovastatin, and fluvastatin in patients With hypercholesterolemia (The CURVES study). Am J Cardiol. 81(5):582–587.
- Joseph TD, Gary CY, Michael P L, Stuart TH, Thomas DN, Vicki E. 2020. Pharmacotherapy: a pathophysiologic approach. USA: McGraw-Hill Education. Eleventh edition.
- Kakimoto PA, Kowaltowski AJ. 2016. Effects of high fat diets on rodent liver bioenergetics and oxidative imbalance. Redox Biol. 8:216–225.
- Karimi N, Bareemizadeh F, Ghasempour H. 2013. The comparision GC and GC-MS of Allium Ampeloprasum L. Var, Atroviolaceum Regel And Allium Iranicum Wendelbo. Tehran, Iran: 2nd National Congress on Medicinal Plants.
- Khaleel EF, Abdel-Aleem GA, Mostafa DG. 2018. Resveratrol improves high-fat diet induced fatty liver and insulin resistance by concomitantly inhibiting proteolytic cleavage of sterol regulatory element-binding proteins, free fatty acid oxidation, and intestinal triglyceride absorption. Can J Physiol Pharmacol. 96(2):145–157.
- Kim JL, Chae IS, Kang YH, Kang JS. 2008. Effect of onion and beet on plasma and liver lipids, platelet aggregation, and erythrocyte Na efflux in simvastatin treated hypercholesterolmic rats. Nutr Res Pract. 2:211–217.
- Kim HC, Song JM, Kim CJ, Yoon SY, Kim IR, Park BS, Shin SH. 2015. Combined effect of bisphosphonate and recombinant human bone morphogenetic protein 2 on bone healing of rat calvarial defects. Maxillofac Plast Reconstr Surg. 37:16.
- Kumar SS, Samydurai P, Ramakrishnan R, Nagarajan N. 2014. Gas chromatography and mass spectrometry analysis of bioactive constituents of Adiantum capillus-veneris. Int J Pharm. 6(4):60–63.
- Li C, Zhang W, Zhou F, Chen C, Zhou L, Li Y, et al. 2013. Cholesteryl ester transfer protein inhibitors in the treatment of dyslipidemia: a systematic review and meta-analysis. PLoS One. 8:e77049.
- Licholai JA, Nguyen KP, Fobbs WC, Schuster CJ, Ali MA, Kravitz AV. 2018. Why do mice overeat high-Fat diets? How high-fat diet alters the regulation of daily caloric intake in mice. Obesity (Silver Spring). 26(6):1026–1033.
- Liu L, Yeh YY. 2001. Water-soluble organosulfur compounds of garlic inhibit fatty acid and triglyceride syntheses in cultured rat hepatocytes. Lipids. 36:395–400.
- Lowry OH, Rosebrough NJ, Farr AL, Randall RJ. 1951. J Biol Chem. 193:265. (The original method).
- Lutz TA, Woods SC. 2012. Overview of animal models of obesity. Curr Protoc Pharmacol. Chapter 5:Unit5.61.
- McCrohon JA, Nakhla S, Jessup W, Stanley KK, Celermajer DS. 1999. Estrogen and progesterone reduce lipid accumulation in human monocyte-derived macrophages: A sex-specific effect. Circulation. 100:2319–2325.
- Mæhre HK, Jensen IJ, Eilertsen KE. 2016. Enzymatic pre-treatment increases the protein bioaccessibility and extractability in Dulse (Palmaria palmata). Mar Drugs. 14(11):196.
- Rehana BH, Nagarajan N. 2013. GC–MS determination of bioactive components of Wedelia chinensis (Osbeck) Merrill. J Chem Pharm. 5(4):279–285.
- Rolo AP, Gomes AP, Palmeira CM. 2012. Regulation of mitochondrial biogenesis in metabolic syndrome. Curr Drug Targets. 12(6):872–878.
- Shenoy C, Patil MB, Kumar R, Patil S. 2009. Preliminary phytochemical investigation and wound healing activity of Allium Cepa Linn (Lilliacea). Int J Pharmacy and Pharm Sci. 2(2):167–176.
- Shukr MH, Ismail S, Ahmed SM. 2019. Development and optimization of ezetimibe nanoparticles with improved antihyperlipidemic activity. J Drug Deliv Sci Technol. 49:383–395.
- Surya S, Arun Kumar R, Carla B, Sunil C. 2017. Antihyperlipidemic effect of Ficus dalhousiae miq. stem bark on Triton WR-1339 and high fat diet-induced hyperlipidemic rats. Bull Fac Pharm Cairo Univ. 55:73–77.
- Uchida A, Tao K, Ogihara J, Matsufuji H, Ohta S, Sakuraiet H. 2008. Effects of jumbo leek on blood glucose level in streptozotocin-induced diabetic rats and liver damage in acetaminophen-treated rats. Nippon Shokuhin Kagaku Kogaku Kaishi. 55(11):549–558.
- Vargas JI, Arrese M, Shah VH, Arab JP. 2017. Use of statins in patients with chronic liver disease and cirrhosis: current views and prospects. Curr Gastroenterol Rep. 19(9):43.
- Vedder H, Anthes N, Stumm G, Würz C, Behl C, Krieg JC. 1999. Estrogen hormones reduce lipid peroxidation in cells and tissues of the central nervous system. J Neurochem. 72(6):2531–2538.
- Victor Antony Santiago J, Jayachitra J, Shenbagam M, Nalini N. 2012. Dietary d-limonene alleviates insulin resistance and oxidative stress-induced liver injury in high-fat diet and L-NAME-treated rats. Eur J Nutr. 51(1):57–68.
- Vidyavati HG, Manjunatha H, Hemavathy J, Srinivasan K. 2010. Hypolipidemic and antioxidant efficacy of dehydrated onion in experimental rats. J Food Sci Technol. 47:55–60.
- Wilkes JJ, Bonen A, Bell RC. 1998. A modified high-fat diet induces insulin resistance in rat skeletal muscle but not adipocytes. Am J Physiol. 275(4):E679–E686.
- Xiao DH, Pinto JT, Gundersen GG, Weinstein IB. 2005. Effects of a series of organosulfur compounds on mitotic arrest and induction of apoptosis in colon cancer cells. Mol Cancer Ther. 4:1388–1398.
- Yu FR, Lian XZ, Guo HY, McGuire PM, Li R, Wang R, Yu F. 2005. Isolation and characterization of methyl esters and derivatives from Euphorbia kansui (Euphorbiaceae) and their inhibitory effects on the human SGC-7901 cells. J Pharm Pharm Sci. 8(3):528–535.