
Abstract
To our knowledge, no study to date has assessed the ability of baseline Acute Physiology and Chronic Health Evaluation (APACHE) II score plus uric acid (UA) concentration to predict short-term clinical outcomes in patients with sepsis. This single-center retrospective cohort study analyzed 432 patients with sepsis who were followed up for at least 30-days between January 2016 and December 2018. The endpoint was death from any cause. Patients were categorized into four groups according to baseline APACHE II score and UA concentration, and the relationships between these parameters and all-cause in-hospital and 30-day mortality rates were analyzed. The in-hospital and 30-day all-cause mortality rates were 23.1% and 31.5%, respectively. Cox proportional hazard analysis showed that, after adjustment for confounding factors, APACHE II score ≥17.5 plus UA concentration ≥296.27 µmol/L were independently predictive of 30-day mortality (adjusted Model 1: hazard ratio [HR]=9.30, P=0.001; adjusted Model 2: HR=5.01, P=0.019). APACHE II score plus UA concentration was a strong independent predictor of short-term clinical outcomes in patients with sepsis. A higher APACHE II score plus higher UA concentration was significantly associated with adverse short-term outcomes.
Introduction
Sepsis is a major challenge in critical care(Ganesh et al. Citation2016). Studies have shown that sepsis affects 7–19% of patients in the intensive care unit (ICU), and that affected patients have a mortality rate of 20–70%(Wichmann et al. Citation2000; Angus et al. Citation2001; Angus and Wax Citation2001; Alberti et al. Citation2002; Martin Greg et al. Citation2003; Padkin et al. Citation2003; Brun-Buisson et al. Citation2004; Finfer et al. Citation2004).
ICU patients with sepsis require high levels of monitoring, nursing care, and integrated management, all of which are very expensive and consume a significant fraction of hospital resources(Lagu et al. Citation2012; Friedman Citation2014; Gooch and Kahn Citation2014; Khandelwal et al. Citation2014; Khandelwal et al. Citation2016). Although many parameters have been shown to predict outcomes in patients with sepsis(Gough et al. Citation2011; Chuang et al. Citation2014; Jung et al. Citation2015; Kung et al. Citation2016), these parameters require laboratory work and/or are expensive to determine. Therefore, easily measurable markers that can better predict sepsis are needed.
One marker used in the ICU is the Acute Physiology and Chronic Health Evaluation (APACHE) II score, which has been shown to be related to clinical outcomes in various critically ill patient cohorts(Li et al. Citation2014; Nakhoda et al. Citation2017). Uric acid (UA) is an end product of purine metabolism(So and Thorens Citation2010), which has been found to be elevated in patients with sepsis, but it is a poor predictor of prognosis(Akbar et al. Citation2015). UA has shown reduced early diagnostic sensitivity in neonatal patients with sepsis(Shalaby et al. Citation2017). Recently, a low serum UA concentration was reported to be prognostic of a low in-hospital mortality risk in patients with acute respiratory distress syndrome (ARDS)(Lee et al. Citation2019). However, little is known about the ability of UA concentration, or of APACHE II score plus UA concentration, to predict short-term clinical outcomes in patients with sepsis.
We hypothesized that APACHE II score combined with UA concentration can better predict short-term clinical outcomes in patients with sepsis than either APACHE II score or UA concentration alone. We, therefore, analyzed prognostic markers associated with short-term clinical outcomes in patients with sepsis.
Materials and methods
Study design and ethics
This single-center retrospective cohort study was approved by the institutional review board of the First Affiliated Hospital of Xi'an Jiaotong University (approval no. XJTU1AF2016LSY-88). Written informed consent was obtained from all participants, and the study was conducted according to the tenets of the Declaration of Helsinki and Good Clinical Practice guidelines.
Patient selection and groups
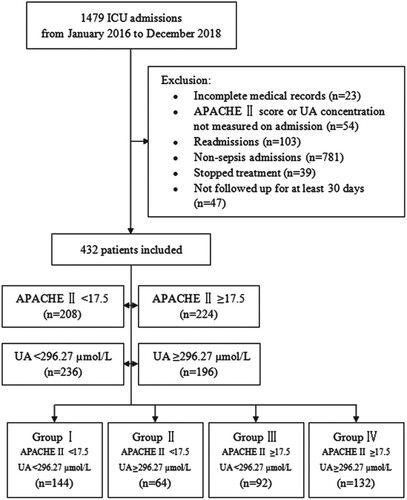
Patients with sepsis according to Sepsis 3 (Third International Consensus Definitions for Sepsis and Septic Shock) definition, were enrolled between January 2016 and December 2018 from the ICU, including the general ICU, surgical ICU (SICU), medical ICU (MICU), or emergency ICU (EICU). Patients were included if they had been evaluated by two senior experts upon admission and were followed up for at least 30 days. Patients were excluded if (i) their medical records were incomplete, (ii) their APACHE II scores or UA concentrations were not measured upon admission, (iii) they were admitted for a recurrent condition, (iv) they were not initially diagnosed with sepsis, (v) they stopped treatment voluntarily, or (vi) they were not followed up for at least 30-days. Patients were categorized into four groups on the basis of their baseline APACHE II scores and UA concentrations. Group I consisted of patients with APACHE II scores <17.5 and UA concentrations <296.27 µmol/L, Group II of patients with APACHE II scores <17.5 and UA concentrations ≥296.27 µmol/L, Group III of patients with APACHE II scores ≥17.5 and UA concentrations <296.27 µmol/L, and Group IV of patients with APACHE II scores ≥17.5 and UA concentrations ≥296.27 µmol/L (Figure ).
Figure 1. Flow diagram showing patient selection and grouping. Patients admitted to the ICU between January 2016 and December 2018 were assessed for possible enrollment. Of the 1479 ICU patients, 432 were enrolled on the basis of inclusion and exclusion criteria. Groups were categorized according to their baseline APACHE II score and UA concentration, with Group I including patients with APACHE II score <17.5 and UA concentration <296.27 µmol/L, Group II patients with APACHE II score <17.5 and UA concentration ≥296.27 µmol/L, Group III patients with APACHE II score ≥17.5 and UA concentration <296.27 µmol/L, and Group IV patients with APACHE II score ≥17.5 and UA concentration ≥296.27 µmol/L. Abbreviations: APACHE, Acute Physiology and Chronic Health Evaluation; UA, uric acid.
Data collection
Demographic and clinical data collected included patient age, sex, body mass index (BMI), mean arterial pressure (MAP), infection site, APACHE II score, Sequential Organ Failure Assessment (SOFA) score, vasoactive drugs use, mechanical ventilation and renal replacement therapy (RRT) at admission, length of hospital stay, in-hospital mortality, and 30-day mortality. Infection sites were categorized as respiratory tract, intra-abdominal, urinary tract, others, and multiple sites(Zahar et al. Citation2011). Laboratory and biochemical variables measured at ICU admission included white blood cell (WBC) count; hemoglobin (Hb); hematocrit; platelet count; concentrations of blood urea nitrogen (BUN), creatinine, UA, alanine transaminase (ALT), aspartate transaminase (AST), albumin, total cholesterol, total bilirubin, sodium (Na), potassium (K), pro-brain natriuretic peptide (pro-BNP), bicarbonate, lactate, and procalcitonin (PCT); activated partial thromboplastin time (APTT); prothrombin time (PT); and blood pH.
Clinical endpoint and follow up
The endpoint of the investigation was death from any cause. All participants were followed up for a minimum of 30 days after ICU admission. Mortality data were obtained from the hospital medical records and/or by telephone contact with the patient’s relatives.
Statistical Analysis: Continuous variables were expressed as mean ± SD. Normally distributed continuous variables of the four patient groups were compared by one-way analysis of variance (ANOVA), non-normally distributed continuous variables by rank sum tests, and categorical variables by Chi-squared test. The optimal cutoff points of receiver operating characteristic (ROC) curve analysis were those with the highest product of sensitivity and specificity for predicting 30-day mortality. The sensitivity, specificity, positive predictive value (PPV), negative predictive value (NPV), and 95% confidence interval (CI) of the ROC curves were determined using MedCalc (version 15.10). Comparisons among areas under ROC curves (AUCs) were also performed using MedCalc (version 15.10). Survival was analyzed by the Kaplan-Meier method, and the four patient groups were compared using log-rank tests. All statistical analyses were performed using SPSS version 19.0 software. All tests were two-sided, with P values <0.05 being considered statistically significant.
Results
Of the 1479 patients admitted to the ICU during the study period, 1047 (70.8%) were excluded from the study because their medical information was incomplete, their APACHE II score or UA concentration was not measured upon admission, or they were readmitted, or they were not diagnosed with sepsis, or they stopped treatment for various reasons, and/or they were not followed up for 30-days. Thus, 432 patients were included in the present study (Figure ).
Comparisons of demographic, clinical, and biochemical data in groups stratified by baseline APACHE II score and UA concentration
The mean age of the 432 patients was 59.2 ± 17.0 years, and 65.7% were males. Of these patients, 41.7% were infected at multiple sites, 29.6% had respiratory infections, and 13.0% had intra-abdominal infections. Surgical patients accounted for 44.91% of the total patients. Their mean APACHE II score was 18.8 ± 8.6, and their mean SOFA score was 8.3 ± 2.8; 44.4% received vasoactive drugs, 45.4% received mechanical ventilation, and 67.6% received RRT. The mean length of hospital stay was 9.1 ± 5.9 days. The total in-hospital mortality rate was 23.1%, and the total 30-day mortality rate was 31.5%. Mean UA concentration at ICU admission was 284.9 ± 157.4 µmol/L.
The demographic, clinical, and biochemical data of the four groups stratified by baseline APACHE II score and UA concentration are shown in Table . Compared with the other groups, Group IV had a higher proportion of male patients, significantly higher APACHE II and SOFA scores, higher proportions of patients receiving vasoactive drugs and RRT, higher in-hospital and 30-day mortality rates, and higher concentrations of BUN, creatinine, UA, AST, and lactate. Group IV patients also had significantly lower platelet counts, blood pH, and bicarbonate concentration than the other groups.
Table 1. Demographic, clinical, and biochemical characteristics of the four groups of patients stratified by baseline APACHE II score and UA concentration
Association of APACHE II score and/or UA concentration with 30-day mortality
The AUC for predicting 30-day mortality was higher for the combination of APACHE II score plus UA concentration (0.807; 95% CI, 0.75–0.87) than for either APACHE II score alone (0.775; 95% CI, 0.72–0.83) or UA concentration alone (0.709; 95% CI, 0.65–0.78). The optimal APACHE II score cutoff point with the highest product of sensitivity and specificity for predicting 30-day mortality was 17.5, which had a sensitivity of 79.4% (95% CI, 61.6–90.7%), specificity of 60.8% (95% CI, 48.7–71.7%), PPV of 86.5% (95% CI, 73.6–94.0%), and NPV of 48.2% (95% CI, 34.8–61.8%). The optimal cutoff point for UA concentration was 296.27 µmol/L, which had a sensitivity of 67.6% (95% CI, 49.4–82.0%), specificity of 64.9% (95% CI, 52.8–75.4%), PPV of 81.4% (95% CI, 68.7–89.9%), and NPV of 46.9% (95% CI, 32.8–61.6%). A combination of these two optimal cutoff points for predicting 30-day mortality had a sensitivity of 76.5% (95% CI, 58.4–88.6%), specificity of 67.6% (95% CI, 55.6–77.7%), PPV of 86.2% (95% CI, 74.1–93.4%), and NPV of 52.0% (95% CI, 37.6–66.1%). The diagnostic power of APACHE II score, UA concentration, and their combination for predicting 30-day mortality is shown in Figure and Table .
Figure 2. ROC curves of APACHE II score (solid blue line), UA concentration (solid green line), and APACHE II score plus UA concentration (solid red line) as predictors of 30-day mortality in patients with sepsis. Abbreviations: APACHE, Acute Physiology and Chronic Health Evaluation; ROC, receiver operating characteristic; UA, uric acid.
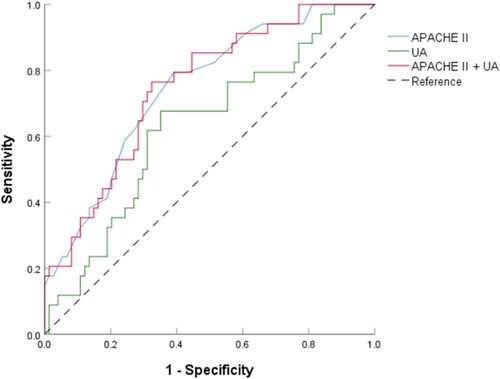
Table 2. Diagnostic ability of ROC curves for APACHE II score, UA concentration, and their combination for predicting 30-day mortality.
Effect of APACHE II score plus UA concentration on short-term mortality
During the 30-day follow-up period, 136 patients (31.5%) died, including 100 patients (23.1%) who died during hospital stay after ICU admission (Table ). Of the four patient groups, Group IV had the highest in-hospital mortality rate (P<0.001, Figure , Table ). Kaplan-Meier plots for these four groups showed that the risk of 30-day mortality was highest in Group IV, with a rapid divergence in its hazard curve (P<0.001, Figure ). Cox regression analysis showed that, compared with Group I, crude HRs for 30-day mortality were 3.20 (95% CI, 0.72–14.31; P=0.128) in Group II, 4.84 (95% CI, 1.28–18.24; P=0.002) in Group III, and 9.69 (95% CI, 2.86–32.84; P<0.001) in Group IV (unadjusted model). After adjusting for age, gender, infection site, SOFA score, hemoglobin, lactate, and PCT (Model 1), all of which were considered potential covariates or predictors of the endpoint, only Group IV showed a significantly higher risk of 30-day mortality (HR, 9.30; 95% CI, 2.54–33.99; P=0.001) than Group I. Further adjustment of Model 1 for use of vasoactive drugs, mechanical ventilation, and RRT (Model 2) showed that only Group IV was at significantly higher risk of 30-day mortality (HR, 5.01; 95% CI, 1.30–19.21; P=0.019) than Group I. Moreover, Hosmer-Lemeshow goodness of fit analysis found that both Model 1 (P=0.721) and Model 2 (P=0.262) showed a good fit for predicting 30-day mortality rates (Table ).
Figure 3. In-hospital mortality in the four groups of patients stratified by APACHE II score and UA concentration (P<0.001 by Chi-squared test for comparison among groups). Abbreviations: APACHE, Acute Physiology and Chronic Health Evaluation; UA, uric acid.
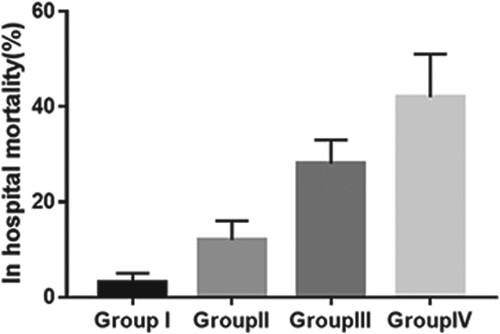
Figure 4. Kaplan-Meier analysis of cumulative 30-day mortality in the four groups of patients stratified by baseline APACHE II score and UA concentration (P<0.001 by log-rank test for overall comparison among groups). Group I: solid blue line; Group II: solid green line; Group III: solid red line, Group IV: solid purple line. Abbreviations: APACHE, Acute Physiology and Chronic Health Evaluation; UA, uric acid.
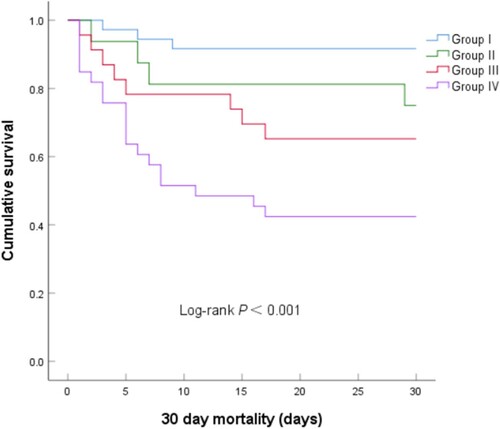
Table 3. Cox proportional hazards analyses for 30-day mortality in groups of patients stratified by baseline APACHE II score and UA concentration.
Discussion
Sepsis is a very common condition in ICU patients, which is associated with a high mortality rate, and consumption of considerable healthcare resources(Angus et al. Citation2001). Prediction of outcome has become an essential component of regular intensive management. This retrospective clinical investigation, therefore, evaluated the prognostic value of APACHE II score combined with UA concentration for 30-day mortality in patients with sepsis. Analysis showed that, although either of these parameters alone was useful in predicting 30-day mortality in patients with sepsis, their combination had greater predictive ability. Additionally, patients were grouped into four groups according to the optimal cutoff points on ROC curves of baseline APACHE II score and UA concentration to determine an early indicator of short-term mortality. Group IV, consisting of patients with APACHE II score ≥17.5 and UA concentration ≥296.27 µmol/L, exhibited the highest risks of in-hospital and 30-day mortality. Moreover, the significant association between APACHE II score plus UA concentration and 30-day mortality rate remained unaltered after adjusting for various confounding variables. Taken together, these findings showed that the combination of APACHE II score and UA concentration is a powerful independent predictor of short-term mortality in patients with sepsis, and that APACHE II score ≥17.5 plus UA concentration ≥296.27 µmol/L is significantly associated with adverse short-term clinical outcomes.
APACHE II score is a system that classifies the severity of disease and is widely used in ICUs. Points are assigned based on initial values of 12 routine physiologic measurements, age, and previous health status, providing a general measure of disease severity(Knaus et al. Citation1985). APACHE II score has been used to predict outcomes in critically ill patients. For example, APACHE II score could predict the severity and outcome of patients with acute intracerebral hemorrhage(Huang et al. Citation2016), and APACHE II score at discharge has been reported to predict post-ICU mortality and early ICU readmission in surgical ICU patients(Lee et al. Citation2015). However, little is known about its ability to predict short-term mortality in patients with sepsis, especially when combined with UA concentration. This study provides new evidence concerning the diagnostic ability and independent prognostic power of APACHE II score plus UA concentration on short-term mortality in patients with sepsis, showing that the combination of higher APACHE II score and higher UA concentration was associated with short-term mortality.
UA, a product of purine base metabolism, is a weak acid produced in the liver, muscles and intestines, and is excreted by the kidney and gut(Hediger et al. Citation2005). UA concentration has been shown to be a risk factor for the development of metabolic, renal, and cardiovascular diseases(Sharaf El Din et al. Citation2017). Moreover, high UA concentrations in patients with severe diseases are associated with poor to fatal outcomes(Erdag and Vitrinel Citation2004; Lazzeri et al. Citation2010; Patel et al. Citation2017). However, the mechanisms underlying the association between higher UA concentration and short-term mortality in patients with sepsis are not completely understood. UA is involved in pathological inflammatory reactions and oxidative stress(Perlstein et al. Citation2004; Ruggiero et al. Citation2006; Fabbri and Rabe Citation2007; Ruggiero et al. Citation2007; Zharikov et al. Citation2008; Johnson et al. Citation2013; Lewis and Maxwell Citation2014). Because inflammatory reactions(Chen et al. Citation2018; Yan et al. Citation2017; Zheng et al. Citation2017) and oxidative stress(Victor et al. Citation2009; Apostolova et al. Citation2011; Vera et al. Citation2015; Mantzarlis et al. Citation2017) are important pathophysiologic processes in sepsis, these findings suggest a correlation between UA and sepsis. Moreover, UA appeared to contribute to the higher total antioxidant capacity in patients with sepsis(Chuang et al. Citation2006). Our results suggest that UA concentration is a useful biomarker for severity and adverse outcomes in patients with sepsis. Additional studies are needed to determine the mechanisms underlying the association between UA concentration and mortality in patients with sepsis.
This study enrolled patients with sepsis, who tend to have adverse clinical outcomes. More powerful markers are needed to improve prognostic assessment and therapeutic decision-making in these patients. We found that the combination of two classical markers, APACHE II score and UA concentration, was a promising prognostic marker. Further studies are needed to confirm the prognostic value of this combination, enabling a more comprehensive evaluation of patients with sepsis. Higher APACHE II score combined with higher UA concentration on ICU admission can enable risk stratification of these patients.
Study limitations
This study has several limitations. First, the optimal cutoff points for APACHE II score and UA concentrations were arbitrarily determined and used as the standards for grouping of patients, which may have resulted in subjective bias. Second, the relatively small number of patients may have limited the use of Cox proportional hazards models with more covariates, which may have led to the classification of some factors as non-significant or marginally significant. Third, the single-center design, relatively small sample size, and sample endpoint events may have introduced selection and information biases. Fourth, we did not analyze the prognostic value of APACHE II score and UA concentration at discharge from the ICU. Additional multicenter studies, as well as studies of serially measured parameters, are needed to clarify the predictive value of the combination of APACHE II score and UA concentration for short-term clinical outcomes in patients with sepsis.
Conclusions
In conclusion, this study showed that a combination of baseline APACHE II score and UA concentration can have greater prognostic value than either parameter alone and can be a powerful independent prognostic marker for short-term clinical outcomes in patients with sepsis. Moreover, the combination of higher APACHE II score and higher UA concentration was associated with poorer short-term clinical outcomes in these patients. Although further research is required to determine the mechanisms linking APACHE II score, UA concentration, and mortality, this study suggests the need for assessing these parameters in future investigations.
Declaration of interest statement
None.
Acknowledgments
The authors appreciate and thank the whole team for assistance and fruitful discussions.
Disclosure statement
No potential conflict of interest was reported by the author(s).
Data availability statement
Due to the nature of this research, participants of this study did not agree for their data to be shared publicly, so supporting data is not available.
Additional information
Funding
References
- Akbar SR, Long DM, Hussain K, Alhajhusain A, Ahmed US, Iqbal HI, Ali AW, Leonard R, Dalton C. 2015. Hyperuricemia: An Early Marker for Severity of Illness in Sepsis. Int J Nephrol. 2015:301021. https://pubmed.ncbi.nlm.nih.gov/26294973/.
- Alberti C, Brun-Buisson C, Burchardi H, Martin C, Goodman S, Artigas A, Sicignano A, Palazzo M, Moreno R, Boulmé R, et al. 2002. Epidemiology of sepsis and infection in ICU patients from an international multicenter cohort study. Intensive Care Med. 28(2):108–121.
- Angus DC, Linde-Zwirble WT, Lidicker J, Clermont G, Carcillo J, Pinsky MR. 2001. Epidemiology of severe sepsis in the United States: analysis of incidence, outcome, and associated costs of care. Crit Care Med. 29(7):1303–1310.
- Angus DC, Wax RS. 2001. Epidemiology of sepsis: an update. Crit Care Med. 29(7):S109–S116.
- Apostolova N, Garcia-Bou R, Hernandez-Mijares A, Herance R, Rocha M, Victor VM. 2011. Mitochondrial antioxidants alleviate oxidative and nitrosative stress in a cellular model of sepsis. Pharm Res. 28(11):2910–2919.
- Brun-Buisson C, Meshaka P, Pinton P, Vallet B, EPISEPSIS Study Group. 2004. EPISEPSIS: A reappraisal of the epidemiology and outcome of severe sepsis in French intensive care units. Intensive Care Med. 30(4):580–588.
- Chen Z, Shao Z, Mei S, Yan Z, Ding X, Billiar T, Li Q. 2018. Sepsis Upregulates CD14 Expression in a MyD88-Dependent and Trif-Independent Pathway. Shock. 49(1):82–89. https://pubmed.ncbi.nlm.nih.gov/28562479/.
- Chuang CC, Shiesh SC, Chi CH, Tu YF, Hor LI, Shieh CC, Chen MF. 2006. Serum total antioxidant capacity reflects severity of illness in patients with severe sepsis. Crit Care. 10(1):R36. https://pubmed.ncbi.nlm.nih.gov/16507162/.
- Chuang T, Chang H, Chung K, Cheng H, Liu C, Liu Y, Huang H, Chou T, Chang B, Lee M, et al. 2014. High levels of serum macrophage migration inhibitory factor and interleukin 10 are associated with a rapidly fatal outcome in patients with severe sepsis. Int J Infect Dis. 20:13–17.
- Erdag G, Vitrinel A. 2004. Can urinary uric acid/creatinine ratio be used as an additional marker for neonatal asphyxia. Int Pediatr. 19(4):217–219.
- Fabbri L, Rabe K. 2007. From COPD to chronic systemic inflammatory syndrome. Lancet. 370(9589):797–799.
- Finfer S, Bellomo R, Lipman J, French C, Dobb G, Myburgh J. 2004. Adult-population incidence of severe sepsis in Australian and New Zealand intensive care units. Intensive Care Med. 30(4):589–596.
- Friedman AB. 2014. Economic incentives and use of the intensive care unit. JAMA. 311(22):2336–2337. https://pubmed.ncbi.nlm.nih.gov/24915272/.
- Ganesh K, Sharma RN, Varghese J, Pillai MG. 2016. A profile of metabolic acidosis in patients with sepsis in an intensive care unit setting. Int J Crit Illn Inj Sci. 6(4):178–181.
- Gooch RA, Kahn JM. 2014. ICU bed supply, utilization, and health care spending: an example of demand elasticity. JAMA. 311(6):567–568.
- Gough M, Morgan M, Mack C, Darling D, Frasier L, Doolin K, Apostolakos M, Stewart J, Graves B, Arning E, et al. 2011. The ratio of arginine to dimethylarginines is reduced and predicts outcomes in patients with severe sepsis. Crit Care Med. 39(6):1351–1358.
- Hediger M, Johnson R, Miyazaki H, et al. 2005. Molecular physiology of urate transport. Physiology. 20:125–133.
- Huang Y, Chen J, Zhong S, Yuan J. 2016. Role of APACHE II scoring system in the prediction of severity and outcome of acute intracerebral hemorrhage. Int J Neurosci. 126(11):1020–1024.
- Johnson RJ, Nakagawa T, Sanchez-Lozada LG, Shafiu M, Sundaram S, Le M, Ishimoto T, Sautin YY, Lanaspa MA. 2013. Sugar, uric acid, and the etiology of diabetes and obesity. Diabetes. 62(10):3307–3315.
- Jung WJ, Park BH, Chung KS, Kim SY, Kim EY, Jung JY, Kang YA, Kim YS, Kim SK, Chang J, et al. 2015. Glucagon levels, disease severity, and outcome in severe sepsis. Shock. 43(6):563–568.
- Khandelwal N, Benkeser D, Coe NB, Engelberg RA, Teno JM, Curtis JR. 2016. Patterns of Cost for patients Dying in the intensive care unit and Implications for Cost Savings of Palliative care Interventions. J Palliat Med. 19(11):1171–1178.
- Khandelwal N, Engelberg RA, Benkeser DC, Coe NB, Curtis JR. 2014. End-of-life expenditure in the ICU and perceived quality of dying. Chest. 146(6):1594–1603.
- Knaus WA, Draper EA, Wagner DP, Zimmerman JE. 1985. APACHE II: a severity of disease classification system. Crit Care Med. 13(10):818–829.
- Kung C-T, Su C-M, Chen CT, Cheng H-H, Chang M-W, Hung C-W, Hung S-C, Ching W-N, Tsai N-W, Wang H-C. 2016. Circulating endothelial progenitor cells may predict outcomes in adult patients with severe sepsis in the emergency department. Clin Chim Acta. 455:1–6.
- Lagu T, Rothberg M, Shieh M, Pekow P, Steingrub J, Lindenauer P. 2012. Hospitalizations, costs, and outcomes of severe sepsis in the United States 2003 to 2007. Crit Care Med. 40(3):754–761.
- Lazzeri C, Valente S, Chiostri M, Sori A, Bernardo P, Gensini GF. 2010. Uric acid in the acute phase of ST elevation myocardial infarction submitted to primary PCI: its prognostic role and relation with inflammatory markers: a single center experience. Int J Cardiol. 138(2):206–209.
- Lee HW, Choi SM, Lee J, Park YS, Lee CH, Yim JJ, Yoo CG, Kim YW, Han SK, Lee SM. 2019. Serum Uric Acid Level as a Prognostic Marker in Patients With Acute Respiratory Distress Syndrome. J Intensive Care Med. 34(5):404–410. https://pubmed.ncbi.nlm.nih.gov/28351229/.
- Lee H, Lim C, Hong H, Ju J, Leong Y, Hwang J, Park H. 2015. Efficacy of the APACHE II score at ICU discharge in predicting post-ICU mortality and ICU readmission in critically ill surgical patients. Anaesth Intensive Care. 43(2):175–186.
- Lewis G, Maxwell A. 2014. Risk factor control is key in diabetic nephropathy. Practitioner. 258(1768):13–17.
- Li H-y, Li S-j, Yang N, Hu W-l. 2014. Evaluation of nosocomial infection risk using APACHE II scores in the neurological intensive care unit. J Clin Neurosci. 21(8):1409–1412.
- Mantzarlis K, Tsolaki V, Zakynthinos E. 2017. Role of oxidative stress and Mitochondrial Dysfunction in sepsis and potential Therapies. Oxid Med Cell Longev. 2017:5985209. https://pubmed.ncbi.nlm.nih.gov/28904739/.
- Martin Greg S, Mannino David M, Eaton S, Moss M. 2003. The epidemiology of sepsis in the United States from 1979 through 2000. N Engl J Med. 348(16):1546–1554.
- Nakhoda S, Zimrin A, Baer M, Law J. 2017. Use of the APACHE II score to assess impact of therapeutic plasma exchange for critically ill patients with hypertriglyceride-induced pancreatitis. Transfus Apher Sci. 56(2):123–126.
- Padkin A, Goldfrad C, Brady AR, Young D, Black N, Rowan K. 2003. Epidemiology of severe sepsis occurring in the first 24 hrs in intensive care units in England, Wales, and Northern Ireland. Crit Care Med. 31(9):2332–2338.
- Patel K, Makadia M, Patel V, et al. 2017. Urinary uric acid/creatinine ratio – A marker for Perinatal Asphyxia. J Clin Diagn Res. 11(1):SC8–SC10.
- Perlstein TS, Gumieniak O, Hopkins PN, Murphey LJ, Brown NJ, Williams GH, Hollenberg NK, Fisher ND. 2004. Uric acid and the state of the intrarenal renin-angiotensin system in humans. Kidney Int. 66(4):1465–1470.
- Ruggiero C, Cherubini A, Ble A, et al. 2006. Uric acid and inflammatory markers. Eur Heart J. 27(10):1174–1181.
- Ruggiero C, Cherubini A, 3rd, Miller E, Maggio M, Najjar SS, Lauretani F, Bandinelli S, Senin U, Ferrucci L. 2007. Usefulness of uric acid to predict changes in C-reactive protein and interleukin-6 in 3-year period in Italians aged 21 to 98 years. Am J Cardiol. 100(1):115–121.
- Shalaby MM, Sobeih AA, Abdulghany WE, Behiry EG, Ismail YM, Abd-El-Aziz MA. 2017. Mean platelet volume and serum uric acid in neonatal sepsis: A case-control study. Ann Med Surg (Lond. 20:97–102.
- Sharaf El Din UAA, Salem MM, Abdulazim DO. 2017. Uric acid in the pathogenesis of metabolic, renal, and cardiovascular diseases: A review. J Adv Res. 8(5):537–548.
- So A, Thorens B. 2010. Uric acid transport and disease. J Clin Invest. 120(6):1791–1799.
- Vera S, Martínez R, Gormaz J, et al. 2015. Novel relationships between oxidative stress and angiogenesis-related factors in sepsis: New biomarkers and therapies. Ann Med. 47(4):289–300.
- Victor VM, Espulgues JV, Hernandez-Mijares A, Rocha M. 2009. Oxidative stress and mitochondrial dysfunction in sepsis: a potential therapy with mitochondria-targeted antioxidants. Infect Disord Drug Targets. 9(4):376–389.
- Wichmann MW, Inthorn D, Andress HJ, Schildberg FW. 2000. Incidence and mortality of severe sepsis in surgical intensive care patients: the influence of patient gender on disease process and outcome. Intensive Care Med. 26(2):167–172.
- Yan R, van Meurs M, Popa ER, Jongman RM, Zwiers PJ, Niemarkt AE, Kuiper T, Kamps JA, Heeringa P, Zijlstra JG, et al. 2017. Endothelial Interferon Regulatory Factor 1 Regulates Lipopolysaccharide-Induced VCAM-1 Expression Independent of NFkB. J Innate Immun. 9(6):546–560. https://pubmed.ncbi.nlm.nih.gov/28658674/.
- Zahar J-R, Timsit J-F, Garrouste-Orgeas M, Français AV, Aurélien D-DA, Dubois Y, Souweine B, Haouache H, Goldgran-Toledano D, Allaouchiche B, et al. 2011. Outcomes in severe sepsis and patients with septic shock: pathogen species and infection sites are not associated with mortality. Crit Care Med. 39(8):1886–1895.
- Zharikov S, Krotova K, Hu H, et al. 2008. Uric acid decreases NO production and increases arginase activity in cultured pulmonary artery endothelial cells. Am J Physiol Cell Physiol. 295(5):C1183–C1190.
- Zheng G, Pan M, Jin W, et al. 2017. MicroRNA-135a is up-regulated and aggravates myocardial depression in sepsis via regulating p38 MAPK/NF-κB pathway. Int Immunopharmacol. 45:6–12.