
ABSTRACT
We aimed to explore the tolerance of esophageal cancer cells to radiation and to observe the morphological and gene expression changes in the cells following irradiation. The esophageal cancer cell line, Eca109, was cultured in vitro and was irradiated with a 6-MeV electron beam at a dose of 3 Gy once every other day, resulting in a cumulative dose of 15 Gy to 21 Gy. After radiotherapy, total RNA was extracted and was analyzed using a whole-transcription expression chip, and non-irradiated Eca109 cells were used as control. Gene ontology and pathway analyses were then performed on the differentially expressed genes. Approximately 99% of adherent cells were transformed into giant, malformed, multinucleated cells with mitotic catastrophe. One week after radiation was ceased, cells with normal morphology were observed adjacent to the cells with mitotic catastrophe, and over time, they formed clones. Ribosomal biosynthesis, mitotic nuclear division biological processes, and ubiquitin-mediated proteolysis might be the important mechanisms involved in radiation-induced mitotic catastrophe.
Introduction
Radiotherapy is an important treatment for esophageal cancer. Preoperative chemo-radiotherapy is the standard treatment for resectable esophageal cancer; however, its 5-year survival rate is only 30–40% (al-Sarraf et al. Citation1997; Stahl et al. Citation2012; van Hagen et al. Citation2012). The median survival time of patients who have undergone definitive chemo-radiotherapy is approximately 17.7 months (Minsky et al. Citation2002), with local recurrence being the main cause of relapse.
Currently, the mechanisms underlying tumor recurrence after radiotherapy are unclear. Some studies have shown that radiotherapy can induce epithelial–mesenchymal transition (EMT) in tumor cells via the reactive oxygen species (ROS)-TGFβ/SMAD pathway (Zavadil and Bottinger Citation2005; Lamouille et al. Citation2014), which increases the invasiveness and metastasis of tumor cells, as well as their resistance to radiotherapy (Wild-Bode et al. Citation2001). Other studies have suggested that the formation of radiation-induced cancer stem cells is an important mechanism of tumor resistance to radiotherapy (Cojoc et al. Citation2015; Kurth et al. Citation2015; Chang et al. Citation2016; Lyakhovich and Lleonart Citation2016; Krause et al. Citation2017). Induction of oncogenic metabolism by ionizing radiation is another mechanism of radioresistance (Boroughs and DeBerardinis Citation2015; Mims et al. Citation2015). All of these results provide insights into the mechanism of cancer resistance to radiotherapy; however, the specific changes that occur in cancer cells during irradiation are not well understood.
The main biological effects of radiotherapy are direct damage of DNA and indirect damage by reactive oxygen species generated by ionization. Cells with mild DNA damage may be repaired, but the majority of cells with severe DNA damage undergo cell death, apoptosis, aging, and mitotic disorders because of irradiation (Wang et al. Citation2018). The mechanism whereby cancer cells survive a massive dose of irradiation and then restart proliferating remains unclear.
In this study, to explore the survival mechanisms of esophageal cancer cells under radiation stress, which leads to changes in gene expression, we treated the esophageal cancer cell line, Eca109, with an accumulated radiation dose of 15–21 Gy by applying doses of 3 Gy over a period of 2 weeks. Mitotic catastrophe was found to be the main morphological change in esophageal cancer cells that transiently survived after exposure to radiation. Approximately 99% of cells became large and multinucleated after a radiation dose of 18 Gy. Compared with non-irradiated cells, 223 genes were up-regulated and 742 genes were down-regulated in irradiated cells. The up-regulated genes were mainly related to inflammation and immune response, while the down-regulated genes were mainly related to mitotic nuclear division, ribosomal biosynthesis, and ubiquitin-mediated proteolysis The EMT marker genes (CDH1, CDH2, SNAI2, SNAI1, and ZEB1) all showed less than two-fold difference in their expression after irradiation. We also observed that approximately 1 week after the completion of radiotherapy, new cells with normal size and morphology re-emerged at the edge of the giant multinucleated cell colonies and formed clones via proliferation that resembled fission.
Materials and methods
Cell culture
The human esophageal cancer cell line, Eco13, was purchased from the Shanghai Cell Bank (Shanghai Biology Institute, Chinese Academy of Science; Shanghai, China) and was cultured in DMEM (GBICO Inc., NY, USA) containing 10% fetal bovine serum at 37°C in a constant-temperature cell incubator with 5% CO2. Cells were seeded in a Corning 25 cm2 gas permeable cell culture flask (Corning Inc., Corning, NY, USA) at a density of 1 × 10⁶ cells/mL. This study was approved by Tumor Hospital affiliated to Xinjiang Medical University.
Cell grouping
We divided the cells into three groups according to cell count, with 4 flasks per group, such that the cell density in each flask was between 106 and 107 cells/mL. The cells in groups A, B, and C were given a cumulative radiation dose of 18 Gy over 13 d, divided into 6 doses; 15 Gy over 12 d, divided into 5 doses; and 21 Gy over 18 d, divided into 7 doses, respectively. Group D served as control and was given mock irradiation.
Cell radiation
The liquid level of the culture medium was maintained at 0.5 cm, and the light-limiting barrel was placed close to the liquid surface. The source skin distance was 95 cm. A 6-MeV electron beam was administered using an Elekta Linear Accelerator (Elekta, Stockholm, Sweden) at a dose rate of 500 cGy/min and a dose frequency of 300 cGy. Cells in groups A, B, and C were irradiated once every other day except on weekends, while the cells in Group D received mock irradiation without an electronic beam.
RT-qPCR
Total RNA was extracted from cells using TRIzol (Invitrogen), and cDNA was synthesized using PrimeScript® RT regent kit with gDNA Eraser (Takara Biotechnology, Cat:RR04A). Real-time PCR was performed using TB Green® Premix Ex Taq II (Takara Biotechnology, Cat#:RR820A). The relative gene expression levels were calculated using the 2-ΔΔCt method. The primers of CCL5, GDF15, and ISG15 and β-actin are listed in Table .
Table 1. The primers used for CCL5, GDF15, ISG15, and β-actin genes.
Cell cycle and Ki-67 detection
Cell cycle kit (Solarbio, cat# ca1510) was used to analyze the cell cycle by flow cytometer. Briefly, 1×10⁶ cells were digested with 1% trypsin, and fixed with 70% alcohol for 2 h, then the alcohol was removed through centrifugation, and the cells were washed with PBS twice. Next, 100 µL RNase A solution was added to the cells and the cells were incubated for 30 min at 37°C. Then, 400 µL of propidium iodide (PI) solution was added to the cells and the cells were incubated at 4°C in dark for 30 min. After incubation, the cells were analyzed using flow cytometer.
Ki-67 expression in cells was detected using flow cytometer. Cells were fixed and washed as above. Every tube of cells was equally divided into two tubes. Cells of one tube were incubated with PE-mouse anti-human Ki-67 antibody (BioLegend, Cat# 35053), while cells of the other tube were incubated with PE-mouse-IgG1 isotype (BD Pharmingen) in dark for 30 min. Next, the cells were washed with 2 mL of PBS, the PBS was removed by centrifugation, and the cells were resuspended in 100 µL PBS. Then, the cells were analyzed using flow cytometer.
Survival cell number monitoring
Twenty-four hours after each dose of irradiation, cells were photographed, the medium and suspended dead cells were removed, and the remaining adherent cells were washed 3 times with PBS. The adherent cells were then digested with 1% trypsin, centrifuged at 1000 rpm for 5 min, and resuspended in fresh medium. A 2-µL aliquot of the cell suspension was mixed with 8 µL of 0.4% Trypan blue and the cells were observed using Optical microscope (Olympus Company Ltd., Model BX50) to determine the number of living and dead cells. The remaining cells were seeded into new flasks for the next irradiation dose. For 3 weeks after the irradiation treatment was completed, the cells were treated as above every 3 d.
Total RNA extraction
Cells (1 × 10⁶) in groups A and D were lysed 48 h after radiation was ceased to extract total RNA using TRIzol (Life Technologies, Carlsbad, CA, USA). The medium was discarded and 1 mL TRIzol was added to the flask, which was shaken lightly on ice for 10 min to detach the cells from the bottom. The lysate was collected in a 1.5-mL Eppendorf tube, to which 0.2 mL of chloroform was added and samples were mixed vigorously for 30 s. The samples were then centrifuged at 15,000 rpm and 4°C for 15 min and the resulting aqueous phase was transferred to another Eppendorf tube. Isopropanol (0.5 mL) was added and the samples were shaken, after which they were centrifuged for 15,000 rpm at 4°C for 15 min. The resulting pellet was washed carefully with 75% ethanol and was then dissolved in 20 µL of diethyl pyrocarbonate-treated water.
Whole-transcriptome expression analysis
The GeneChip WT PLUS Reagent Kit (Thermo Fisher Scientific, Waltham, MA, USA) was used to prepare samples for microarray analysis. Double-stranded DNA was synthesized from 500 ng of RNA. In the second cycle, single-stranded cDNA (ss-cDNA) was fragmented and labeled with biotin using terminal deoxynucleotidyl transferase. The samples were then hybridized to microarrays at 45°C for 16–18 h using the Affymetrix Clariom S Assay (human; Cat No 902926; Thermo Fisher Scientific). After hybridization, phycoerythrin streptavidin was used to clean and stain the microarrays on an Affymetrix Fluidics Station 450. The Affymetrix GeneChip Command Console was then used to scan the microarrays. The Robust Multichip Analysis (RMA) algorithm was used for data analysis, with global scales and default analyzers used as normalization methods. The data were expressed as signal intensities of log2 RMA. Student’s t-test was used to analyze normalized gene expression data to screen for differentially expressed genes (DEGs). Genes with a fold change greater than 1.5 or less than −1.5 and a P-value less than 0.05 were defined as DEGs. Pathway enrichment and Gene Ontology (GO) analyses were then used to determine the function of DEGs. Fisher’s test was used to determine whether the overlap of the DEG list and the GO annotation list was more than the expected value using the top GO software package. Kyoto Encyclopedia of Genes and Genomes (KEGG) pathway analysis was used to map genes to functional pathways by Fisher’s test.
Results
Surviving cells during and after radiation
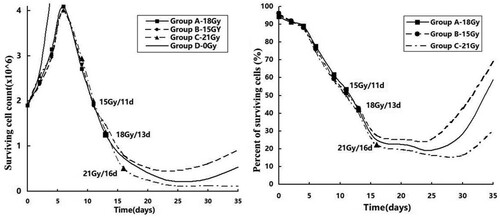
The total numbers of cells in groups A, B, and C increased until the radiation dose of 9 Gy/3 Gy/3 f/6 d, reaching a peak on the 6th day (Figure , left panel). The peak was 2.15 times the initial cell number (4.09/1.9), after which the cell count decreased rapidly. The lowest cell count was observed on the 25th day, when it was 11% (0.21/1.9), 24.2% (0.46/1.9), and 6.3% (0.12/1.9) of the initial count for groups A, B, and C, respectively. The cell count in groups A and B gradually increased to 28% and 48% of the initial counts, respectively, by the 35th day. However, the number of cells in group C continued to decrease and dropped to 5.7% of the initial count on the 35th day. Cells in group D had a doubling time of 3.25 d (4/(log(4.47/1.9, 2))). The percentage of surviving cells in groups A, B, and C showed a downward trend starting at the beginning of radiotherapy (Figure , right panel). Two weeks after ceasing of radiotherapy, the cell count for groups A, B, and C decreased to a minimum of 19.3%, 25.1%, and 16.3% of the initial count compared to the control group, respectively. On day 35, cell viability in group A and group B was restored to 59% and 69%, respectively, while in group C, it was restored to 30% of the initial cell viability.
Figure 1. Percentage of cells that survived radiation treatment.
Note: The left panel shows the total number of cells. The right panel shows the percentage of surviving cells.
Morphological changes in cells during radiation
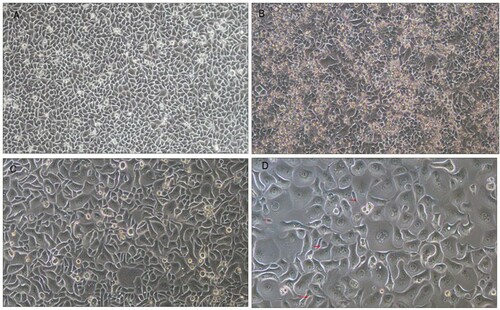
Before radiation, cells appeared to be spindle-shaped and were of uniform size (Figure (A)). With the accumulation of radiation doses, a large number of dead cells were suspended in the culture medium and some surviving adherent cells developed into large abnormal cells after receiving 9 Gy radiation, as shown in Figure (B). As the dose of radiotherapy increased to 12 Gy, approximately 70% of adherent viable cells became giant, malformed, multinucleated cells (Figure (C)) and with a further increase in radiation dose to 18 Gy, approximately 99% of adherent viable cells exhibited a mitotic catastrophe phenotype. Only a very small number of normal cells remained at this dose (Figure (D)).
Figure 2. Cell morphology changes during irradiation.
Note: Optical microscope, ×100. A, Before irradiation. B, At a dose of 9 Gy/3 f/6 d, a large number of dead cells was suspended, shown as a small highlighted circle in the clustered area. Some cells appeared as giant, abnormal, multinucleated cells. C, At a dose of 12 Gy/4 f/9 d, a large number of surviving cells became giant, abnormal, and multinucleated. D, Almost all surviving cells became giant, abnormal, multinucleated cells. Only a few cells maintained normal morphology.
Changes in cells after radiation was ceased
After radiation treatment was ceased, most giant, malformed, multinuclear cells died and were unable to grow when re-seeded. These were washed away when changing the medium. The number of malformed multinucleated cells that were still adherent increased and after approximately 1 week, new morphologically normal cells appeared at the edges of the colonies (Figure (A)). As time went on, an increasing amount of cell proliferation was observed around the edges of the giant cell colonies, and these new cells finally formed new clones 2 weeks after radiation was ceased (Figure (B,C)).
Figure 3. Cell recrudescence after irradiation.
Note: Optical microscope, ×100. A, B, and C were taken 7, 10, and 14 d after radiation was ceased, respectively. The red arrow indicates new cells or clones. D, E Optical microscope, ×400. D, Two weeks after radiation was ceased, cells propagated by fission, as in giant, abnormal, multinucleated cells. E, Mitosis telophase in a tumor cell with normal morphology 2 weeks after radiation was ceased.
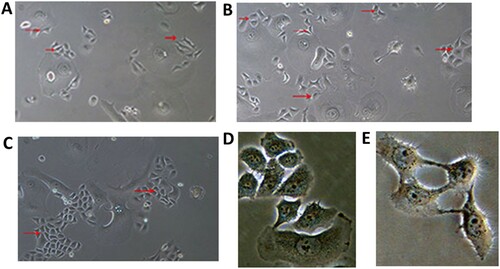
Two weeks after the end of radiation treatment (at a dose of 18 Gy/3 Gy/13 days), a small number of cells were seeded at a low density (500 cells/well, inoculated in 6-well cell culture plates), which proliferated by mitosis (Figure (D,E)). However, the large deformed cells proliferated in a manner similar to fission propagation, forming a line of cell clones (Figure ).
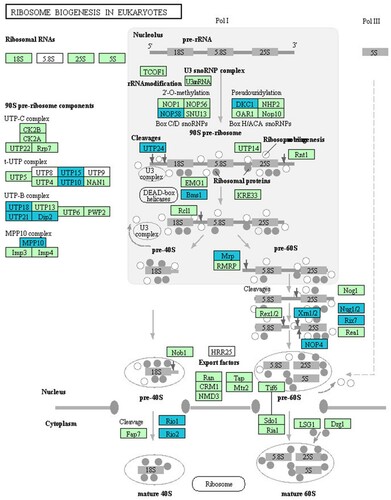
Figure 4. DEGs involved in ribosome biogenesis.
Cell cycle and Ki-67
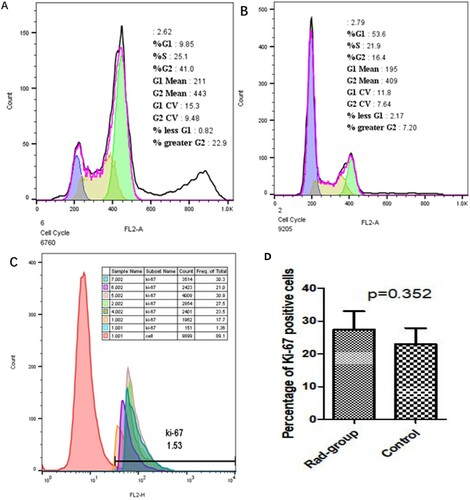
The results of cell cycle analysis are shown in Figure (A–C). Approximately 53% of cells in control group were in G1 phase, while only 21.9% of cells in Rad group were in G1 phase. The cell cycle of most cells in the Rad group was blocked at G2/M phase, and had an additional heteroploid peak. The mean number of Ki-67 positive cells in the Rad group was 27.44 ± 5.55%, while that in the control group was 22.9 ± 4.92%. There was no significant difference between the two groups based on the number of Ki-67 positive cells (Figure ).
Figure 5. Cell cycle and Ki-67 expression.
Note: A: Results of cell cycle analysis showed that most cells of control group were in G1 phase, B: The cell cycle of most cells in Rad group was blocked at G2/M phase, and had an additional heteroploid peak. C: The mean number of Ki-67 positive cells in the control group and the Rad group. Control group consisted of samples 1, 2, and 4 and Rad group consisted of samples 5, 6, and 7. Every sample was split into two parts, part 1 was incubated with PE-mouse-IgG1 as negative control, while part 2 was incubated with PE-mouse anti-human Ki-67 antibody.
Gene expression results
Differentially expressed genes
A total of 233 up-regulated genes and 742 down-regulated genes were detected using a threshold of fold change greater than 2. Among the up-regulated genes, sorted according to fold-change values, most were inflammatory factor genes, cell cycle-suppressing genes, or immune activation genes, such as CCL5, GDF15, ISG15, OASL, and CDKN1A. Among the down-regulated genes, those that were most markedly down-regulated were ribosome biosynthesis and RNA binding genes, such as PUS7, SLC25A43, EEA1, NUF2, and TYW3. Table lists the top 15 up-regulated and down-regulated genes and Figure (A–C) shows the expression levels of CCL5, GDF15, ISG15.
Figure 6. The fold change (Rad-group to control group) in relative mRNA expression of CCL5, GDF15, and ISG15.
Note: A: The fold change (Rad-group to control group) between relative mRNA expression of β-actin and CCL5. B: The fold change (Rad-group to control group) between relative mRNA expression of β-actin and GDF15. C: The fold change (Rad-group to control group) between relative mRNA expression of β-actin and ISG15.
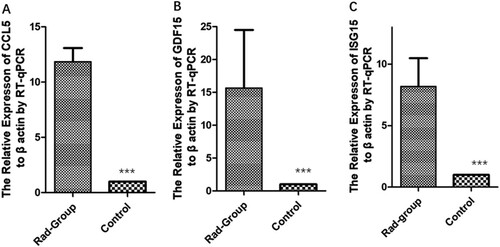
Table 2. The top 15 up-regulated and down-regulated genes ranked by fold change.
GO analysis
GO analysis of biological process (BP), cellular component (CC), and molecular function (MF) was performed for DEGs and these terms were ranked according to P-value and fold enrichment (FE). The top three BP terms were cell cycle (P = 3.72 × 10⁻⁵, FE = 1.57), mitotic nuclear division (P = 3.90 × 10⁻⁵, FE = 2.4), and snRNA transcription from RNA polymerase II promoter (P = 3.76 × 10⁻⁴, FE = 2.45). The top three CC terms were microtubules (P = 1.25 × 10⁻⁵, FE = 1.12), intracellular membrane organelles (P = 2.17 × 10⁻⁵, FE = 1.29), and chromosome centromeres (P = 1.75 × 10⁻³, FE = 3.85). The top three MF terms were RNA binding (P = 0.00176, FE = 1.17), rRNA binding (P = 0.00745, FE = 2.15), and DNA-dependent ATPase activation (P = 0.00124, FE = 2.38). Table lists the top 5 BP, CC, and MF terms. As shown in Table , 17 cell cycle-related genes were down-regulated and 1 was up-regulated. There were 32 down-regulated genes in the ‘mitotic nuclear division’ term. Additionally, 17 genes were down-regulated in the ‘microtubule’ term.
Table 3. Gene ontology analysis ranked by P-value.
Table 4. List of the DEGs associated with ‘cell cycle’, ‘mitotic nuclear division’, and ‘microtubule’ terms.
KEGG pathway analysis
DEGs were analyzed for enrichment in KEGG pathways and were ranked according to P-value. The most enriched pathways were ribosomal biosynthesis in eukaryotes (P = 7.74 × 10⁻⁸, FE = 2.33), ubiquitin-mediated proteolysis (P = 6.32 × 10⁻⁴, FE = 2.33), homologous recombination (P = 1.72 × 10⁻³, FE = 3.46), mRNA surveillance (P = 3.61 × 10⁻³, FE = 3.61), RNA transport (P = 3.62 × 10⁻³, FE = 2.0), and the cell cycle (P = 4.42 × 10⁻³, FE = 2.13). Among these pathways, the ribosomal biosynthesis pathway ranked first. This pathway consisted of 72 expressed genes, of which 18 were significantly down-regulated (Table ). This was followed by the ubiquitin-mediated proteolysis pathway.
Table 5. DEGs involved in the ribosome biogenesis pathway.
Discussion
Mitotic catastrophe, but not EMT, was the major change observed in cells that survived radiation in this study. This may be due to the larger fractional dose and shorter exposure time in this study compared with other studies (Lee et al. Citation2017). When mitotic failure is detected, cells are driven to enter irreversible anti-proliferative pathways, such as apoptosis, nuclear necrosis, and senescence (Galluzzi et al. Citation2012). A characteristic of mitotic catastrophe is that a single nucleated cell develops into large multinucleated or micronucleated cells when cell division is blocked at a certain stage of the mitotic cycle. These abnormal cells are either killed directly due to their nuclear abnormality, die at the G1 phase while mitosis reboots, or undergo senescence (Vitale et al. Citation2011).
Ionizing radiation damages cells directly or through the production of reactive oxygen species during radiotherapy. It causes various forms of DNA damage, such as double-stranded DNA breaks, single-stranded DNA breaks, DNA cross-linking, and DNA–protein cross-linking. The consequences of this damage are direct cell death, DNA damage repair, initiation of apoptosis, and mitotic catastrophe (Lewanski and Gullick Citation2001). Among these consequences, mitotic catastrophe accounts for a large proportion of transiently surviving cells during radiotherapy, and is an important cause of secondary death, as reported by Kobayashi et al. (Kobayashi et al. Citation2017). In their study, 5% of osteosarcoma cells were apoptotic and 25% underwent mitotic catastrophe after being irradiated with a dose of 6 Gy. In our experiment, after an accumulative radiation dose of 18 Gy, 99% of esophageal cancer cells adhering to the flask became giant, deformed, multinucleated and underwent mitotic catastrophe. However, the mechanisms of radiation-induced mitotic catastrophe have not been fully elucidated.
Mitosis is strictly controlled by three cell cycle checkpoints: the G1/S checkpoint, the G2/M checkpoint, and the spindle assembly checkpoint (SAC). Cells that fail to pass these checkpoints terminate the cell cycle. DNA damage and mitotic perturbations are considered as two major inducers of mitotic catastrophe. The former refers to the idea that proliferating cells with DNA damage caused by radiation do not exit the cycle and enter the DNA repair program, but escape the G1/S or G2/M checkpoints and enter into the mitotic period. Such cells in the mitotic phase undergo defective nuclear division due to the lack of essential elements such as microtubules, mitogens, motor proteins, and centromeres.
During the cell cycle, the G1/S checkpoint is activated in response to replication errors or DNA damage that occurs during the S phase. Ataxia-telangiectasia mutated (ATM) is activated when DNA damage is detected. Activated ATM then activates the checkpoint kinase, Chk2, which phosphorylates and inhibits the phosphatase, Cdc25-A, and prevents cyclin E/cdk2 activation. This results in the halting of the cell cycle and the cells are channeled into DNA repair processes or the apoptotic program. In our study, CDKN1A (p21) was significantly up-regulated and Weel was significantly down-regulated after radiation treatment. CDKN1A blocks DNA-damaged cells at the G1/S checkpoint. Wee1 regulates the activity of Cdk2 by inhibitory phosphorylation of tyrosine 15 of Cdk. Significantly reduced expression of Wee1 is one of the important mechanisms whereby DNA-damaged cells bypass the G1/S and G2/M checkpoints.
The SAC controls the progression of the M phase in the cell cycle. Reliable mitosis requires a variety of cellular components, including microtubules, kinetochore proteins, centromere proteins, and other protein complexes. When these components are lacking or the chromosome is not properly connected to the centromere, the SAC is activated and mitosis is blocked (Musacchio and Salmon Citation2007; Herzog et al. Citation2009; Carlos and Kops Citation2015). In our study, we detected a large number of spindle assembly-related genes that were down-regulated after radiation treatment, including NUF2, which encodes a microtubule-pointing connexin (Deluca et al. Citation2002); CENPF (Ma et al. Citation2006), which encodes a centromere protein; ASPM, which encodes an abnormal spindle-like microcephaly-associated protein (Kouprina et al. Citation2005); KIF15, KIF11, and KIF20B, which encode kinesins (Florian and Mayer Citation2011; Wojcik et al. Citation2013); and CEP57, which encodes a centriole protein. The significant down-regulation of these essential genes is likely to be one of the major causes of mitotic disaster in this study.
Ubiquitin-mediated protease hydrolysis in anaphase and telophase is essential for an ordered cell cycle, and when mitosis is completed, CDKs are inactivated by ubiquitin-mediated protease hydrolysis, which drives the cell cycle into the next phase (Teixeira and Reed Citation2013). When this system malfunctions, it leads to mitotic confusion. In our study, a large number of genes were down-regulated, including Smc3, Stage1, Stage2, Rad21, APC/C, Cdc14, UBE2N, E6AP, WWP1, EDD1, HERC4, TRAF6, PIRH2, BRCA1, Cul2, and Cul4.
Ribosomes are made up of approximately 80 ribosomal proteins (RPs). The relative abundance of RPs is known to be different in different tissues and in different environments (Volarevic and Thomas Citation2001). Ribosomes also show heterogeneity under different physiological and pathological conditions. Proteomics studies have shown that there are sub-stoichiometric relationships between translation polysomes (Shi et al. Citation2017), indicating that specific mRNAs may be translated preferentially by different ribosomes. Whole ribosomes may be a more flexible platform that can further regulate gene expression (Shi and Barna Citation2015). It was considered that ribosomes are the whole structure that ensures the passive translation of mRNA. However, ribosomes have recently been shown to not only affect the selection of mRNA, but also other basic processes, including cell growth, homeostasis, and metabolism (Dontsova et al. Citation2000).
Mitotic catastrophe is undoubtedly an important intermediate state of tumor cells during radiotherapy. These defective multinucleated cells may have implications for tumor recurrence after radiotherapy. Among the complex mechanisms of mitotic catastrophe induced by radiation, blocked ribosomal biosynthesis and the subsequent down-regulation of genes involved in mitotic nuclear division and ubiquitin-mediated proteolysis pathways may play important roles.
Based on the observation that new cells emerged from the giant multinucleated cells, it remains possible that some cells undergoing mitotic catastrophe caused by radiation reboot division after radiation ceases. We hypothesize that in some cells, cell division stops between nuclear division and cytoplasm and membrane division due to a lack of the components required for these processes. If this is true, it may explain the mechanism of tumor recurrence after radiotherapy or chemotherapy. However, further experimentation is required to confirm this.
Data Availability Statement
Due to the nature of the research, participants of this study agree for our data to be shared publicly, supporting data can be available from GEO (http://www.ncbi.nlm.nih.gov/geo/query/acc.cgi?acc=GSE138162).
Disclosure statement
No potential conflict of interest was reported by the author(s).
Additional information
Funding
References
- al-Sarraf M, Martz K, Herskovic A, Leichman L, Brindle JS, Vaitkevicius VK, Cooper J, Byhardt R, Davis L, Emami B. 1997. Progress report of combined chemoradiotherapy versus radiotherapy alone in patients with esophageal cancer: an intergroup study. J Clin Oncol. 15(1):277–284. doi: https://doi.org/10.1200/JCO.1997.15.1.277
- Boroughs LK, DeBerardinis RJ. 2015. Metabolic pathways promoting cancer cell survival and growth. Nat Cell Biol. 17(4):351–359. doi: https://doi.org/10.1038/ncb3124
- Carlos S, Kops GJPL. 2015. Joined at the hip: kinetochores, microtubules, and spindle assembly checkpoint signaling. Trends Cell Biol. 25(1):21–28. doi: https://doi.org/10.1016/j.tcb.2014.08.006
- Chang L, Graham P, Hao J, Ni J, Deng J, Bucci J, Malouf D, Gillatt D, Li Y. 2016. Cancer stem cells and signaling pathways in radioresistance. Oncotarget. 7(10):11002–11017. doi: https://doi.org/10.18632/oncotarget.6760
- Cojoc M, Mabert K, Muders MH, Dubrovska A. 2015. A role for cancer stem cells in therapy resistance: cellular and molecular mechanisms. Semin Cancer Biol. 31:16–27. doi: https://doi.org/10.1016/j.semcancer.2014.06.004
- Deluca JG, Ben M, Hickey JM, Kilmartin JV, Salmon ED. 2002. Hnuf2 inhibition blocks stable kinetochore-microtubule attachment and induces mitotic cell death in HeLa cells. J Cell Biol. 159(4):549–555. doi: https://doi.org/10.1083/jcb.200208159
- Dontsova M, Frolova L, Vassilieva J, Piendl W, Kisselev L, Garber M. 2000. Translation termination factor aRF1 from the archaeon Methanococcus jannaschii is active with eukaryotic ribosomes. FEBS Lett. 472(2):213–216. doi: https://doi.org/10.1016/S0014-5793(00)01466-6
- Florian S, Mayer TU. 2011. Modulated microtubule dynamics enable Hklp2/Kif15 to assemble bipolar spindles. Cell Cycle. 10(20):3533–3544. doi: https://doi.org/10.4161/cc.10.20.17817
- Galluzzi L, Vitale I, Abrams JM, Alnemri ES, Baehrecke EH, Blagosklonny MV, Dawson TM, Dawson VL, El-Deiry WS, Fulda S, et al. 2012. Molecular definitions of cell death subroutines: recommendations of the Nomenclature Committee on Cell Death 2012. Cell Death Differ. 19(1):107–120. doi: https://doi.org/10.1038/cdd.2011.96
- Herzog F, Primorac I, Dube P, Lenart P, Sander B, Mechtler K, Stark H, Peters JM. 2009. Structure of the anaphase-promoting complex/cyclosome interacting with a mitotic checkpoint complex. Science. 323(5920):1477–1481. doi: https://doi.org/10.1126/science.1163300
- Kobayashi D, Shibata A, Oike T, Nakano T. 2017. One-step protocol for evaluation of the mode of radiation-induced clonogenic cell death by fluorescence microscopy. J Vis Exp. 128:56338.
- Kouprina N, Pavlicek A, Collins NK, Nakano M, Noskov VN, Ohzeki J, Mochida GH, Risinger JI, Goldsmith P, Gunsior M. 2005. The microcephaly ASPM gene is expressed in proliferating tissues and encodes for a mitotic spindle protein. Hum Mol Genet. 14(15):2155–2165. doi: https://doi.org/10.1093/hmg/ddi220
- Krause M, Dubrovska A, Linge A, Baumann M. 2017. Cancer stem cells: radioresistance, prediction of radiotherapy outcome and specific targets for combined treatments. Adv Drug Deliv Rev. 109:63–73. doi: https://doi.org/10.1016/j.addr.2016.02.002
- Kurth I, Hein L, Mabert K, Peitzsch C, Koi L, Cojoc M, Kunz-Schughart L, Baumann M, Dubrovska A. 2015. Cancer stem cell related markers of radioresistance in head and neck squamous cell carcinoma. Oncotarget. 6(33):34494–34509. doi: https://doi.org/10.18632/oncotarget.5417
- Lamouille S, Xu J, Derynck R. 2014. Molecular mechanisms of epithelial-mesenchymal transition. Nat Rev Mol Cell Biol. 15(3):178–196. doi: https://doi.org/10.1038/nrm3758
- Lee SY, Jeong EK, Ju MK, Jeon HM, Kim MY, Kim CH, Park HG, Han SI, Kang HS. 2017. Induction of metastasis, cancer stem cell phenotype, and oncogenic metabolism in cancer cells by ionizing radiation. Mol Cancer. 16(1):10. doi: https://doi.org/10.1186/s12943-016-0577-4
- Lewanski CR, Gullick WJ. 2001. Radiotherapy and cellular signalling. Lancet Oncol. 2(6):366–370. doi: https://doi.org/10.1016/S1470-2045(00)00391-0
- Lyakhovich A, Lleonart ME. 2016. Bypassing mechanisms of mitochondria-mediated cancer stem cells resistance to chemo- and radiotherapy. Oxid Med Cell Longev. 2016:1716341. doi: https://doi.org/10.1155/2016/1716341
- Ma L, Zhao X, Zhu X. 2006. Mitosin/CENP-F in mitosis, transcriptional control, and differentiation. J Biomed Sci. 13(2):205–213. doi: https://doi.org/10.1007/s11373-005-9057-3
- Mims J, Bansal N, Bharadwaj MS, Chen X, Molina AJ, Tsang AW, Furdui CM. 2015. Energy metabolism in a matched model of radiation resistance for head and neck squamous cell cancer. Radiat Res. 183(3):291–304. doi: https://doi.org/10.1667/RR13828.1
- Minsky BD, Pajak TF, Ginsberg RJ, Pisansky TM, Martenson J, Komaki R, Okawara G, Rosenthal SA, Kelsen DP. 2002. INT 0123 (Radiation Therapy Oncology Group 94-05) phase III trial of combined-modality therapy for esophageal cancer: high-dose versus standard-dose radiation therapy. J Clin Oncol. 20(5):1167–1174. doi: https://doi.org/10.1200/JCO.2002.20.5.1167
- Musacchio A, Salmon ED. 2007. The spindle-assembly checkpoint in space and time. Nat Rev Mol Cell Biol. 8(5):379–393. doi: https://doi.org/10.1038/nrm2163
- Shi Z, Barna M. 2015. Translating the genome in time and space: specialized ribosomes, RNA regulons, and RNA-binding proteins. Annu Rev Cell Dev Biol. 31:31–54. doi: https://doi.org/10.1146/annurev-cellbio-100814-125346
- Shi Z, Fujii K, Kovary KM, Genuth NR, Rost HL, Teruel MN, Barna M. 2017. Heterogeneous ribosomes preferentially translate distinct subpools of mRNAs genome-wide. Mol Cell. 67(1):71–83. e7. doi: https://doi.org/10.1016/j.molcel.2017.05.021
- Stahl M, Lehmann N, Walz MK, Stuschke M, Wilke H. 2012. Prediction of prognosis after trimodal therapy in patients with locally advanced squamous cell carcinoma of the oesophagus. Eur J Cancer. 48(16):2977–2982. doi: https://doi.org/10.1016/j.ejca.2012.03.010
- Teixeira LK, Reed SI. 2013. Ubiquitin ligases and cell cycle control. Annu Rev Biochem. 82:387–414. doi: https://doi.org/10.1146/annurev-biochem-060410-105307
- van Hagen P, Hulshof MC, van Lanschot JJ, Steyerberg EW, van Berge Henegouwen MI, Wijnhoven BP, Richel DJ, Nieuwenhuijzen GA, Hospers GA, Bonenkamp JJ, et al. 2012. Preoperative chemoradiotherapy for esophageal or junctional cancer. N Engl J Med. 366(22):2074–2084. doi: https://doi.org/10.1056/NEJMoa1112088
- Vitale I, Galluzzi L, Castedo M, Kroemer G. 2011. Mitotic catastrophe: a mechanism for avoiding genomic instability. Nat Rev Mol Cell Biol. 12(6):385–392. doi: https://doi.org/10.1038/nrm3115
- Volarevic S, Thomas G. 2001. Role of S6 phosphorylation and S6 kinase in cell growth. Prog Nucleic Acid Res Mol Biol. 65:101–127. doi: https://doi.org/10.1016/S0079-6603(00)65003-1
- Wang JS, Wang HJ, Qian HL. 2018. Biological effects of radiation on cancer cells. Mil Med Res. 5(1):20.
- Wild-Bode C, Weller M, Rimner A, Dichgans J, Wick W. 2001. Sublethal irradiation promotes migration and invasiveness of glioma cells: implications for radiotherapy of human glioblastoma. Cancer Res. 61(6):2744–2750.
- Wojcik EJ, Buckley RS, Richard J, Liu L, Huckaba TM, Kim S. 2013. Kinesin-5: cross-bridging mechanism to targeted clinical therapy. Gene. 531(2):133–149. doi: https://doi.org/10.1016/j.gene.2013.08.004
- Zavadil J, Bottinger EP. 2005. TGF-beta and epithelial-to-mesenchymal transitions. Oncogene. 24(37):5764–5774. doi: https://doi.org/10.1038/sj.onc.1208927