
Abstract
Down syndrome (DS) is the most common genetic cause of intellectual disability, resulting from lack of disjunction of sister chromatids of human chromosome 21 or not partial disjunction of chromosome 21 (Hsa21), usually during maternal meiosis. The expression of genes in chromosome 21 is very complex and many other genes in other chromosomes can play a role in DS. The protein encoded by the Cerebellar degeneration-related autoantigen 1 (CDR1) gene has been identified in patients with paraneoplastic cerebellar degeneration. Transcriptome studies show CDR1 expression in tumor cell lines and leukocytes of normal subjects and patients with Alzheimer's disease. We investigated CDR1 expression in cultured fibroblasts of DS patients compared with normal subjects. The study of CDR1 mRNA was performed with qRT-PCR. Immunofluorescence and Western blot were used for the analysis of the CDR1 protein. Our data show that both CDR1 mRNA and protein are expressed in human fibroblasts and that the CDR1 gene is down-regulated in DS fibroblasts compared to controls. These data suggest a role for CDR1 in DS phenotype.
Background
Down syndrome (DS) is the most common genetic cause of intellectual disability (ID), the cause of DS is the presence of 3 copies of full of partial chromosome 21 (Hsa21) generally due to lack of disjunction during maternal meiosis in about the 95% of cases (Lejeune et al. Citation1959; Newberger Citation2000; Capone Citation2001). DS represents the most common aneuploidy in humans, with an overall incidence of 1/650–1000 live births (Hulten et al. Citation2008; Cartier and Murphy-Kaulbeck Citation2012). It shows a stunningly wide array of health issues, such as ID, autoimmune disorders, hypotonia, muscle weakness, Alzheimer’s disease and congenital heart disease, whose physio-pathologic mechanisms are poorly explored (Antonarakis et al. Citation2004). In addition, using imaging studies, there is evidence for smaller total brain volume in DS (Gunbey et al. Citation2017).
The expression of genes in human chromosome 21 is dynamic and complex (Birchler et al. Citation2001). Several authors suggested that some of the genes mapping in the 21 chromosome (e.g. BCLAF1, HSP90B1 and DBH) (Zhao et al. Citation2016) may play an important role on ID and DS phenotypes (Zhao et al. Citation2016; Salemi et al. Citation2018). A down-expression of the various mitochondrial sub-units in subjects with DS has been already reported (Salemi et al. Citation2018). Notably, microRNAs as miR-99a, miR-125b and let-7c transcribed by genes on the human chromosome 21 have a regulatory role on the expression of genes mapping in other chromosomes (Modi et al. Citation2017). In addition, various other studies have dealt with gene expression in subjects with DS (Weick et al. Citation2013; Letourneau et al. Citation2014; Olmos-Serrano et al. Citation2016; Sullivan et al. Citation2016; Pelleri et al. Citation2018).
Cerebellar degeneration-related autoantigen 1 (CDR1) gene maps in the Xq26-q27.2 chromosome (OMIM ID 302650; Alternative titles; symbols: CDR34) and represents a candidate gene for the etiology of a number of neurological disorders. CDR1 encodes for a protein of 223 amino acids: the autoantibodies are directed against that protein. In particular electrophoretic transfer (Western) blot analysis of purified Purkinje neurons has shown that the autoantibodies recognize at least two proteins: a major antigen of 62 kDa and minor 38 KDa (Cunningham et al. Citation1986). Their presence has been identified in patients with paraneoplastic cerebellar degeneration (Dropcho et al. Citation1987). Particularly, CDR1 staining has been observed by immunohistochemical techniques in the Purkinje cells of the cerebellum, while the protein was not detected in basal ganglia, cerebral cortex, spinal cord and midbrain (Furneaux et al. Citation1989). CDR1 over-expression has been demonstrated in prostate cancer cell lines (Salemi et al. Citation2014). Interestingly, CDR1 has been found over-expressed in patients with Alzheimer's disease compared to controls, thus pointing to this gene a possible role in Alzheimer’s disease process (Bosco et al. Citation2014). It is not known whether the CDR1 gene expression is altered in DS patients. This knowledge may bring new insights into the physio-pathology of ID in DS. Therefore, the aim of the present study was to assess if the CDR1 gene is differently expressed in cultured fibroblasts from periodontal gingival tissue of DS and normal controls (NC).
Materials and methods
Collection of tissue samples
A total of 21 DS subjects and 21 controls were recruited after obtaining family and/or personal consent at the I.R.C.C.S. Oasi Maria SS, Troina, Italy, a specialized research hospital for ID and brain aging. This study was approved by the Ethical Committee of the ‘IRCCS Associazione Oasi Maria SS.’, Troina (EN), Italy (2017/05/31/CE-IRCCS-OASI/9 of 3 June 2017). All the study participants signed an informed consent to publish. Human fibroblasts were obtained by oral biopsy of periodontal gingival tissue from 21 NC (age range 20–40 years) and 21 DS subjects (age range 20–38 years). Human gingival fibroblasts were isolated from explants of human gingiva and cultured in Dulbecco’s modified Eagle’s medium in 5% CO2 humidified atmosphere supplemented with 20% fetal bovine serum, 2 mM glutamine, and 100 units/ml of streptomycin and penicillin. Before the immunofluorescence experiments, samples were fixed with 4% formalin for 30 min at 4 °C and post-fixed with 70% ethanol for 24 h at 20°C.
Total RNA extraction and cDNA synthesis
RNA extraction and purification were performed as previously described using RNeasy mini Kit (Qiagen Sciences, Germantown, USA) (Salemi et al. Citation2018). RNA was quantified using Nanodrop ND-1000 spectrophotometer (NanoDrop Technologies). The RNA samples were stored at −80°C till further use. Genomic DNA elimination reaction was performed using QuantiTect Reverse Transcription Kit (Qiagen, Germany), with thermocycler program: 2’ min at 42°C. Reverse-transcription (cDNA synthesis) was carried out using 100 ng of RNA and QuantiTect Reverse Transcription Kit (Qiagen Sciences, Germantown, USA), thermocycler program: 15’ at 42°C and 3’ at 95°C.
Real-time quantitative PCR (qPCR)
We compared qRT-PCR in 21 DS patients and 21 normal subjects. QRT-PCR experiments were performed using the Light Cycler 480 (Roche Diagnostics; Mannheim, Germany) in a total volume of 25 μl. The CDR1 target gene assay (assay ID Hs00601346_s1) and the glyceraldehyde-3-phosphate dehydrogenase (GAPDH) reference gene assay (assay ID Hs99999905_m1) were obtained from Applied Biosystems (Carlsbad, CA, USA). The thermal cycling conditions consisted of one cycle for 2 min at 50°C (UDG incubation), one cycle of 15 min at 95°C (enzyme activation) and 42 cycles for: 15 s at 94°C followed by 1 min at 60°C (PCR). The amplified transcripts were quantified using the threshold cycle (Ct) method and relative quantification analysis data were played using comparative ΔΔCt method: each mRNA from DS subjects was coupled with mRNA from normal subjects with the same sex and age, more or less three years. Light Cycler 1.5 software supplied with Light Cycler 480 was used for relative quantification analysis (Livak and Schmittgen Citation2001; Kaur et al. Citation2018).
Immunofluorescence experiments
Fibroblasts slides of DS (n = 21) as well as age- and sex-matched (n = 21) control subjects were evaluated. For immunofluorescence studies, 0.2 ml of suspension containing 20 × 106 fibroblasts/ml in culture medium was incubated for 1 h at room temperature with the primary anti-CDR1 antibody (1:200), a rabbit polyclonal antibody raised against CDR1 protein (Sigma Life science, St. Louis, USA). Following several washes with TBS containing 0.05% Tween-20, the suspension was incubated with FITC-labelled goat anti-rabbit IgG (1:30) (Sigma-Aldrich Corp., St Louis, MO, USA) for 1 h at room temperature. Before microscopic examination, nuclei were counter-stained with 100 ng/ml 4′,6-diamidino-2-phenylindole (DAPI) (Cytocell, Banbury, UK). Slides were observed and cells were visually scored at 20× and 40× magnification. Immunostaining was examined using a fluorescent microscope BX-51 (Olympus, Jappan). Cells were classified within the following scoring: high level positivity ++, slight positivity +–, negative –. Levels ++ and +– were considered positive for statistics.
Western blot analysis
Fibroblast proteins were quantified using the BCA protein determination method (Bio-Rad, Hercules, CA, USA) (Kaur et al. Citation2018), solubilized in Laemmli buffer, at a concentration of about 1–2 × 10² fibroblasts/ml also containing 5% β-mercaptoethanol at 100°C, electrophoresed on 15% polyacrylamide-SDS gel and electro-blotted onto nitrocellulose membrane (Bio-Rad, Philadelphia, PA, USA) for 2 h at 0.24 mA/cm2. Protein bands were detected on the membrane using anti-CDR1 primary antibody (Invitrogen CDR1 Polyclonal Antibody, ThermoFischer, Outside USA) and in parallel with anti- β-Actin (Sigma Life Actin primary antibody, St. Louis, USA). A goat anti-rabbit antibody-HRP conjugate (Goat-Anti- Rabbit secondary Antibody, #31460, Thermo Fisher Scientific Inc., Rockford, IL, USA) was used as the secondary antibody. Quantitative analysis of photographed bands was carried out with ImageJ software. Density value of CDR1 protein bands was quantified in terms of pixels and it was normalized to beta-actin value protein bands.
Statistical analysis
Distribution analysis of CDR1 mRNA levels was performed using Shapiro–Wilk test, inferential statistical analysis was carried out using Wilcoxon rank-sum test and bivariate linear regression analysis. Graph Pad Prism 5 software was used for statistical analysis. A p-value lower than 0.05 was considered statistically significant.
Results
Expression of CDR1 mRNA by qRT-PCR
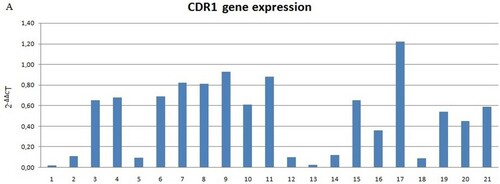
Decreased levels of CDR1 mRNA were found in 20 of 21 DS samples (Figure ). The expression levels were not normal (p < 0.05). Therefore, the Wilcoxon rank-sum test was used for inferential statistical analysis, as appropriated. A significant difference between DS and controls was found (p < 0.001). In addition, we evaluated the mRNA levels of 2 subject groups by assessing the relative expression value in terms of –ΔCt; in this analysis, the mean mRNA levels of patients and controls and was 1.24 (SD = 3.08; CV = 2.48; IC 95% = –0.16–2.65) and 3.1 (SD = 2.41; CV = 0.77; IC 95% = 2.01–4.2), respectively. Inferential statistical analysis revealed significant difference between the two groups (p < 0.05). No significant difference was found when the groups were analyzed according to the gender (p > 0.05) and age (p > 0.05).
Figure 1. (A) CDR1 mRNA expression in DS subjects and normal controls compared to normal controls (not included in the figure with value 1). Data shown were obtained by qRT-PCR, Figure (A) shows elaborated mRNA levels by comparative ΔΔCt method; (B) Average –ΔCt mRNA levels value of DS (down syndrome) subjects and NC (normal controls) groups. Significant difference between the two groups (p < 0.001)*.
Immunofluorescence of CDR1 protein
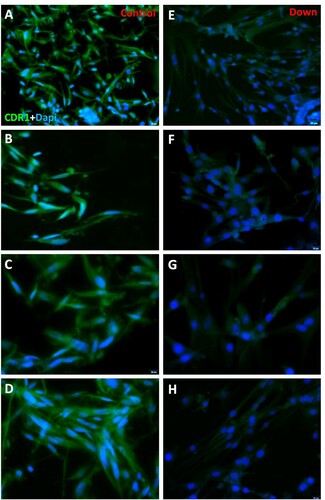
CDR1 protein was localized in fibroblasts’ cytoplasm, both in normal and DS subjects, and no nuclear signal was seen (Figure (A,C)). Control samples showed a positive cell rate of 94.17 on 100 cells analyzed (SD = 2.12; CV = 0.02; IC 95% = 93.03–95.29) and DS samples of 9.11 on 100 cells analyzed (SD = 2.17; CV = 0.24; IC 95% = 7.96–10.27) (p < 0.0001). No significant statistical effect was found for gender (p > 0.05) and no linear correlation was detected with age (p > 0.05).
Figure 2. (A–B–C–D) Immunofluorescence of fibroblasts obtained from oral biopsy of periodontal gingival tissue in normal subject, CDR1 protein green fluorescence, nuclei were counter-stained in blue with 100 ng/mL 4,6-diamidino-2-phenylindole (DAPI). (E–F–G–H) Immunofluorescence of fibroblasts obtained from oral biopsy of periodontal gingival tissue in DS subject, CDR1 protein green fluorescence, nuclei were counter-stained in blue with 100 ng/mL 4,6-diamidino-2-phenylindole (DAPI).
Western blot analysis for CDR1 protein
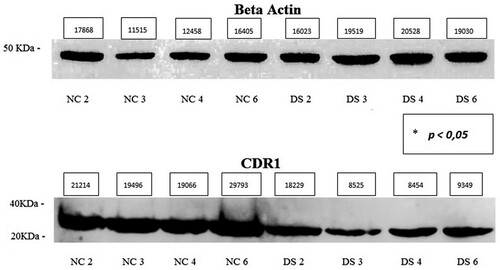
Western blot analysis showed the presence of CDR1 protein in fibroblasts of both DS subjects and controls, but trisomic cells had a reduced band intensity compared to control ones. The protein has a molecular mass of approximately 30–35 kDa (Figure ). The average expression level of the DS samples was 0.61 (SD = 0.34; CV = 0.56; IC 95% = 0.07–1.16) and that of NC was 1.55 (SD = 0.27; CV = 0.17; IC 95% = 1.13–1.98) (p < 0.05). No significant differences in expression were found for sex (p > 0.05) and no linear correlation was found with age (p > 0.05).
Figure 3. Western blot of 4 normal fibroblast cell line (Control) and 4 DS cell line (Down), CDR1 protein approximately 30–35 kDa, β-Actin protein approximately 45 kDa. Densitometric value (pixels) of bands and p value * calculated by inferential statistical analysis are present in the figure.
Discussion
The role of CDR1 is still unclear, it consists of 34 inexact repetitive hexapeptides (Furneaux et al. Citation1989; Chen et al. Citation1990), accounting for more than 50% of the human CDR1 sequence (www.uniprot.org, #P51861). Some authors speculated about a possible effect on cell proliferation, and a differential CDR1 expression has been observed in several tumor cell lines and, particularly, in prostate, ovary and breast tissues (Cunningham et al. Citation1986; Totland et al. Citation2018).
The majority of data on CDR1 come from central nervous system cells. Accordingly, CDR1 has been detected in the cytosol and dendrites of Purkinje cells and in the dentate nucleus of large neurons by immunofluorescence studies carried out in homo sapiens, rats and mice (Chen et al. Citation1990). Co-staining with anti-parvalbumin, a marker for stellate and basket cells, showed that CDR1 was also present in these cells (Celio Citation1990; Chen et al. Citation1990). Moreover, CDR1 over-expression was reported in patients with Alzheimer disease (Bosco et al. Citation2014) and a role in the Amyloid aggregation has been demonstrated (Ruiz-Zamora et al. Citation2019). Different fibrillogenic hotspots have recently been identified at the CDR1 and β-strand C of the protein, thus likely suggesting a functional role in the central nervous system.
CDR1 consists of repetitive hexamer amino acid sequences with a core of glutamate and aspartate. Glutamate and aspartate constitutes the 22.5% of the total amino acid composition of human CDR1. Totland et al. (Citation2018) found that CDR1 was localized in the soma and dendrites of Purkinje cells, although it had been found into protrusions of the plasma membrane of cancer cells. This indicates that CDR1 may be associated with cell differentiation and migration. In the form fibroblast cultured considered in this study, we have found a cytoplasmic signal while no expression was detected in cytoplasmic and nuclear membranes. This may suggest that in fibroblasts the CDR1 protein plays a functional role within the cell.
Pharos profile (https://pharos.nih.gov/idg/targets/P51861) includes the brain among the tissues were the CDR1 gene is expressed, as also GEO profile does. Particularly, CDR1 has been reported as under-expressed in type 2 diabetes, central nervous system primitive neuroectodermal tumors and DS https://www.ncbi.nlm.nih.gov/geo/tools/profileGraph.cgi?ID=GDS3681:40978_s_at, https://www.ncbi.nlm.nih.gov/geo/tools/profileGraph.cgi?ID=GDS4838:207276_at, https://www.ncbi.nlm.nih.gov/geo/tools/profileGraph.cgi?ID=GDS2941:207276_at.
Data of the present study indicate that the CDR1 gene is expressed in human fibroblasts and that it is under-expressed in DS fibroblasts compared to controls. The various techniques used confirm this data, this indicates that both the mRNA and the protein are expressed in a comparable way. The evidence of immunofluorescence makes us hypothesize that, at least in fibroblasts, CDR1 can’t play a functional or regulatory role at the nuclear level, even if the role at cytoplasmic level is not clear.
The down-regulation may be mimicked in the brain, thus possibly leading to the phenotypic features of DS subjects. Accordingly, CDR1 gene is a highly conserved neuroectodermal marker mapping to X chromosome both in Homo sapiens and in mouse (Ruiz-Zamora et al. Citation2019).
The CDR1 gene consists of a single exon, the same conserved throughout evolution. It is well known that the Xq27 band is characterized by large segmental duplications (SDs) (Shaw and Lupski Citation2004). We have not evaluated the SDs in our cell cultures but we can’t exclude that the different orientation of SDs and their recombination may result in deletions, duplications and inversions of the genomic region, including CDR1 gene. Also, this phenomenon could modify the expression of genes located in the above genomic area.
Gene expression studies from DS subjects have been conducted in fibroblasts (Shaw and Lupski Citation2004), whole blood (Smyth Citation2004; Li et al. Citation2006) and amniocytes (Tang et al. Citation2004). In a study of transcriptome and proteome Sobol et al. (Citation2019) have identified the role of transcription factors OLIG1, OLIG2 and RUNX1,in deficient myelination and neuronal differentiation in DS and they also identified other pathways and elements in neurogenesis of subjects whit DS, providing further insights into developmental abnormalities of the DS brain. These studies have established an important gene dosage effect for the 21 chromosome but it remains unclear whether there are secondary transcriptional effects throughout the genome (Altug-Teber et al. Citation2007). In addition, Jourdy et al. (Citation2016) reported a deletion of about 1.26-Mb mapping within the Xq26.3 to Xq28 bands, encompassing seven OMIM genes (LOC389895, SOX3, LINC00632, CDR1, SPANXF1, LDOC1, SPANXC) in 5 patients with ID. Therefore, deletions of CDR1 gene might be associated with ID. A study by Semi-quantitative fluorescent multiplex PCR in DNA of down syndrome subjects was made on Xq27 region (Salemi et al. Citation2009), it has demonstrated the instability of that chromosomal region.
In conclusion, CDR1 gene down expression or abnormalities of the chromosomal region where the CDR1 gene maps might play a role in DS phenotype and ID. Despite it is not currently possible to address to the CDR1 gene down-regulation a role in the pathogenesis of ID in DS patients, our data contribute to expand the current knowledge. This could be useful to better understand in the future the role that the CDR1 has in embryonic development at the level of the central nervous system and other apparatus. Also, it could be interesting in to study the expression of CDR1 in brains post mortem of ID and/or DS subjects.
Acknowledgements
Concept and Design done by Dr MS, Prof GR, Prof AEC, and Dr CR; Acquisition of data or analysis by Dr MS, Prof GR, Prof AEC, Dr CR, Dr MS, Dr FR, Dr R Can, Dr R Cas, Dr SC, Dr CT; Final approval by Dr CR, Dr MS, Prof AEC and Prof GR. All authors read and approved the final manuscript, and they have the accountability for all aspects of work. Consent for publication: All authors have consented the manuscript been published. Ethics approval and consent to participate: This study was approved by the Ethical Committee of the ‘IRCCS Associazione Oasi Maria SS.’, Troina (EN), Italy (2017/05/31/CE-IRCCS-OASI/9 of 3 June 2017). All the study participants signed an informed consent to publish.
Disclosure statement
No potential conflict of interest was reported by the authors.
Data availability statement
The datasets used and/or analyzed during the current study are available from the corresponding author on reasonable request.
Additional information
Funding
References
- Altug-Teber O, Bonin M, Walter M, Mau-Holzmann UA, Dufke A, Stappert H. 2007. Specific transcriptional changes in human fetuses with autosomal trisomies. Cytogenet Genome Res. 119:171–184. doi: https://doi.org/10.1159/000112058
- Antonarakis SE, Lyle R, Dermitzakis ET, Reymond A, Deutsch S. 2004. Chromosome 21 and down syndrome: from genomics to pathophysiology. Nat Rev Genet. 5:725–738. doi: https://doi.org/10.1038/nrg1448
- Birchler JA, Bhadra U, Bhadra MP, Auger DL. 2001. Dosage-dependent gene regulation in multicellular eukaryotes: implications for dosage compensation, aneuploid syndromes, and quantitative traits. Dev Biol. 234:275–288. doi: https://doi.org/10.1006/dbio.2001.0262
- Bosco P, Spada R, Caniglia S, Salluzzo MG, Salemi M. 2014. Cerebellardegeneration-related autoantigen 1 (CDR1) gene expression in Alzheimer's disease. Neurol Sci. 35:1613–1614. doi: https://doi.org/10.1007/s10072-014-1805-6
- Capone GT. 2001. Down syndrome: advances in molecular biology and the neurosciences. J Dev Behav Pediatr. 22:40–59. doi: https://doi.org/10.1097/00004703-200102000-00007
- Cartier L, Murphy-Kaulbeck L. 2012. Counselling considerations for prenatal genetic screening. J Obstet Gynaecol. 34(5):489–493.
- Celio MR. 1990. Calbindin D-28k and parvalbumin in the rat nervous system. Neuroscience. 35:375–475. doi: https://doi.org/10.1016/0306-4522(90)90091-H
- Chen YT, Rettig WJ, Yenamandra AK, Kozak CA, Chaganti RS, Posner JB, et al. 1990. Cerebellar degeneration-related antigen: a highly conserved neuroectodermal marker mapped to chromosomes X in human and mouse. Proc Natl Acad Sci USA. 87:3077–3081. doi: https://doi.org/10.1073/pnas.87.8.3077
- Cunningham J, Graus F, Anderson N, Posner JB. 1986. Partial characterization of the Purkinje cell antigens in paraneoplastic cerebellar degeneration. Neurology. 36:1163–1168. doi: https://doi.org/10.1212/WNL.36.9.1163
- Dropcho EJ, Chen YT, Posner JB, Old LJ. 1987. Cloning of a brain protein identified by autoantibodies from a patient with paraneoplastic cerebellar degeneration. Proc Nat 84:4552–4556. doi: https://doi.org/10.1073/pnas.84.13.4552
- Furneaux HM, Dropcho EJ, Barbut D, Chen YT, Rosenblum MK, Old LJ, Posner JB. 1989. Characterization of a cDNA encoding a 34-kDa Purkinje neuron protein recognized by sera from patients with paraneoplastic cerebellar degeneration. Proc Natl Acad Sci USA. 86:2873–2877. doi: https://doi.org/10.1073/pnas.86.8.2873
- Gunbey HP, Bilgici MC, Aslan K, Has AC, Ogur MG, Alhan A, Incesu L. 2017. Structural brain alterations of down's syndrome in early childhood evaluation by DTI and volumetric analyses. Eur Radiol. 27(7):3013–3021. doi: https://doi.org/10.1007/s00330-016-4626-6
- Hulten MA, Patel SD, Tankimanova M, Westgren M, Papadogiannakis N, Jonsson AM, et al. 2008. On the origin of trisomy 21 down syndrome. Mol Cytogenet. 1:21. doi: https://doi.org/10.1186/1755-8166-1-21
- Jourdy Y, Chatron N, Carage ML, Fretigny M, Meunier S, Zawadzki C, et al. 2016. Study of six patients with complete F9 deletion characterized by cytogenetic microarray: role of the SOX3 gene in intellectual disability. J Thromb Haemost. 14:1988–1993. doi: https://doi.org/10.1111/jth.13430
- Kaur R, Sodhi M, Sharma A, Sharma VL, Verma P, Swami SK, et al. 2018. Selection of suitable reference genes for normalization of quantitative RT-PCR(RT-qPCR) expression data across twelve tissues of riverine buffaloes (Bubalus bubalis). PLoS One. 13(3):e0191558. doi: https://doi.org/10.1371/journal.pone.0191558
- Lejeune J, Gauthier M, Turpin R. 1959. Les chromosomes humains en culture de tissus [Human chromosomes in tissue cultures]. C R Hebd Seances Acad Sci. 248(4):602–603. French. PMID: 13629913.
- Letourneau A, Santoni FA, Bonilla X, Sailani MR, Gonzalez D, Kind J, et al. 2014. Domains of genome-wide gene expression dysregulation in down’s syndrome. Nature. 508:345–350. doi: https://doi.org/10.1038/nature13200
- Li CM, Guo M, Salas M, Schupf N, Silverman W, Zigman WB. 2006. Cell type-specific over-expression of chromosome 21 genes in fibroblasts and fetal hearts with trisomy 21. BMC Med Genet. 7:24. doi: https://doi.org/10.1186/1471-2350-7-24
- Livak KJ, Schmittgen TD. 2001. Analysis of relative gene expression data using real-time quantitative PCR and the 22ddct method. Methods. 25:402–408. doi: https://doi.org/10.1006/meth.2001.1262
- Modi BP, Washington S, Walsh SW, Jackson-Cook C, Archer KJ, Strauss JF. 2017. Expression patterns of the chromosome 21 microRNA cluster (miR-99a, miR-125b and let-7c) in chorioamniotic membranes. Placenta. 49:1–9. doi: https://doi.org/10.1016/j.placenta.2016.11.002
- Newberger DS. 2000. Down syndrome: prenatal risk assessment and diagnosis. Am Fam Physician. 62:825–832.
- Olmos-Serrano JL, Kang HJ, Tyler WA, Silbereis JC, Cheng F, Zhu Y, et al. 2016. Down syndrome developmental brain transcriptome reveals defective oligodendrocyte differentiation and myelination. Neuron. 89:1208–1222. doi: https://doi.org/10.1016/j.neuron.2016.01.042
- Pelleri MC, Cattani C, Vitale L, Antonaros F, Strippoli P, Locatelli C, et al. 2018. Integrated quantitative transcriptome maps of human trisomy 21 tissues and cells. Front Genet. 9:125. doi: https://doi.org/10.3389/fgene.2018.00125
- Ruiz-Zamora RA, Guillaumé S, Al-Hilaly YK, Al-Garawi Z, Rodríguez-Alvarez FJ, Zavala-Padilla G, et al. 2019. The CDR1 and other regions of immunoglobulin light chains are hot spots for amyloid aggregation. Sci Rep. 28:3123. doi: https://doi.org/10.1038/s41598-019-39781-3
- Salemi M, Fraggetta F, Galia A, Pepe P, Cimino L, Condorelli RA, Calogero AE. 2014. Cerebellar degeneration-related autoantigen 1 (CDR1) gene expression in prostate cancer cell lines. Int J Biol Markers. 29:e288–e290. doi: https://doi.org/10.5301/jbm.5000062
- Salemi M, Giambirtone M, Barone C, Salluzzo MG, Russo R, Giudice ML, et al. 2018. Mitochondrial mRNA expression in fibroblasts of down syndrome subjects. Hum Cell. 31(2):179–181. doi: https://doi.org/10.1007/s13577-018-0205-2
- Salemi M, Romano C, Barone C, Calí F, Caraci F, Romano C, Scavuzzo C, Scillato F, Salluzzo MG, Piccione M, et al. 2009. SPANX-B and SPANX-C (Xq27 region) gene dosage analysis in down's syndrome subjects with undescended testes. J Genet. 88(1):93–97. doi: https://doi.org/10.1007/s12041-009-0013-2
- Shaw CJ, Lupski JR. 2004. Implications of human genome architecture for rearrangement-based disorders: the genomic basis of disease. Hum Mol Genet. 1:R57–R64. doi: https://doi.org/10.1093/hmg/ddh073
- Smyth GK. 2004. Linear models and empirical Bayes methods for assessing differential expression in microarray experiments. Stat Appl Genet Mol Biol.
- Sobol M, Klar J, Laan L, Shahsavani M, Schuster J, Annerén G, Konzer A, Mi J, Bergquist J, Nordlund J, et al. 2019. Transcriptome and proteome profiling of neural induced pluripotent stem cells from individuals with down syndrome disclose dynamic dysregulations of key pathways and cellular functions. Mol Neurobiol. 56(10):7113–7127. doi: https://doi.org/10.1007/s12035-019-1585-3
- Sullivan KD, Lewis HC, Hill AA, Pandey A, Jackson LP, Cabral JM, et al. 2016. Trisomy 21 consistently activates the interferon response. Elife. 5:e16220. doi: https://doi.org/10.7554/eLife.16220
- Tang Y, Schapiro MB, Franz DN, Patterson BJ, Hickey FJ, Schorry EK. 2004. Blood expression profiles for tuberous sclerosis complex 2, neurofibromatosis type 1, and down’s syndrome. Ann Neurol. 56:808–814. doi: https://doi.org/10.1002/ana.20291
- Totland C, Kråkenes T, Mazengia K, Haugen M, Vedeler C. 2018. Expression of the onco neural protein CDR1 in cerebellum and ovarian cancer. Oncotarget. 9:23975–23986. doi: https://doi.org/10.18632/oncotarget.25252
- Weick JP, Held DL, Bonadurer GF, Doers ME, Liu Y, Maguire C, et al. 2013. Deficits in human trisomy 21 iPSCs and neurons. Proc Natl Acad Sci USA. 110:9962–9967. doi: https://doi.org/10.1073/pnas.1216575110
- Zhao J, Zhang Z, Ren S, Zong Y, Kong X. 2016. Co-expression network analysis of down's syndrome based on microarray data. Exp Ther Med. 12:1503–1508. doi: https://doi.org/10.3892/etm.2016.3462