
Abstract
Pig farming is one of the major contributors to the livestock industry. In recent years, palm kernel cake (PKC) has increasingly been used in the feed industry as an alternative source of feed ingredient for pigs. As pigs have a great sense of smell, difference in volatile composition of PKC could affect its acceptance and inclusion rate in pig feed. In this study, a comparative study on the volatile profiles of palm kernel expeller (PKE) and palm kernel meal (PKM) was performed using GC-MS coupled with dynamic headspace (DHS) sampling techniques. Our aim is to understand the contribution of geographical origin, processing technology and moisture content to the volatile profiles of PKE and PKM by analysing a total of 56 samples using GC-MS-DHS. Using data analytics, we have obtained a ‘volatile fingerprint’ of PKE and PKM sourced from different processing plants. We have also gained insight into the potential odour-active compounds in palm kernel cakes of different processes. These results provide scientific basis for the development of more palatable and economical animal feed involving palm kernel cake.
Introduction
Palm kernel cake (PKC) is a by-product of the crushing and extraction of oil from the palm kernel. Depending on the method of extraction, PKC can be referred as either palm kernel expeller (PKE) or palm kernel meal (PKM). We use the term PKM in this text to refer to the palm kernel cake produced from solvent extraction. The process is costly with a high extraction efficiency and the resultant PKM contains a very low amount of residual oil (<3%). On the other hand, PKE is produced from screw press extraction which is more commonly used in the palm kernel oil processing plants. This mechanical extraction process leaves a significant amount of oil ranging from 8% to 10% in PKE. PKC also contains 12%–14% protein. It is widely used as a ruminant feed for growth and fattening (Heuzé et al., Citation2016). However, the high fibre content (16%–18%) of both PKM and PKE can reduce the apparent digestibility for non-ruminants, limiting the inclusion in feeds for these animals.
Palm kernel expeller in swine diets
Despite the high fibre content, PKE has been increasingly used as a replacement for corn and soybean meal in swine diets. The metabolizable energy (ME) of PKE for pigs is 10–10.5 MJ/kg (Alimon, Citation2004). This is only slightly lower than that of ruminants (10.5–11.0 MJ/kg) and much higher than that of poultry (6.5–7.5 MJ/kg). The higher ME of PKE for pigs is possibly due to better digestibility of the PKE fibre in pigs as they possess a larger caecum (Alimon, Citation2004). Despite the higher ME, it was frequently observed that the feed intake was significantly reduced when PKE was used in the swine diets. Jaworski et al. (Citation2014) reported that the inclusion of at least 15% PKM in diets for weaning pigs did not negatively affect growth performance, but pig performance might be reduced if PKE is used. It is known that the palatability of feed is dependent on several factors including taste, smell and texture of the feed. These factors could be significantly affected by the processing technology applied (Nyachoti et al., Citation2004). For instance, the palatability of feed can be improved after the removal of the residual antinutritional factors such as naturally occurring bitter tasting compounds through solvent extraction process (https://www.pigprogress.net/). Another largely unexplored aspect is the sense of smell which is often experienced prior to consumption and serves as an initial attractant to feed (Frederick and Heugten, Citation2003). The inclusion rate of PKC in swine diet was recommended at 15–25%, but in most cases, it was used at a lower level of 5–10% (Alimon, Citation2004). Feedback from PKC traders and customers in animal feed industry highlighted that in addition to the fibre digestion issue, a perceived smoky smell from PKE could have also contributed negatively in the acceptance of PKE in swine diet. It is known from earlier studies that the retention of volatile compounds by feed ingredients correlates with its fat content such that the higher the fat content the higher the volatile compound retention in feed (Roura, Citation2003). Therefore, it is likely that the distinctive volatile compounds of PKE which contains a higher residual oil could negatively affect the acceptance of PKE when it is fed to the pigs.
Various analytical techniques have been used for the analysis of chemical composition of plant and agricultural products. A study on essential oils by Samfira et al., described the use of photonic instrument (MIR absorption spectrophotometry) to provide a quick method for confirmation of the identity of different types of essential oils (lavender, peppermint, green Douglas, fir and chicory) based on their distinctive spectra as these oils have varying concentrations of aromatic compounds from different chemical groups including terpenoids, ketones, aldehydes and esters (Samfira et al., Citation2015). In this study, they looked into a technique that could provide robust identity confirmation of which species factor had a significant influence on the analysis.
Plant and agricultural products that came from the same species could still vary in terms of the composition and content of their primary and secondary metabolites. This could be due to the effect of multiple variables like climate, cultivar, soil condition, processing technology and storage condition. In a report by Caunii et al. on the isolation and separation of inulin from Phalaris arundinacea roots, the authors described that the chemical composition of P. arundinacea roots varied based on the cultivar, pedoclimatic conditions and the applied agro technique (Cauni et al., Citation2015). In the study, a high content of sugar in the roots had led to an adjustment of the extraction method to provide optimized extraction of the target molecules. In a separate report, the stability of maize zeaxanthin ethanol extract was studied over 30 days of storage at different temperature, light, and with or without antioxidant conditions. This study not only highlighted how these conditions had changed the zeaxanthin concentrations but also presented an optimal storage condition to improve the stability of the zeaxanthin preparation (Butnariu et al., Citation2014). These studies show that several factors like climate, geographical origin and agricultural techniques can greatly influence the chemical composition of food products of the same species.
Thus, in our study, we aim to elucidate the contribution of geographical origin, processing technology and moisture content to the volatile profiles of PKE and PKM using GC-MS with dynamic head space sampling. Several sampling procedures to isolate volatile organic compounds (VOCs) have been previously reported (Blanch et al., Citation1991). Liquid–liquid extraction is a time-consuming and labour-intensive process that is also prone to bias due to analyte affinity for the solvent used (Hardy, Citation1969; Blanch et al., Citation1991). Analyte recovery from headspace SPME techniques and static headspace sampling methods are largely dependent on sample-headspace equilibrium (Bicchi et al., Citation2012). Dynamic headspace sampling is advantageous because DHS involves the continuous sweeping of volatiles from the sample headspace onto an adsorbent material, eliminating the need for equilibrium establishment (Miller and Stuart, Citation1999). The adsorbed volatiles are then separated by gas chromatography (GC), while the compound identity is established using mass spectrometry. Mass spectrometry confers the advantage of high sensitivity with minimum sample volume (Butu, Citation2014) and can elucidate molecular structure and confirm compound identity using the NIST database. A better understanding of the volatile profile of these palm kernel cakes could possibly promote an improvement in its palatability and a better utilization of the meal as an economical ingredient for animal feed.
Materials and methods
Materials
PKE (46 samples) and PKM (10 samples) were obtained from Wilmar (WIL) group's palm kernel crushing and solvent extraction plants located in Indonesia and Malaysia. To account for batch to batch variations, samples from each factory were collected at different times from the production lines. In the mechanical extraction process, PKE produced is doused with water to lower the meal temperature. We collected samples of PKE before and after the water treatment in two of the factories (Table ).
Table 1. List of PKE and PKM samples from palm kernel processing plants in Indonesia and Malaysia.
Dynamic head space sampling (DHS)
PKM or PKE (1 g) was weighed in a headspace vial (20 ml, silicone layer/PTFE lamination, Gerstel, Müllheim a/d Ruhr, Germany). Sample preparation and injection were performed using the fully automated Gerstel MPS-2 autosampler and Gerstel MAESTRO software. The vial was incubated in the dynamic headspace (DHS) chamber at 80°C for 3 min after which the sample was purged with a stream of pure nitrogen at a constant flow rate of 100 ml/min for 20 min at 80°C. The volatile compounds in the headspace were adsorbed onto a Tenax TA tube. A thermal desorption unit (TDU) was used to thermally desorb the adsorbed volatiles in the splitless mode at 230°C for 10 min. To ensure that the volatiles released from the TDU are quantitatively trapped, the cooled injection system-programmed temperature vaporizer (CIS-PTV) was used. The CIS was heated from 80°C to 230°C at the rate of 12°C/s-1 with the split valve closed during sample injection into the GC inlet.
GC-MS analysis
Analyses of volatile compounds were performed on an Agilent 7890B GC coupled to a 5977B quadruple mass spectrometer. The separation of compounds was performed on a DB-FFAP column (60 m × 250 µm × 0.25 µm; Agilent Technologies, Middleburg, OI, USA). Helium was used as the carrier gas at a flow rate of 1.9 ml/min and the solvent vent mode was used. The inlet temperature was 250°C. The oven program was as follows: initial temperature 50°C held for 1 min, then increased to 230°C at the rate of 10°C/min and held for 20 min. The temperature of the ion source and transfer line was 250°C. The mass spectrometer was in the electron ionization mode with an ionization energy of 70 eV, scan range of 40–300 m/z and a solvent delay of 3.75 min. The mass spectra were compared with the NIST14 library. Unknowns Analysis and Agilent Chemstation software were used to assign the spectra. Percentage peak area method was used to quantify VOCs.
Data analysis
To reveal unbiased and unsupervised data patterns, hierarchical clustering was performed on the normalized mass spectra intensities using Ward's agglomerative clustering algorithm and Pearson's correlation distance metric across samples (Murtagh et al., Citation2014). Resulting clustered data was visualized on a heatmap. Partial least squares discriminant analysis was performed to reveal important volatiles that explains the separation of sample clusters observed in the unsupervised analysis. As the multivariate space is larger than the sample size and in order to prevent overfitting, bootstrapping was performed by random permutation of both the matrix of features and the vector of responses. The simulated random data has lower Q2Y scores having a p-value of 0.05, suggesting that the model fit is unlikely due to random chance. Resulting score and loading matrix were visualized on a scatterplot. Variable of importance in projection (VIP) (Wold et al., Citation2002) was computed to identify the top 20 most important volatiles that explain the latent space.
Results and discussion
The separation and compound identification of the volatile organic compounds (VOCs) in PKE and PKM were performed using GC-MS. Mass spectrometer works on the principle of ionization of compounds resulting in distinct ion fragmentation patterns comprising a molecular ion and subsequent fragmentation ions (Torde et al., Citation2013; Butu, Citation2014). Compound identification was performed by matching these fragmentation patterns with those reported in the NIST14 library. The linear retention indices of the compounds were also evaluated to confirm the compound identity and odour descriptions were obtained from the Good Scents Company database (http://www.thegoodscentscompany.com). For ease of comparison, the volatile organic compounds (VOCs) were grouped into eight clusters based on their chemical groups, which included acids, aldehydes, ketones, esters, furans, pyrazines, alcohols and others which include aromatic hydrocarbons. The percentage distribution of each cluster in all samples was then compared.
Effect of geographical origin on PKE
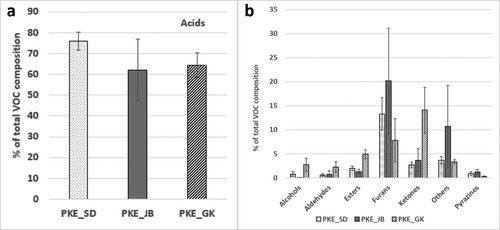
On comparing PKE from Malaysian and Indonesian processing plants, it was observed that the distribution of compounds varied between different regions. Acids, including volatile acids like acetic acid, formic acid and propanoic acid along with fatty acids like decanoic acid and octanoic acid made up most compounds in PKE. The acid content in all the PKE samples was largely comparable with PKE_SD having slightly higher percentage composition on average (Figure a). Furans, which are known to contribute to a bready aroma, were shown to be higher on average in JB factory (Figure b). PKE_JB also showed a higher percentage composition of hydrocarbons on average, with phenol, anisole and maltol being the most predominant. Interestingly, PKE from GK factory was analysed to have a higher percentage of ketones with a floral/fruity flavour profile as compared to those from Malaysia factories. Based on our current analysis, it is suggested that PKE originated from different geographical regions can have very distinctive volatile profiles despite similar processing technology being used. This could provide a means to trace the PKE product to its production lines based on its distinctive volatile profile.
Figure 1. Effect of geographical origin. (a) Acid content in PKE from all three factories is largely comparable with slightly higher composition in PKE_SD on average. (b) Comparison of remaining VOCs in PKE from Malaysia and Indonesia shows that the composition varies based on the geographical origin of the sample.
Effect of processing technology
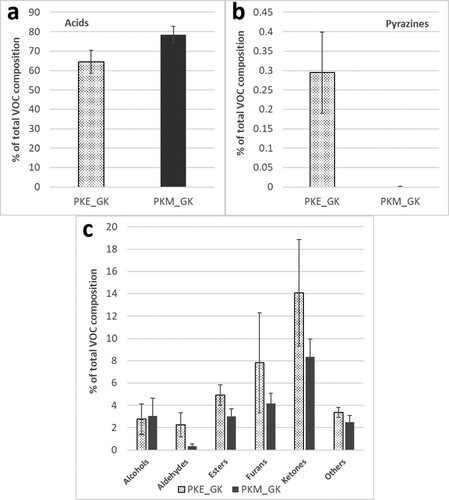
PKE is produced by mechanical screw-press extraction, while production of PKM involves the use of solvent. When mechanical extraction is used, there is a higher amount of residual oil (8%–10%) in PKE as opposed to only <3% in PKM. To minimize the contribution from geographical origin, we have compared the composition of volatile organic compounds of both PKM and PKE originated from GK factory (Indonesia). PKM had higher acids which are known to contribute favourable fatty aromas while the composition of pyrazines and aldehydes was significantly lower, possibly due to lower extraction temperature and lower oil content in the final product (Figure a–c). These two groups of chemical compounds are responsible for the potentially unfavourable smoky smell which is characteristic of PKE. The significant reduction of these volatile compounds in PKM suggests that it could be used to substitute PKE for animals that are averse to strong smoky smell caused by pyrazines and aldehydes. With potential negative effect of the perceived smoky smell in PKE by some of the swine farmers, solvent extracted PKM with lower percentage of the smoky smell compounds could be an interesting alternative for inclusion in swine diet. Nevertheless, further animal study and farm trials are needed to understand the extent of preference between these two PKCs.
Figure 2. Effect of processing technology. (a) Comparison of acid content shows that PKE (mechanically extracted) has less volatiles with acidic attribute than PKM (solvent extracted). (b) PKM has a significantly lower pyrazine content. (c) Comparison of VOCs shows that PKM has a lower composition of VOCs than PKE probably due to reduced residual oil content in PKM after processing.
Effect of water treatment on the chemical composition of PKE
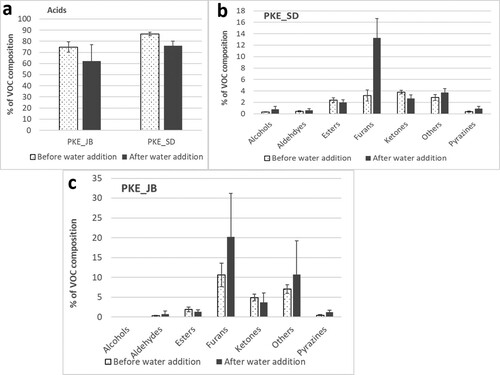
To understand the effect of water addition to PKE on its volatile profile, we collected PKE samples before and after water treatment in two factories (JB and SD). The composition of acids decreased in both PKE_JB and PKE_SD on average (Figure a) while the furan composition increased in both factories after the water treatment (Figure b and c). Furans are lipid peroxidation products which are produced by oxidative degradation of poly-unsaturated fatty acids (PUFAs) (Moro et al., Citation2012). In PKE, 2-Furanmethanol and 2-Furancarboxaldehyde, 5-methyl- are the key furans produced. While the former has a bready smell, the latter is caramellic. This explains the bready odour of PKE after water treatment. In addition to this, pyrazines were also found to have increased significantly upon water addition in both factories, with pyrazine methyl being the most abundant. Pyrazines are known to contribute to roasted, smoky flavour to food and are generated by Strecker degradation between amino acids and sugars. This too could have contributed to the bready odour of the PKE products from both JB and SD. The composition of ketones decreased on average, in both PKE after treatment with water (Figure b, c). Ketones, having sweet andfruity aroma may be favourable if present in higher composition in the final PKE product. Thus these results suggest the possibility of producing an improved PKE product with a better volatile profile by adjusting water treatment process to ensure that favourable volatile compounds are not lost.
Figure 3. Effect of water treatment on PKE. (a) Acid composition decreased on average in PKE from both factories after dousing the meal with water. (b, c) In PKE_SD and PKE_JB, furans and pyrazines with smoky smell increased while ketones with fruity and sweet smell decreased impacting the aroma profile of the final PKE product.
Classification and data analytics of volatiles for PKE and PKM
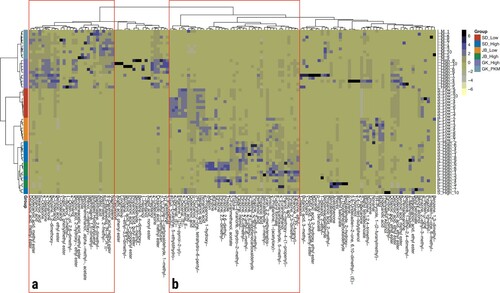
To classify the volatile compounds exuded from the different PKE and PKM, we compared the GC-MS profiles of 56 samples and 134 identified volatiles using an unsupervised analysis. Hierarchical clustering showed that samples can be clustered by both the type of samples (i.e. high moisture PKE, low moisture PKE and PKM) and geographical location (i.e. GK = Indonesia, SD = East Malaysia and JB = West Malaysia). Within the group of samples from Indonesia, PKE-high moisture samples had higher intensities of ketones along with fatty acids when compared to PKM (Figure a). The samples from both factories in Malaysia also differed in intensities of compounds, namely furans, aldehydes, pyrazines and ketones between high and low moisture samples (Figure b). The unsupervised analysis was unbiased because no information of the sample was used to derive the clustering.
Figure 4. Unsupervised analysis of all profiled volatiles. The heatmap show that the PKE-high, PKE-low and PKM clusters can be explained by volatile intensity. These clusters also appear to separate the samples by geographical location. (a) Example of volatiles that are specific to Indonesia (GK), and within this cluster, differences between PKE-high and PKM. (b) Example of volatiles that are specific to Malaysia (SD and JB), and within this cluster, differences between PKE-high and PKE-low.
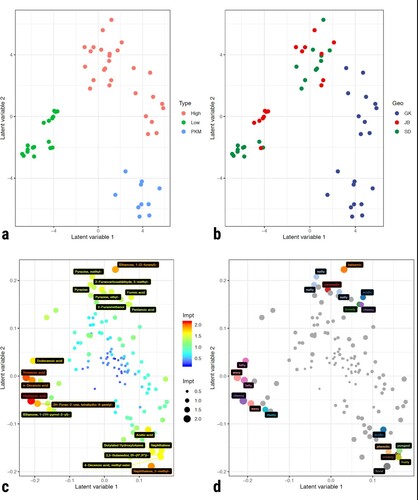
In order to investigate the specific volatile differences that drive the clusters, a multivariate supervised model was used. Partial least squares discriminant analysis (PLS-DA) corroborated the same trend to the unsupervised analysis; there was a group of high moisture PKE samples from Indonesia that lie closer to the PKM samples although they were clearly separated by type. Samples from Malaysia were also separated by type regardless of the specific factory that produced the samples (Figure a, b). The variable weights in the PLS-DA model suggest three groups of highly important variables (Figure c, d) that explain the clustering of samples in Figure (a). Consistent olfactory sensory descriptors revealed that these important volatile features drive the clustering of samples, e.g. high moisture PKE samples exhibited nutty and roasty flavours due to high pyrazine content, low moisture PKE samples exhibited waxy and fatty flavours due to high concentration of fatty acids and PKM exhibited floral, fruity and acidic flavours contributed by 2-methyl naphthalene, 4-decenoic acid, methyl ester and 2,3-Butanediol.
Figure 5. Partial least squares discriminant analysis. (a) XY scores of the samples in a two-dimensional partial least squares latent space show clear linear separation of samples clustered by PKE-high, PKE-low and PKM. (b) The same XY-scores are coloured by geographical location, also show clear linear separation across Indonesia (GK) and Malaysia (JB and SD) samples. (c) XY weights corresponding to the volatiles were coloured and sized by variable of importance in projection (VIP), reveal that volatiles with similar functional chemical groups explain the three types of samples PKE-high, PKE-low and PKM. (d) The same XY weights are coloured by perceived olfactory sensory data suggest that volatiles with similar olfactory descriptors contribute to the PKE-high, PKE-low and PKM clusters.
These results indicate that a ‘volatile fingerprint’ of PKE (low and high-water content) and PKM (solvent extraction) can be established based on the processing technology and geographical origin of samples. Comparative study on volatile profiles of plant-based products like wine, olive oil and honey have been carried out to understand the contribution of geographical origin, processing technology, and other variables on the products to establish criteria of product quality (da Costa et al., Citation2018; Stój et al., Citation2017; Tura et al., Citation2004). Our study on volatile profiles of PKE and PKM would allow localization of these products based on their quality and provide a basis for customization of feed to improve palatability.
Our data indicates that, PKE comprises a high percentage of compounds with smoky smell while PKM has a floral, fruity volatile profile. From previous studies conducted on the flavour preferences for pig feed, it has been demonstrated that sweet, milky, fruity, cheesy and meaty aromas or a combination of these are more likely to be preferred (Nofre et al., Citation2002; Roura, Citation2003). It is noteworthy that as these descriptions of the aroma are largely based on human perception, direct conclusions regarding the palatability of the feed for pigs cannot be made yet since animal studies need to be conducted to understand the perception of the feed based on porcine olfaction.
Our work highlights the most abundant volatiles in PKE and PKM based on GC signal intensities. As the contribution of individual VOC to the overall aroma depends both on its concentration and odour potency, further analysis using instrument like GC-olfactometry (GC-O) (Delahunty et al., Citation2006) will be needed to understand the odour threshold that allows a more direct correlation of individual odour-active compound's contribution to the flavour profile of the feed.
Conclusion
To our knowledge, this is the first study of the volatile components of PKE and PKM using GC-MS with DHS sampling. Our study has helped gain insight into the volatile profiles of PKE and PKM products from Malaysia and Indonesia. It was observed that both PKE and PKM had higher content of acidic volatiles with possible acidic and fatty odour. However, PKM had a significant reduction in its pyrazine and aldehyde volatile content as compared to PKE probably due to solvent extraction process. Both volatiles could have contributed to distinctive smoky smell of PKE. We have also found that PKE from each factory has its unique set of volatiles probably due to combined factors of geographical origin of kernel nut, processing technology and moisture content. The use of data analytics has provided a means to establish a ‘volatile fingerprint’ of PKE that could be used as a reference for product quality. It was also observed that treatment of PKE with water resulted in changes in concentration of some volatile organic compounds. Thus, the data from this study can be used to customize the PKE or PKM products based on the need of feed industry. We observed that PKM comprised more potentially favourable aroma compounds with fruity and sweet flavours that may be more palatable for pigs. Further studies will be done to understand the intensity and odour potency of these flavour compounds and how they impact the palatability of the feed.
Acknowledgement
The authors would like to thank Mr. Hermil Casilang, Mr. Chew Kah Kiong, Mr. Cheah Siew Mean, Mr. Albert Hiew, and Mr. Muhammad Firdaus for the arrangement of PKE and PKM samples. We would also like to thank Prof. Chua Nam-Hai for his support of this work.
Disclosure statement
No potential conflict of interest was reported by the author(s).
Data availability statement
The data that support the findings of this study are available at 4TU.Centre for Research Data https://doi.org/10.4121/uuid:fc3915f7-7337-4439-9dd1-d3275d7c1661.
Correction Statement
This article has been corrected with minor changes. These changes do not impact the academic content of the article.
References
- Alimon, A., 2004. The nutritive value of palm kernel cake for animal feed, palm oil developments.
- Bicchi C, Cordero C, Liberto E, Sgorbini B, Rubiolo P. 2012. 4.01 – Headspace sampling in Flavor and Fragrance Field. In: Pawliszyn J.B.T.-C.S., S. P., editor. Oxford: Academic Press; p. 1–25. https://doi.org/https://doi.org/10.1016/B978-0-12-381373-2.00125-3.
- Blanch GP, Reglero G, Herraiz M, Tabera J. 1991. A comparison of different extraction methods for the volatile components of grape juice. 29:11–15.
- Butnariu M, Rodino S, Petrache P, Butu M. Determination and quantification of maize zeaxanthin stability. Digest Journal of Nanomaterials and Biostructures. 2014(2):745–755.
- Butu M. 2014. Study of zingiberene from Lycopersicon Esculentum fruit by mass spectometry. Dig. J. Nanomater. Biostructures. 9:935–941.
- Cauni A, Butu M, Rodino S, Adina N, Samfira I. 2015. Isolation and separation of inulin from Phalaris arundinacea roots. Rev. Chim. 66:472–476.
- da Costa ACV, Sousa JMB, da Silva MAAP, Garruti DDS, Madruga MS. 2018. Sensory and volatile profiles of monofloral honeys produced by native stingless bees of the Brazilian semiarid region. Food Res. Int. 105:110–120. doi:https://doi.org/10.1016/j.foodres.2017.10.043.
- Delahunty C, Eyres G, Dufour J-P. 2006. Gas chromatography-olfactometry. J. Sep. Sci. 29:2107–2125. doi:https://doi.org/10.1002/jssc.200500509.
- Frederick B, Van Heugten E. 2003. Palatability and flavors in swine nutrition. Anim. Sci. Facts. 1–4.
- Hardy PJ. 1969. Extraction and concentration of volatiles from dilute aqueous and aqueous-alcoholic solution using trichlorofluoromethane. J. Agric. Food Chem. 17:656–658. doi:https://doi.org/10.1021/jf60163a015.
- Heuzé V, Tran G, Sauvant D, Noblet J, Renaudeau D, Bastianelli D., Lebas F. 2016. Palm kernel meal. feed. INRA, CIRAD, AFZ and FAO.
- Jaworski N, Shoulders J, González-Vega J, Stein H. 2014. Effects of using copra meal, palm kernel expellers, or palm kernel meal in diets for weanling pigs. Prof. Animal Sci. 243–251. doi:https://doi.org/10.15232/S1080-7446(15)30108-X.
- Miller ME, Stuart JD. 1999. Comparison of gas-sampled and SPME-sampled static headspace for the determination of volatile flavor components. Anal. Chem. 71:23–27. doi:https://doi.org/10.1021/ac980576v.
- Moro S, Chipman JK, Wegener JW, Hamberger C, Dekant W, Mally A. 2012. Furan in heat-treated foods: Formation, exposure, toxicity, and aspects of risk assessment. Mol. Nutr. Food Res. 56:1197–1211. doi:https://doi.org/10.1002/mnfr.201200093.
- Murtagh F, Legendre P. 2014. Ward's Hierarchical Agglomerative Clustering Method: Which Algorithms Implement Ward's Criterion. J. Classif. 31:274–295.
- Nofre C, Glaser D, Tinti J-M, Wanner M. 2002. Gustatory responses of pigs to sixty compounds tasting sweet to humans. J. Anim. Physiol. Anim. Nutr. (Berl). 86:90–96.
- Nyachoti M, Zijlstra CT, de Lange C, Patience J. 2004. Voluntary feed intake in growing-finishing pigs: A review of the main determining factors and potential approaches for accurate predictions. Can. J. Anim. Sci. 84:549–566. doi:https://doi.org/10.4141/A04-001.
- Roura E. 2003. Recent studies on the biology of taste and olfaction in mammals. New Approaches in pig Nutrition. 10:1–14.
- Samfira I, Rodino S, Petrache P, Cristina RT. 2015. Characterization and identity confirmation of essential oils by mid infrared absorption spectrophotometry. Dig. J. Nanomater. Biostructures. 10:557–566.
- Stój A, Czernecki T, Domagała D, Targoński Z. 2017. Comparative characterization of volatile profiles of French, Italian, Spanish, and Polish red wines using headspace solid-phase microextraction/gas chromatography-mass spectrometry. Int J Food Prop 20:S830–S845. doi:https://doi.org/10.1080/10942912.2017.1315590.
- Torde RG, Therrien AJ, Shortreed MR, Smith LM, Lamos SM. 2013. Multiplexed analysis of cage and cage free chicken egg fatty acids using stable isotope labeling and mass spectrometry. Molecules. doi:https://doi.org/10.3390/molecules181214977.
- Tura D, Prenzler PD, Bedgood DR, Antolovich M, Robards K. 2004. Varietal and processing effects on the volatile profile of Australian olive oils. Food Chem. 84:341–349. doi:https://doi.org/10.1016/S0308-8146(03)00217-6.
- Wold S, Sjöström M, Eriksson L. 2002. Partial Least Squares Projections to Latent Structures (PLS) in Chemistry. Encyclopedia of Computational Chemistry. doi: https://doi.org/10.1002/0470845015.cpa012.