
ABSTRACT
This study investigated whether an optic neuropathy results in changes of brain glucose metabolism using 2-deoxy-2-F-18 fluoro-D-glucose (F-18 FDG) positron emission tomography (PET) scan. Optic nerves were crushed in the left eye of four male Sprague–Dawley rats, which were examined using F-18 FDG PET 7 days before and after surgery for a total of 5 weeks. We calculated the standardized uptake value ratio and analyzed relative changes in the visual cortex, thalamus, hypothalamus, and superior colliculus over time. The glucose metabolism in both visual cortices elevated after an optic nerve injury. A trend towards higher glucose metabolism, reaching significance 2 weeks following the procedure, was observed in the right visual cortical areas compared with those in the left hemisphere. The standardized uptake value ratios of both thalami significantly increased in 2 weeks as compared with the baseline. Other brain regions showed no significant changes. Traumatic optic neuropathy in rats causes asymmetrical elevation in brain glucose metabolism in the visual cortex, while the observed changes in the thalami as compared with baseline were similar in both hemispheres of the rat brain.
Introduction
The optic nerve is a unique extension of the central nervous system, and the visual pathway is constituted of several neural connections, from intraocular retinal ganglion cells (RGCs) to the visual cortex. The axons of RGCs, which are located at the innermost layer of the retina, form the optic nerve on leaving the eye at the lamina cribrosa. The optic nerve then extends through the optic chiasm to the lateral geniculate nucleus (LGN), where most of the axons form synapses to relay further information to the primary visual cortex (Thuen et al. Citation2005).
Inflammation, ischemia, and trauma can result in an optic nerve injury and subsequent functional deficits. Such damage can be transmitted in a retrograde or anterograde direction. Optic disc atrophy can be observed in fundus examination as a consequence of retrograde degeneration after an optic nerve injury. The use of optical coherence tomography (OCT) has facilitated quantitative analyses of the retinal nerve fiber layer and ganglion cell layer atrophies (Levin and Louhab Citation1996; Medeiros et al. Citation2003; Vessani et al. Citation2007; Bellusci et al. Citation2008). Several studies have also reported anterograde optic nerve degeneration, in which the damage spreads from the retina to the brain. Changes in the LGN and visual cortex have been detected in glaucoma patients, and similar observations were made in primates (Yucel et al. Citation2003; Yucel and Gupta Citation2008). You et al. (Citation2012) found that in rats with optic nerve axotomy, Akt phosphorylation disappeared in the dorsal LGN and primary visual cortex, which preceded cellular changes. Other groups used a different approach to examine cellular and molecular changes within the brain using functional magnetic resonance imaging (fMRI). Moreover, Tan et al. (Citation2016) have reported based on the fMRI result that acute open globe injury induces brain activity dysfunctions within various regions including the left cuneus, left middle cingulum cortex, and bilateral precuneus.
While the main energy source of the brain is glucose, it does not have the ability to store this molecule. Therefore, a continuous supply of glucose from the blood to the respective brain area is essential to maintain organ functions. Malfunction within certain brain areas leads to a change in glucose utilization. Hence, a hypometabolic area is a region with hypofunctioning neurons (Mergenthaler et al. Citation2013). In this aspect, PET is one of the most sensitive and noninvasive imaging modalities for the examination of physiologic brain functions in vivo. Among the wide variety of radiolabeled tracers, F-18 FDG is the most widely used with PET. As a glucose analogue, F-18 FDG enables the evaluation of glucose metabolism within the brain. Taking advantage of advanced preclinical PET scanners, robust assessments of brain metabolism in rodents were reported in various fields of neuroscience (Gispert et al. Citation2017; Park et al. Citation2017; Radford et al. Citation2018), including neurodegenerative diseases (Lu et al. Citation2016; Liang et al. Citation2018). However, only few clinical studies have investigated the physiologic or pathologic alterations in the brain associated with visual function (Kiyosawa et al. Citation1989; Suzuki et al. Citation2016).
The aim of this study was to investigate potential changes associated with an optic nerve injury in cortical glucose metabolism using 18-FDG PET in a traumatic optic neuropathy rat model.
Methods
A total of four male Sprague–Dawley rats (Koatech, Gyeonggi, Republic of Korea) at 7 weeks of age, with an average body weight of 211.76 g were used. Rats were fed a standard commercially available diet and allowed to access water ad libitum. PET scan was performed 7 days before and after surgery for a total of 5 weeks. Anesthesia was induced by isoflurane inhalation (5% for induction and 2% for maintenance), and oxygen was supplemented during surgical procedures and image scanning. Animals were used according to the association for research in vision and ophthalmology resolution on the use of animals in research. The animal experiments were approved by the Institutional Animal Care and Use Committee of Pusan National University Hospital (No. PNUH-2017-111).
Crushed optic nerve injury
All four rats were subjected to unilateral crushed optic nerve injury (cON) in the left eye. With the aid of a binocular operating microscope, lateral canthotomy was performed. Following conjunctival incision, the extraocular muscle was resected to expose the optic nerve. As a precaution to not interfere with the blood supply, the intraorbital portion of the optic nerve at 1–2 mm caudal to the lamina cribrosa, was crushed for 1 s with cross-action forceps. The incised skin was sutured with a 4–0 silk and an antibiotic was applied to prevent infection.
F-18 FDG PET acquisition
The animals were fasted overnight before undergoing F-18 FDG PET scan to enhance F-18 FDG uptake into the brain. F-18 FDG PET was performed 45 min after an intravenous tail vein injection of 18.5 MBq of F-18 FDG in a 0.9% NaCl solution of 0.2 mL. After FDG uptake, all animals were placed in a prone position on the bed of the F-18 PET scanner and the core body temperature of the animals was maintained via a temperature-controlled heating pad. During scanning, rats were anesthetized with isoflurane. The rats were prepared in the dim light and in the condition of removed nosie or smell before and during the F-18 FDG PET scan acquisition to minimize unexpected cerebral response to any stimulation.
PET imaging was performed for 30 min using Siemens Inveon PET-CT scanners (Siemens Preclinical Solution, Knoxville, Tennessee), which consists of a 15 cm-diameter ring with 96 position sensitive ray scintillation detectors and provided a 10.8 cm-trans-axial and a 7.8 cm-axial field of view with an intrinsic resolution of 1.8 mm. The intrinsic resolution of the PET scanner is ∼1.4 mm full width at half maximum at the center of the field of view. After two OSEM3D iterations, FastMAP generated an image of 256 × 256 × 159 voxels with a voxel size of 0.390 × 0.390 × 0.796 mm using 18 iterations and 16 subsets. Acquisition, corrections, and reconstruction were performed using the manufacturer’s software.
Volume of interest analysis
PET images were processed using the PMOD3.6 software (PMOD Technologies, Zurich, Switzerland), and each image was manually pre-aligned and followed by rigid matching to the FDG. The PET data was converted to units of activity (uCi) and registered to the volume of interest (VOI) atlas selected to a rat F-18 FDG brain image template (Schiffer et al. Citation2006).
Co-registered PET images were uniformly cropped to a region surrounding the brain (170 × 170 × 240 voxels), which were manually re-oriented (x, y, z rotation), and automatically registered to the rat brain atlas using an algorithm that combines a rigid transformation of data and scaling of the atlas. The VOIs used for analysis in this study included the thalamus, the hypothalamus, the superior colliculus and the visual cortex.
The mean standard uptake value (SUV) for each VOI was normalized to the mean SUV of the medulla, thus obtaining an SUV ratio (SUVR). After calculating the SUVR, the right to left (R/L) ratio was used for comparative analysis of asymmetry between both sides of the cerebral cortex and deep gray matters of interest for further evaluation.
Real-time polymerase chain reaction (PCR)
The levels of citrate synthase (CS) and malate dehydrogenase 1 (MDH1), isocitrate hydrogenase 2 (IDH2), succinate dehydrogenase complex iron sulfur subunit B (SDHB), and oxoglutarate dehydrogenase (OGDH) in the visual cortex were measured. The brain was extracted 6 weeks after cON and bilateral visual cortices were dissected separately. The brain tissue RNA was extracted using TRIzol (Life Technologies, Rockville, MD). cDNA was prepared from 1 μg of total RNA using reverse transcription kit (Elpis Bio, Daejeon, Korea) at 42°C for 60 min, and 95°C for 10 min following the manufacturer's protocol. Real-time PCR was performed following the SYBR Green with ABI 7500 instrument’s protocol (Applied Biosystems, CA, USA). The reaction mixture contained HiPi real-time PCR 2x master mix (Elpis Bio, Daejeon, Korea), final concentration of 0.5 uM in each primer set, and 25 ng of cDNA adjusted with PCR-grade water. The reaction was performed in technical triplicates, and the mean of three independent biological replicates was calculated. Reaction conditions were as follows: initial denaturation at 50°C for 2 min and 95°C for 10 min (one cycle), 15 s at 95°C, and 30 s at 58°C (40 cycles). Table shows primer sequences. The results were normalized to β-2-microglobulin as endogenous control genes, selected from four candidate control genes (GAPDH, β -actin, cyclophilin A, and β-2-microglobulin). The primers used for quantitative PCR (qPCR) analysis were synthesized by a commercial service (Macrogen, Seoul, Korea). Normalization consisted of using the differences between the target gene cycle thresholds (CT), and the endogenous control gene cycle thresholds expression level to calculate the CT/target gene CT ratio (Delta CT). Delta/delta CT (ddCT) corresponds to the differences in delta CT between the bilateral visual cortical regions. Relative expression was calculated as 2∧(-ddCT).
Table 1. Sequence of primers.
Statistical analysis
All VOIs were analyzed individually using Kruskal–Wallis test with post-hoc analysis to account for multiple testing issues. Spearman rank correlation analysis was used for the comparison between the left and right side SUVRs of each brain region. The statistical analyses were performed using GRAPHPAD PRISM version 8.0 (GraphPad Software, Inc.), and MedCalc for Windows version 16.4.3 (MedCalc, Mariakerke, Belgium), with P < 0.05 considered statistically significant.
Results
Lesion-based analysis of the effect of cON on glucose metabolism over time
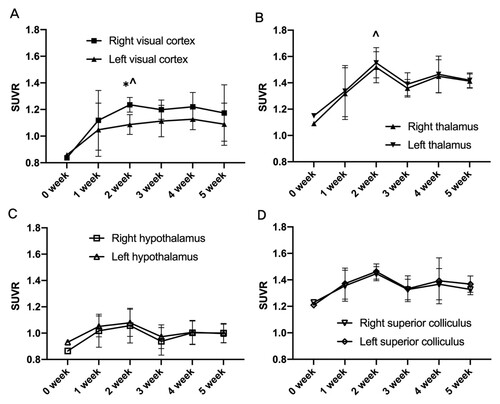
The SUVR of the right visual cortex which corresponds to the cON increased after surgery and this change was significant 2 weeks after cON as compared with the baseline. The SUVR of left visual cortex also showed a tendency, although without statistical significance, toward an increase in the SUVR as compared with the baseline PET. The difference between right and left visual cortices was significant 2 weeks after surgery.
The SUVRs of both thalami were significantly increased 2 weeks post-cON compared with the baseline. While there was no difference in glucose metabolism between right and left thalamus, both thalami showed high variability of SUVRs over time. Hypothalamus and superior colliculus did not show any changes over time (Figure ).
Figure 1. The effects of cON injury on brain glucose metabolism of the right and left region of interest over time. The cON injury induced region-specific changes in glucose metabolism as compared with the baseline (0 weeks) in the visual cortex (A) and thalamus (B). The SUVR of the right visual cortex was higher than that of the left visual cortex during the 5-week experimental period, with a significant difference observed in the PET image on the second week (A). The SUVR significantly increased in both thalami at 2 weeks post-surgery compared with the baseline as determined using PET images. No significant difference was observed between the right and left thalamus (B). The SUVRs of the hypothalamus (C) and superior colliculus (D) were not changed. SUVR is defined as the normalized SUV of each region with the SUV of the medulla of the same animal. Data are shown as mean±SEM. *P < 0.05, comparing ROIs of the right and left cerebral hemispheres, respectively. ∧P < 0.05, both sides of the ROIs compared with the baseline study of PET at 0 week.
Asymmetry of glucose metabolism between visual cortex and other brain areas
There were overall trends toward asymmetry in glucose metabolism between right and left hemispheres based on R/L of the SUVR (Figure ). At the baseline PET, R/L ratios of SUVRs in all ROIs including visual cortex, thalamus, hypothalamus, and superior colliculus ranged from 0.919–1.020. The asymmetry of glucose metabolism between the two hemispheres of the visual cortex was observed from the first week post-surgery. The R/L of SUVR in the visual cortex had reached its maximum in 2 weeks. Asymmetry in glucose metabolism was not found in any of the other assessed brain regions. The specific values of the R/L SUVR ratio are presented in Table .
Figure 2. Asymmetricity of glucose metabolism in each ROI over time. The ratio of glucose metabolism in the right and left visual cortices changed, with a maximum at 2 weeks post-surgery. The other regions, such as the thalamus, hypothalamus, and superior colliculus showed similar activity in both right and left sides.
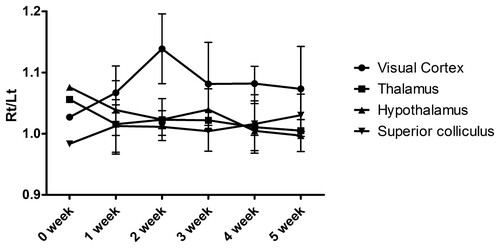
Table 2. Lesion based analysis of changes in ratio of SUVR (Right/Left).
Difference in tricarboxylic acid (TCA) cycle enzymes between right and left visual cortices
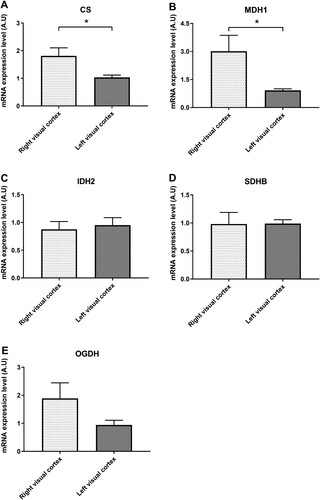
The levels of CS (Figure (A)) and MDH1 (Figure (B)) was significantly raised in right visual cortex compared with left visual cortex. There was no significant difference in the level of IDH2 (Figure (C)) and SDHB (Figure (D)) between right and left visual cortices. The level of OGHD showed increased trend in right visual cortex, however, there was no statistical significance (Figure (E)).
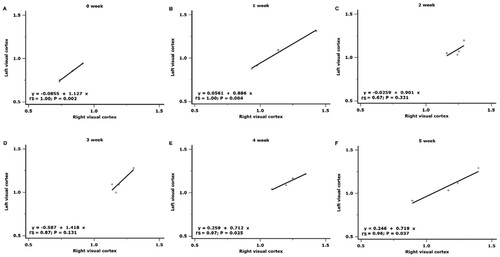
Figure 3. Cross-hemispheric correlations in glucose metabolism in the visual cortex. Significant cross-hemispheric correlations were found at the preoperative examination in the first, fourth, and fifth week after surgery.
Interhemispheric correlation of glucose metabolism in the visual cortex
There was a significant correlation between SUVRs of the right and left visual cortex at the preoperative status (rs = 0.996, P = 0.002) and the first week after cON (rs = 0.991, P = 0.004). The association diminished from the second (rs = 0.670, P = 0.331) to the third week (rs = 0.871, P = 0.131). However, 4 weeks after cON, this inter-hemispheric correlation re-emerged (rs = 0.972, P = 0.025) and persisted up to 5 weeks (rs = 0.957, P = 0.037) (Figure ).
Figure 4. Differences in enzymes of the tricarboxylic acid (TCA) cycle. The levels of citrate synthase (CS, A) and malate dehydrogenase I (MDHI, B) significantly increased in the right visual cortex. The isocitrate hydrogenase (IDH2, C) and succinate dehydrogenase complex iron sulfur subunit B (SDHB, D) did not show any difference in the right and left visual cortices. The level of oxoglutarate dehydrogenase (OGHD) increased in the right visual cortex without statistical significance (E).
Discussion
In our study, the resting glucose metabolism of the right visual cortex was increased after cON. Contralateral (left) visual cortex showed an increasing trend, presenting asymmetrical changes. In contrast, the glucose metabolism of the bilateral thalami increased to a similar degree as compared with the baseline after left cON, whereas the other assessed brain regions showed no change. Furthermore, an inter-hemispheric correlation was observed between the right and left visual cortices.
The traumatic optic neuropathy model was used in this study, adopting the crush injury model with an intra-orbital approach, due to its straight forward and fast procedure (Duvdevani et al. Citation1990). Yoles and Schwartz (Citation1998) measured for the first time a secondary degeneration in the cON model by the application of a dye distal to the injury site. You et al. (Citation2012) examined the anterograde mode of degeneration along the visual pathway after an optic nerve injury, including dorsal LGN and the primary visual cortex, via measuring apoptosis and changes in Akt phosphorylation in a rat model. In contrast to the above-mentioned studies, this study is based on the observation of functional changes through glucose uptake of the brain, rather than morphological and histological changes.
A directional spreading of neuronal degeneration has been investigated in a glaucoma model, by which ganglion cell loss induced degenerative changes within the LGN and primary visual cortex (Yucel et al. Citation2003). Yucel and Gupta (Citation2008) demonstrated that the sequential degenerative change of the intracranial optic nerve, LGN, and visual cortex in an experimental model is ideal for the study of anterograde and retrograde degeneration in central nervous system diseases.
The thalamus, hypothalamus, superior colliculus and visual cortex were included in the present analysis, all of which receive information from RGCs. In the visual system of rodents, the majority of visual input which is detected by the RGCs is transmitted to the LGN, before it is relayed to the visual cortex. From the remaining RGCs, projections via the retinohypothalamic tract (RHT) to the suprachiasmatic nuclei mediate entrainment of circadian rhythms to light, and projections to the olivary pretectal nucleus mediate pupillary light responses. The superior colliculus receives input from both visual and non-visual pathways to direct the attention to visual stimuli (Peirson et al. Citation2018). We included all anatomical regions within the path of visual input which were likely to be affected.
Previous research has suggested normalization of the brain activity using whole brain glucose uptake to reduce measurement variances (Welch et al. Citation2013). We hypothesized that in response to cON, a certain asymmetric decrease in glucose metabolism could be observed in specific brain areas with a change over time. The medulla is the lower half of the brain stem and is connected to the spinal cord, which contains the cardiac, dorsal and ventral respiratory groups, and vasomotor centers, which control heart rate, breathing, and blood pressure, respectively. We adopt the medulla for normalizing regional uptake rather than whole-brain uptake because it was expected not to be affected by the optic nerve injury.
Most visual sensory pathways are relayed via the thalamus and then transmitted into the cerebral cortex. The LGN is the major relay station between the retina and the primary visual cortex, which is located in the dorsal part of the thalamus. In this study, we did not analyze LGN alone but the entire thalamus because of technical limitation of PET image analysis, which might have affected the interpretation of results. The thalamus has many essential roles in human physiology ranging from relaying sensory signals including pain, temperature and crude touch, and regulation of consciousness and alertness. No changes apart from the thalamus were detected, likely due to the relatively low transmission of stimuli into these parts of the brain and the other effect to the thalamic region other than LGN.
We presumed that the glucose metabolism in the corresponding visual cortex would be decreased after cON compared to the baseline. However, an unexpected trend towards an increase in SUVR was found in the corresponding visual cortex. Moreover, CS and MDH1, and the TCA cyclic enzymes significantly increased in the right visual cortex, which supports our results that metabolism increased in the corresponding brain region. Brain glucose consumption reflects an increased neuronal activity (Weinberger Citation1987). In the study by You et al. (Citation2012), the cell size and density increased from the first week following an optic nerve injury in both sides of the visual cortex. We postulate that the increased glucose metabolism may be a consequence of an early cellular response in the hemisphere affected by cON, since our 5-week experimental period after cON corresponds to the relatively early phase in the study by You et al. (Citation2012).
Several animal studies about reorganization or compensatory effects within the cerebral cortex have been reported (Pawela et al. Citation2010; Hua et al. Citation2012). Regarding the visual cortex, a clinical study demonstrated that upon damage of the ipsilateral side, an increase in the glucose metabolism of the contralateral side relative to the extent of the damage could be observed (Batista et al. Citation2007). Altogether, we suggest that an increased glucose metabolism in the contralateral (left) visual cortex is associated with a remote interhemispheric cortical reorganization. Our own results from further correlation analyses have demonstrated that a cross-hemispheric association could be found.
There are a few limitations to our study. First, the analysis of enzymes was not performed serially as PET image acquisition. Second, the visual system in rodents is different from that in humans. Based on the anatomy of rodents, the eyes are located far more laterally in the head. Most optic fibers decussate at the chiasm and project to the contralateral cerebrum subsequently (Nieuwenhuys et al. Citation2014). This has the advantage of being able to better observe the effect of unilateral optic neuropathy, although it differs from the primate visual system. A considerable portion of the optic nerve fibers are not decussated, and there are parts responsible for binocular activity in the cerebral cortex in humans and most primates. Therefore, it is difficult to translate these results to humans, and further clinical research is needed.
Conclusion
Brain glucose metabolism was found to increase in both sides of the visual cortex over time in the optic neuropathy rat models, and these changes were more prominent in the visual cortex corresponding to the cON. In contrast, the changes observed in the thalamus were symmetrical. Further investigations are necessary to determine long-term effects, to better understand whether such effects are anterograde or retrograde in nature.
Compliance with Ethical Standards
I verify that an appropriate institutional animal care and use committee (IACUC) and ethics committee approval has been obtained for the use of human or animal subjects.
Acknowledgements
The authors are very grateful to Jeong-Hun Kim for his devotional support in all stages of the research.
Disclosure statement
No potential conflict of interest was reported by the author(s).
Data availability statement
Data and materials supporting the results or analyses presented in this study freely available. The name of dataset is ‘TONP_Dataset.xlsx’ which is assessable via https://osf.io/eturg.
Additional information
Funding
References
- Batista CE, Juhasz C, Muzik O, Chugani DC, Chugani HT. 2007. Increased visual cortex glucose metabolism contralateral to angioma in children with Sturge-Weber syndrome. Dev Med Child Neurol. 49:567–573. Epub 2007/07/20.
- Bellusci C, Savini G, Carbonelli M, Carelli V, Sadun AA, Barboni P. 2008. Retinal nerve fiber layer thickness in nonarteritic anterior ischemic optic neuropathy: OCT characterization of the acute and resolving phases. Graefe's Arch Clin Exp Ophthalmol. 246:641–647.
- Duvdevani R, Rosner M, Belkin M, Sautter J, Sabel BA, Schwartz M. 1990. Graded crush of the rat optic nerve as a brain injury model: combining electrophysiological and behavioral outcome. Restor Neurol Neurosci. 2(2):31–38.
- Gispert JD, Figueiras FP, Vengeliene V, Herance JR, Rojas S, Spanagel R. 2017. Changes in cerebral [(18)F]-FDG uptake induced by acute alcohol administration in a rat model of alcoholism. Behav Brain Res. 327:29–33. Epub 2017/03/30.
- Hua XY, Li ZY, Xu WD, Zheng MX, Xu JG, Gu YD. 2012. Interhemispheric functional reorganization after cross nerve transfer: via cortical or subcortical connectivity? Brain Res. 1471:93–101. Epub 2012/07/10.
- Kiyosawa M, Bosley TM, Kushner M, Jamieson D, Alavi A, Savino PJ, Sergott RC, Reivich M. 1989. Positron emission tomography to study the effect of eye closure and optic nerve damage on human cerebral glucose metabolism. Am J Ophthalmol. 108:147–152. Epub 1989/08/15.
- Levin LA, Louhab A. 1996. Apoptosis of retinal ganglion cells in anterior ischemic optic neuropathy. Arch Ophthalmol. 114:488–491.
- Liang S, Jiang X, Zhang Q, Duan S, Zhang T, Huang Q, Sun X, Liu H, Dong J, Liu W, et al. 2018. Abnormal metabolic connectivity in rats at the acute stage of Ischemic stroke. Neurosci Bull. 34:715–724. Epub 2018/08/08.
- Lu Y, Ren J, Cui S, Chen J, Huang Y, Tang C, Shan B, Nie B, Xinsheng L. 2016. Cerebral glucose metabolism assessment in rat models of Alzheimer's disease: an 18F-FDG-PET study. Am J Alzheimer's Dis Other Dement. 31:333–340. Epub 2015/12/04.
- Medeiros FA, Moura FC, Vessani RM, Susanna R Jr. 2003. Axonal loss after traumatic optic neuropathy documented by optical coherence tomography. Am J Ophthalmol. 135:406–408.
- Mergenthaler P, Lindauer U, Dienel GA, Meisel A. 2013. Sugar for the brain: the role of glucose in physiological and pathological brain function. Trends Neurosci. 36:587–597. Epub 2013/08/24.
- Nieuwenhuys R, Hans J, Nicholson C. 2014. The central nervous system of vertebrates. Springer.
- Park TY, Nishida KS, Wilson CM, Jaiswal S, Scott J, Hoy AR, Selwyn RG, Dardzinski BJ, Choi KH. 2017. Effects of isoflurane anesthesia and intravenous morphine self-administration on regional glucose metabolism ([(18) F]FDG-PET) of male Sprague-Dawley rats. Eur J Neurosci. 45:922–931. Epub 2017/02/15.
- Pawela CP, Biswal BB, Hudetz AG, Li R, Jones SR, Cho YR, Matloub HS, Hyde JS. 2010. Interhemispheric neuroplasticity following limb deafferentation detected by resting-state functional connectivity magnetic resonance imaging (fcMRI) and functional magnetic resonance imaging (fMRI). NeuroImage. 49:2467–2478. Epub 2009/10/03.
- Peirson SN, Brown LA, Pothecary CA, Benson LA, Fisk AS. 2018. Light and the laboratory mouse. J Neurosci Methods. 300:26–36. 2018/04/15.
- Radford KD, Park TY, Jaiswal S, Pan H, Knutsen A, Zhang M, Driscoll M, Osborne-Smith LA, Dardzinski BJ, Choi KH. 2018. Enhanced fear memories and brain glucose metabolism ((18)F-FDG-PET) following sub-anesthetic intravenous ketamine infusion in Sprague-Dawley rats. Transl Psychiatry. 8:263. Epub 2018/12/07.
- Schiffer WK, Mirrione MM, Biegon A, Alexoff DL, Patel V, Dewey SL. 2006. Serial microPET measures of the metabolic reaction to a microdialysis probe implant. J Neurosci Methods. 155:272–284. Epub 2006/03/08.
- Suzuki Y, Kiyosawa M, Oda K, Ishiwata K, Ishii K. 2016. Improvement of glucose metabolism in the visual cortex accompanies visual field recovery in a patient with Hemianopia. Tohoku J Exp Med. 238:267–271. Epub 2016/04/05.
- Tan G, Huang X, Ye L, Wu AH, He LX, Zhong YL, Jiang N, Zhou FQ, Shao Y. 2016. Altered spontaneous brain activity patterns in patients with unilateral acute open globe injury using amplitude of low-frequency fluctuation: a functional magnetic resonance imaging study. Neuropsychiatr Dis Treat. 12:2015–2020.
- Thuen M, Singstad TE, Pedersen TB, Haraldseth O, Berry M, Sandvig A, Brekken C. 2005. Manganese-enhanced MRI of the optic visual pathway and optic nerve injury in adult rats. J Magn Reson Imaging. 22:492–500.
- Vessani R, Cunha L, Monteiro M. 2007. Progressive macular thinning after indirect traumatic optic neuropathy documented by optical coherence tomography. Br J Ophthalmol. 91:697–698.
- Weinberger DR. 1987. Implications of normal brain development for the pathogenesis of schizophrenia. Arch Gen Psychiatry. 44:660–669. Epub 1987/07/01.
- Welch A, Mingarelli M, Riedel G, Platt B. 2013. Mapping changes in mouse brain metabolism with PET/CT. J Nucl Med. 54:1946–1953. Epub 2013/09/07.
- Yoles E, Schwartz M. 1998. Degeneration of spared axons following partial white matter lesion: implications for optic nerve neuropathies. Exp Neurol. 153:1–7.
- You Y, Gupta VK, Graham SL, Klistorner A. 2012. Anterograde degeneration along the visual pathway after optic nerve injury. PloS One. 7:e52061.
- Yucel Y, Gupta N. 2008. Glaucoma of the brain: a disease model for the study of transsynaptic neural degeneration. Prog Brain Res. 173:465–478.
- Yucel YH, Zhang Q, Weinreb RN, Kaufman PL, Gupta N. 2003. Effects of retinal ganglion cell loss on magno-, parvo-, koniocellular pathways in the lateral geniculate nucleus and visual cortex in glaucoma. Prog Retinal Eye Res. 22:465–481.