
Abstract
Breast cancer (BC) is a common malignancy in women. We aimed to investigate the role of circular RNA_0000518 (circRNA_0000518) in BC progression and its associated mechanism. Real-time quantitative polymerase chain reaction (RT-qPCR) and Western blot assay were utilized to measure RNA and protein expression. Cell proliferation was assessed by 3-(4,5-Dimethylthiazol-2-yl)-2,5-diphenyltetrazolium bromide (MTT) assay and colony formation assay. Transwell assays were conducted to analyze cell motility. Intermolecular interaction was verified via dual-luciferase reporter assay and RNA-pull down assay. Circ_0000518 expression was up-regulated in BC tissues and cell lines. Circ_0000518 interference suppressed the proliferation, migration, invasion and glycolytic metabolism and promoted the apoptosis of BC cells. Circ_0000518 acted as a molecular sponge for microRNA-1258 (miR-1258), and circ_0000518 interference-mediated effects in BC cells were largely alleviated by the addition of anti-miR-1258. MiR-1258 interacted with the 3′ untranslated region (3′UTR) of zinc finger E-box binding homeobox 1 (ZEB1) in BC cells, and miR-1258 suppressed the malignant behaviors of BC cells partly through down-regulating ZEB1. Circ_0000518 interference significantly suppressed the growth of xenograft tumors in vivo. Circ_0000518/miR-1258/ZEB1 signaling cascade was identified in this study for the first time. Circ_0000518 contributed to BC progression by binding to miR-1258 to induce ZEB1 expression.
KEYWORDS:
Introduction
Breast cancer (BC) is a hormone-dependent malignancy that frequently diagnosed in women (Azim and Partridge Citation2014; Harbeck and Gnant Citation2017). Many etiological factors are responsible for BC tumorigenesis, including age, bibulosity and smoking. Although continuous advancement in the diagnosis and treatment of BC has been made in recent years, the mortality of BC patients remains high (MacNeill and Karakatsanis Citation2017; Goldvaser and Amir Citation2019). Therefore, exploring the pathogenesis behind BC initiation and progression and identifying novel effective targets are essential for BC treatment.
A total of 80% circular RNAs (circRNAs) distribute in the cytoplasmic fraction, thus endow them the potential to be microRNA (miRNA) sponges (Panda Citation2018). For example, circ_0071589 contributed to colorectal cancer development through enhancing EZH2 expression via sponging miR-600 (Yong et al. Citation2018). Circ_0000518 is the most up-regulated circRNA in BC tissues on the basis of GSE101123 dataset. Additionally, Jiang et al. found that circ_0000518 was highly expressed in BC tissues and cell lines, and circ_0000518 contributed to BC progression via miR-326-mediated regulation of FGFR1 (Jiang et al. Citation2020). However, the working mechanism behind the oncogenic role of circ_0000518 in BC has never been fully illustrated.
MiRNAs regulate cellular phenotypes through suppressing the translational process of messenger RNAs (mRNAs) or degrading them (Hata and Lieberman Citation2015). MiR-1258 functioned as a tumor suppressor in liver cancer (Hu et al. Citation2016), non-small cell lung cancer (Jiang, Wei, et al. Citation2018), cervical cancer (Peng et al. Citation2020) and BC (Zhao Citation2020). For example, Zhao et al. demonstrated that miR-1258 hampered growth and induced apoptosis in BC cells by targeting E2F1 (Zhao Citation2020). MiR-1258 was predicted as a candidate target of circ_0000518 by bioinformatic database. This study tested the interaction between miR-1258 and circ_0000518 and analyzed their functional association in regulating BC progression.
As predicted by bioinformatic database, zinc finger E-box binding homeobox 1 (ZEB1) was predicted to be a candidate target of miR-1258. ZEB1 is a member of ZEB transcription factor family, and it promotes the process of epithelial–mesenchymal transition (EMT) and the development of many malignancies (Zhang et al. Citation2015). For instance, Jiang et al. claimed that miR-203 enhanced the radio-sensitivity in gastric cancer cells via suppressing ZEB1 (Jiang et al. Citation2019). Fang et al. claimed that TTN-AS1 aggravated BC progression through up-regulating ZEB1 via sponging miR-139-5p (Fang et al. Citation2020). Liang et al. found that miR-1236-3p hampered BC development through inhibiting ZEB1 (Liang et al. Citation2019). However, the interaction and functional association between ZEB1 and miR-1258 in BC cells have never been disclosed.
The expression pattern and function of circ_0000518 were first analyzed in BC cells. Subsequently, the downstream targets of circ_0000518 were predicted by bioinformatic database, and their functional association was explored via rescue experiments.
Materials and methods
Bioinformatic analysis
The expression profile of circ_0000518 in BC tissues (n = 8) and normal tissues (n = 3) was downloaded from the dataset of GSE101123 (https://www.ncbi.nlm.nih.gov/geo/query/acc.cgi?acc=GSE101123), and differential analysis was performed with |log2FoldChange| > 2 and P-value < 0.05 as the threshold value. The targets of circ_0000518 and miR-1258 were predicted by Circinteractome database (https://circinteractome.irp.nia.nih.gov/) and miRmap database (http://mirnamap.mbc.nctu.edu.tw/), respectively.
Ethics statement
All protocols in clinical study had gotten permission by the ethics committee of Huangshi Central Hospital. All subjects involved in clinical study had signed written informed consents prior to surgery. Animal study was conducted in accordance with the principles of the Institutional Animal Care and Use Committee of Huangshi Central Hospital.
Tissue samples
A total of 40 pairs of BC tissues and adjacent normal tissues were acquired from BC patients at Huangshi Central Hospital. Adjacent normal tissues were used as control samples.
Cell lines
Human BC cell lines (MDA-MB-468, MDA-MB-231, MCF-7 and MDA-MB-453) and human immortalized mammary epithelial cell line MCF-10A were all obtained from BeNa Culture Collection (Beijing, China). BC cell lines were cultured with Roswell Park Memorial Institute-1640 medium (Gibco, Grand Island, NY, USA, Cat. No. 12633012) plus 10% fetal bovine serum (FBS; Gibco, Cat. No. 12483020), 1% penicillin and streptomycin mixture (Gibco, Cat. No. 15140163). MCF-10A cell line was cultivated with M-171 medium (Invitrogen, Carlsbad, CA, USA, Cat. No. M171500) supplemented with breast epithelial growth factor (Invitrogen, Cat. No. PHG0311). All cell lines were cultured in a humidified incubator at 37°C with 5% CO2.
Real-time quantitative polymerase chain reaction (RT-qPCR)
Total RNA was isolated using Trizol reagent (Invitrogen, Cat. No. 15596018). Reverse transcription was conducted using the Bio-Rad iScript kit (Bio-Rad, Hercules, CA, USA; for circ_0000518, ribonuclease P RNA component H1 (RPPH1) and ZEB1, Cat. No. 1708890) and TaqMan reverse transcription kit (Applied Biosystems, Rotkreuz, Switzerland; for miR-1258, Cat. No. 4366596). The levels of circ_0000518, RPPH1, miR-1258 and ZEB1 were analyzed on the 7500 real-time PCR system with the TaqMan gene expression assay kit (Applied Biosystems, Cat. No. 4427975). The expression of circ_0000518, RPPH1 and ZEB1 was analyzed with glyceraldehyde-3-phosphate dehydrogenase (GAPDH) as housekeeping gene, while U6 acted as housekeeping gene for miR-1258. The fold change of these molecules was calculated using the 2-ΔΔCt formula. All primers were listed in Table .
Table 1. Primer sequences used in RT-qPCR assay.
Cyclization validation and subcellular fractionation
To assess if circ_0000518 possessed 3′poly(A) tail, Oligo(dT)18 primers were used, and its linear form RPPH1 was used as the control. To test if circ_0000518 possessed circular structure, we assessed the resistance of circ_0000518 to RNase R, and its linear form RPPH1 was used as the control. Cytoplasmic/nuclear RNA isolation was performed using PARISTM Kit Protein and RNA Isolation system (Thermo Fisher Scientific, Waltham, MA, USA, Cat. No. AM1921).
Cell transfection
Circ_0000518 small interference RNAs (si-circ_0000518#1 and si-circ_0000518#2) and their corresponding negative control (si-NC), short hairpin RNA against circ_0000518 (sh-circ_0000518), sh-NC, miR-1258, miR-NC, miR-1258 inhibitor (anti-miR-1258), anti-miR-NC, ZEB1 recombinant plasmid (pcDNA-ZEB1) and negative control of pcDNA (pcDNA-NC) were acquired from Sangon Biotech (Beijing, China) and GenePharma (Shanghai, China). The forward oligo of sh-circ_0000518 was 5′-CCGGGGGCTCCGCGCGAGCTCATCACTCGAGTGATGAGCTCGCGCGGAGCCCTTTTTG-3′, and the reverse oligo of sh-circ_0000518 was 5′-AATTCAAAAAGGGCTCCGCGCGAGCTCATCACTCGAGTGATGAGCTCGCGCGGAGCCC-3′. BC cells were seeded into 6-well plates and cultivated to reach the confluence of 80%, and then transfection was conducted for 48 h with Lipofectamine 3000 reagent (Invitrogen, Cat. No. L3000015).
3-(4,5-Dimethylthiazol-2-yl)-2,5-diphenyltetrazolium Bromide (MTT) assay
After fixed time interval, BC cells (in quintuplicate) were incubated with 20 μL MTT reagent (Sigma, St. Louis, MO, USA, Cat. No. CT02) for 4 h. The medium was discarded after 4-h incubation. A total of 150 μL dimethyl sulfoxide (DMSO; Sangon Biotech, Cat. No. A100231) was added after discarding the culture supernatant to dissolve the formazan crystals. The absorbance at 570 nm was determined.
Colony formation assay
BC cells were plated in 6-well cell culture plates at low density with the final volume of 2 mL. Culture media was replaced every 3 d. After 14-d incubation, cells were immobilized with 4% paraformaldehyde (Sangon Biotech, Cat. No. E672002) followed by staining using crystal violet (Sangon Biotech, Cat. No. A100528). The colony cell numbers were then counted.
Flow cytometry
Transfected BC cells were cultured for 72 h and then harvested through centrifuging at 100 ×g for 3 min. After washing using phosphate buffer saline (PBS) buffer (Sangon Biotech, Cat. No. E607008), cells were dyed with Annexin V-fluorescein isothiocyanate (Annexin V-FITC; BD Biosciences, San Jose, CA, USA, Cat. No. 550911) and propidium iodide (PI; BD Biosciences, Cat. No. 550911) and then analyzed by flow cytometer (BD Biosciences). BC cells with FITC+ and PI+/- were defined as apoptotic cells.
Transwell assays
BC cells were applied in transwell chambers pre-coated with Matrigel (BD Biosciences; in transwell invasion assay) or not (in transwell migration assay). 100 μL of culture medium without serum was added into the upper chambers, while 600 μL culture medium added with 10% FBS (Gibco) was added into the bottom chambers. The chambers were removed after 24-h incubation. Penetrating BC cells were immobilized with ethanol (Sangon Biotech) followed by staining with crystal violet (Sangon Biotech). The number of migrated or invaded BC cells in five random fields at the magnification of 100 was counted.
Analysis of glycolytic rate
After transfection for 48 h, culture medium was collected. Cell debris was removed after centrifugation. The production of lactate and the level of glucose in culture medium were determined using Lactate Assay Kit and Glucose Assay Kit (BioVision, Milpitas, CA, USA, Cat. No. K607-100 and K606-100), respectively.
Western blot assay
The collected BC cells were homogenized and cell lysates were obtained using Radio-Immunoprecipitation Assay (RIPA) buffer (Sangon Biotech, Cat. No. C500007). Protein samples in loading buffer were loaded onto the 10% sodium dodecyl sulfate polyacrylamide gel electrophoresis (SDS-PAGE) gel. After complete separation, proteins were blotted onto the polyvinylidene fluoride (PVDF) membrane (Bio-Rad). In the blocking step, 5% skimmed milk was used to block the membrane for 1 h. After rinsing using PBS buffer (Sangon Biotech), the membrane was incubated with primary antibodies overnight. The horseradish peroxidase (HRP)-conjugated polyclonal antibody (Abcam, Cambridge, MA, USA) was then incubated with the membrane for 2 h. Immuno-reactive protein bands were visualized on the radiographic films using the enhanced chemiluminescence kit (Pierce Biotechnology, Waltham, MA, USA, Cat. No. 32106). Primary antibodies, including anti-hexokinase 2 (anti-HK2; ab209847), anti-pyruvate kinase M 2 (anti-PKM2; ab137852), anti-ZEB1 (ab203829) and anti-β-actin (ab8226), were all purchased from Abcam.
Dual-luciferase reporter assay
Luciferase vectors (psiCHECK2; Promega, Madison, WI, USA), including the wild-type (WT) and mutant type (MUT) fragments of circ_0000518 or ZEB1 3′ untranslated region (3′UTR), were co-transfected with miR-NC or miR-1258 into BC cells. After transfection for 48 h, luciferase activities were examined using the Dual-luciferase assay kit (Promega, Cat. No. E1910). The relative ratio of Firefly luciferase activity/Renilla luciferase activity was analyzed.
RNA-pull down assay
The wild-type and mutant type of miR-1258 were biotinylated to obtain Bio-miR-1258-WT and Bio-miR-1258-MUT. Bio-miR-NC was used as the control. Cell lysate was incubated with 100 pmol biotinylated RNA. 100 μL streptavidin agarose beads (Invitrogen) were then added to incubate for 1 h. Beads were then washed, and the expression of circ_0000518 was measured by RT-qPCR.
Tumor xenograft experiment
BALB/c female nude mice were acquired from Vital River Laboratory Animal Technology (Beijing, China), and these nude mice were divided into two groups (n = 6). We established MCF-7 cell line stably transfected with sh-NC or sh-circ_0000518. MCF-7 cells (3 × 10⁶/0.2 mL PBS) were injected into the flank of the mice. After injection for 10 d, tumor volume was measured every 3 d as volume = length × width2 ×0.5. After injection for 28 d, mice were euthanized and the tumors were resected. The weight of tumors was recorded. The expression of circ_0000518, miR-1258 and ZEB1 mRNA and protein was measured by RT-qPCR or Western blot assay.
Statistical analysis
All data from three independent experiments were processed by GraphPad Prism 7.0 software. The statistical results were represented as mean ± standard deviation (SD). Difference in two groups was analyzed by Student’s t-test, and difference in multiple groups was assessed by one-way analysis of variance (ANOVA) followed by Tukey’s test. Linear correlation was evaluated by Pearson correlation coefficient. P < 0.05 was considered as statistically significant.
Results
Circ_0000518 is highly expressed in BC tissues and cell lines
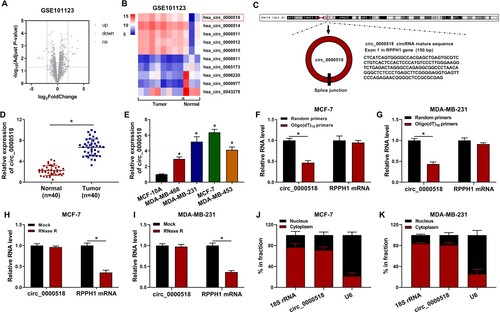
We analyzed the expression profile of circRNAs in BC tissues (n = 8) and normal tissues (n = 3) in GSE101123 dataset. A total of 19 circRNAs were found to be dysregulated in BC tissues with |log2FoldChange| > 2 and P-value < 0.05 as the threshold value. Among them, 12 circRNAs were up-regulated whereas 7 circRNAs were down-regulated in BC tissues (Figure (A)). The five most up-regulated and down-regulated circRNAs in BC tissues (n = 8) than that in adjacent normal tissues (n = 3) were shown in the heatmap in Figure (B). Among these circRNAs, circ_0000518 was the most up-regulated circRNA in BC tissues (Figure (B)). Therefore, we focused on the role of circ_0000518 in BC progression. Circ_0000518 was derived from the back-splicing of exon 1 in RPPH1 gene, and its genomic location, length and structural characteristics were shown in Figure (C). To confirm the expression pattern of circ_0000518 in BC, we analyzed its expression in 40 pairs of BC tissues and adjacent normal tissues. Circ_0000518 was significantly up-regulated in BC tissues in comparison with that in adjacent normal tissues (Figure (D)). Also, compared with human normal mammary cell line MCF-10A, circ_0000518 was significantly up-regulated in four BC cell lines (Figure (E)). To test if circ_0000518 was a circular transcript, Oligo(dT)18 primers were used to analyze if circ_0000518 had the 3′ ploy(A) tail. As shown in Figure (F,G), RPPH1 mRNA level was unaffected when using Random primers or Oligo(dT)18 primers, whereas circ_0000518 expression was significantly reduced when using Oligo(dT)18 primers compared with that in Random primers group. Furthermore, we tested the stability of circ_0000518 using exonuclease RNase R, and its linear form RPPH1 was used as control. The results revealed that circ_0000518 was resistant to RNase R digestion, whereas RPPH1 mRNA level was notably reduced with RNase digestion (Figure (H,I)). Before analyzing the biological function of circ_0000518, we also explored the subcellular distribution of circ_0000518. The results uncovered that circ_0000518 mainly located in the cytoplasmic fraction of BC cells (Figure (J,K)), which endowed it the potential to serve as miRNA sponge. Taken together, circ_0000518 expression was notably up-regulated in BC tissues and cell lines.
Figure 1. Circ_0000518 is highly expressed in BC tissues and cell lines. (A) Volcano plots showed the differentially expressed circRNAs in BC samples (n = 8) and adjacent normal samples (n = 3). Red dots indicated the down-regulated circRNAs in BC tissues while the up-regulated circRNAs were shown in green dots. Differentially expressed circRNAs were screened out with |log2FoldChange| > 2 and P-value < 0.05 as the threshold value. GSE101123 was downloaded from the GEO database. (B) Heat map showed the top five up-regulated and down-regulated circRNAs in BC tissues (n = 8) compared with that in adjacent normal tissues (n = 3). (C) Circ_0000518 was derived the cyclization of exon 1 in RPPH1 gene, and its basic information was shown. (D) The expression of circ_0000518 was determined in 40 pairs of BC tissues and adjacent normal tissues via RT-qPCR. (E) The level of circ_0000518 was examined in MCF-10A and four BC cell lines by RT-qPCR. (F-I) The stabilities of circ_0000518 and RPPH1 mRNA were analyzed through using Oligo(dT)18 primers and RNase R. (J and K) The subcellular localization of circ_0000518 was assessed, and U6 and 18S rRNA were used as nuclear marker and cytoplasmic marker, respectively. *P < 0.05.
Circ_0000518 silencing suppresses the malignant phenotypes of BC cells
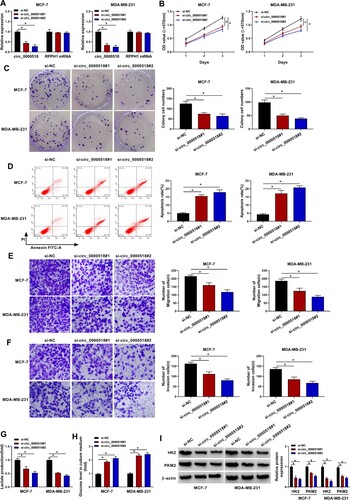
Two specific siRNAs of circ_0000518 (si-circ_0000518#1 and si-circ_0000518#2) were designed to target the back-splicing sites of circ_0000518 to specifically silence circ_0000518 to perform loss-of-function experiments. As shown in Figure (A) and Supplementary Figure 1A, high silencing efficiencies of si-circ_0000518#1 and si-circ_0000518#2 were verified via RT-qPCR. Meanwhile, the expression of RPPH1 was unchanged with the transfection of si-circ_0000518#1 or si-circ_0000518#2 (Figure (A) and Supplementary Figure 1A), suggesting that these two siRNAs were specific for circ_0000518. After silencing circ_0000518, cell proliferation ability was significantly suppressed (Figure (B) and Supplementary Figure 1B). The colony cell numbers were also reduced with the interference of circ_0000518 (Figure (C) and Supplementary Figure 1C), which further demonstrated that circ_0000518 silencing restrained the proliferation of BC cells. With the silencing of circ_0000518, cell apoptosis was significantly triggered (Figure (D) and Supplementary Figure 1D). With the silencing of circ_0000518, the numbers of migration and invasion BC cells were significantly reduced (Figure (E,F), Supplementary Figure 1E and 1F), suggesting that circ_0000518 silencing inhibited the migration and invasion abilities of BC cells. The production of lactate was notably decreased after silencing circ_0000518, whereas circ_0000518 interference notably increased the level of glucose in the culture medium (Figure (G,H), Supplementary Figure 1G and 1H), suggesting that circ_0000518 silencing suppressed glycolytic metabolism of BC cells. To further confirm the influence of circ_0000518 interference in cellular glycolytic metabolism, we measured the expression of HK2 and PKM2 in circ_0000518-silenced BC cells. Circ_0000518 silencing significantly reduced the expression of HK2 and PKM2 (Figure (I) and Supplementary Figure 1I), which further suggested that circ_0000518 silencing suppressed the glycolysis of BC cells. Taken together, circ_0000518 silencing suppressed the proliferation, migration, invasion and glycolysis and promoted the apoptosis of BC cells.
Figure 2. Circ_0000518 silencing suppresses the malignant phenotypes of BC cells. (A-I) MCF-7 and MDA-MB-231 cells were transfected with si-circ_0000518#1, si-circ_0000518#2 or si-NC. (A) The expression of circ_0000518 and RPPH1 mRNA was examined via RT-qPCR to assess the specificity of the two siRNAs. (B) MTT assay was performed to evaluate cell proliferation ability of BC cells. (C) Colony formation assay was conducted to analyze colony cell numbers after two-week incubation. (D) Flow cytometry was performed to analyze cell apoptosis rate. The apoptosis rate represented the percentages of BC cells with FITC+ and PI+/-. (E and F) Transwell assays were conducted to analyze the migration and invasion abilities of BC cells. (G and H) The production of lactate and the level of glucose in culture supernatant were assessed to analyze cell glycolytic rate. (I) Western blot assay was used to measure the protein expression of HK2 and PKM2 in BC cells. *P < 0.05.
Circ_0000518 acts as a molecular sponge for miR-1258
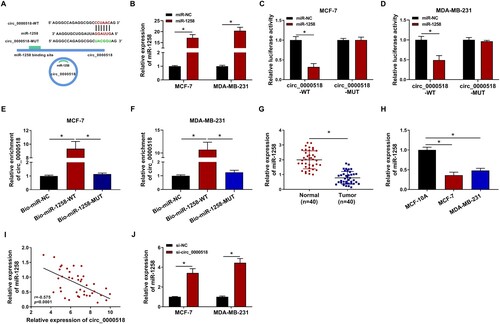
CircRNAs could regulate cell phenotypes through serving as molecular sponges for miRNAs (Panda Citation2018). MiR-1258 was predicted to be a target of circ_0000518 via Circinteractome software (Figure (A)). High overexpression efficiency of miR-1258 mimics was confirmed via RT-qPCR assay (Figure (B)). MiR-1258 transfection significantly reduced the activity of circ_0000518-WT luciferase reporter plasmid relative to circ_0000518-MUT luciferase reporter plasmid (Figure (C,D)), demonstrating that miR-1258 was a target of circ_0000518 in BC cells. RNA-pull down assay was conducted to further confirm the target relation between circ_0000518 and miR-1258. As shown in Figure (E,F), circ_0000518 was enriched when using biotinylated wild-type miR-1258 (Bio-miR-1258-WT) compared with Bio-miR-NC group and Bio-miR-1258-MUT group, suggesting that there was spatial interaction between circ_0000518 and miR-1258. MiR-1258 expression was prominently reduced in BC tissues and cell lines compared with adjacent normal tissues and MCF-10A cell line (Figure (G,H)). Given the opposite expression tendency of miR-1258 and circ_0000518 in BC tissues and cell lines, we analyzed the linear correlation between miR-1258 and circ_0000518. There was a negative linear correlation between the expression of miR-1258 and circ_0000518 in BC tissues (Figure (I)). MiR-1258 expression was elevated after silencing circ_0000518 using si-circ_0000518 (si-circ_0000518#2 was written as si-circ_0000518 in the following experiments) (Figure (J)), suggesting the negative regulatory relationship between miR-1258 and circ_0000518. Taken together, miR-1258 bound to circ_0000518 in BC cells.
Figure 3. Circ_0000518 acts as a molecular sponge for miR-1258. (A) Prediction of the binding sites of miR-1258 in circ_0000518 by bioinformatic software Circinteractome. (B) The expression of miR-1258 in MCF-7 and MDA-MB-231 cells transfected with miR-NC or miR-1258 via RT-qPCR. (C and D) Dual-luciferase reporter assay was conducted to confirm the interaction between miR-1258 and circ_0000518 in BC cells. (E and F) RNA-pull down assay was performed to verify the target relationship between miR-1258 and circ_0000518. (G) The expression of miR-1258 in BC tissues (n = 40) and adjacent normal tissues (n = 40) was determined by RT-qPCR. (H) The level of miR-1258 in MCF-7, MDA-MB-231 and human normal mammary cell line MCF-10A was measured by RT-qPCR. (I) Linear correlation between miR-1258 and circ_0000518 was analyzed by Pearson correlation coefficient. (J) The level of miR-1258 was determined in MCF-7 and MDA-MB-231 cells transfected with si-NC or si-circ_0000518 by RT-qPCR. *P < 0.05.
MiR-1258 silencing partly overturns circ_0000518 interference-mediated effects in BC cells
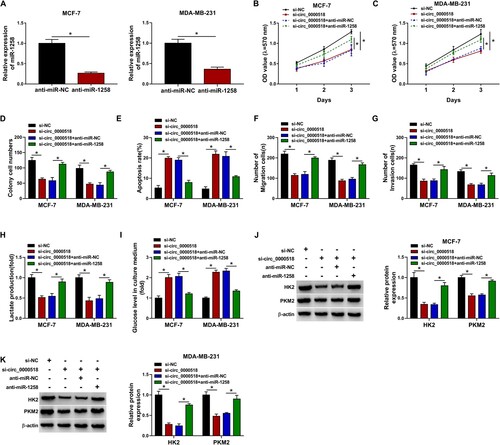
The interference efficiency of anti-miR-1258 was high as verified by RT-qPCR assay (Figure (A) and Supplementary Figure 2A). Circ_0000518 silencing-mediated inhibitory effect in the proliferation ability of BC cells was partly overturned by the silencing of miR-1258 as conformed by MTT assay and colony formation assay (Figure (B–D), Supplementary Figure 2B and 2C). Circ_0000518 interference-triggered cell apoptosis was also counteracted by the addition of anti-miR-1258 (Figure (E) and Supplementary Figure 2D). The migration and invasion abilities of BC cells were suppressed by the silencing of circ_0000518, and miR-1258 silencing rescued the motility of BC cells (Figure (F,G), Supplementary Figure 2E and 2F). Circ_0000518 silencing-mediated effects in lactate production and the level of glucose in culture medium were both largely alleviated by the introduction of anti-miR-1258 (Figure (H,I), Supplementary Figure 2G and 2H). Circ_0000518 silencing reduced the expression of HK2 and PKM2, and the expression of both proteins was partly recovered in si-circ_0000518 and anti-miR-1258 co-transfected group (Figure (J,K), Supplementary Figure 2I). These findings together suggested that circ_0000518 silencing suppressed the malignant behaviors of BC cells partly through up-regulating miR-1258.
Figure 4. MiR-1258 silencing partly overturns circ_0000518 interference-mediated effects in BC cells. (A) The level of miR-1258 in MCF-7 and MDA-MB-231 cells transfected with anti-miR-NC or anti-miR-1258 was examined via RT-qPCR. (B-K) BC cells were transfected with si-NC, si-circ_0000518, si-circ_0000518 + anti-miR-NC or si-circ_0000518 + anti-miR-1258. (B-D) Cell proliferation ability was assessed by MTT assay and colony formation assay. (E) The apoptosis rate was analyzed by flow cytometry. (F and G) Transwell assays were conducted to measure the migration ability and invasion ability of BC cells. (H) The production of lactate was analyzed in transfected BC cells. (I) The level of glucose in the culture medium was assessed in four groups. (J and K) The protein expression of HK2 and PKM2 was measured by Western blot assay. *P < 0.05.
ZEB1 is a target of miR-1258 in BC cells
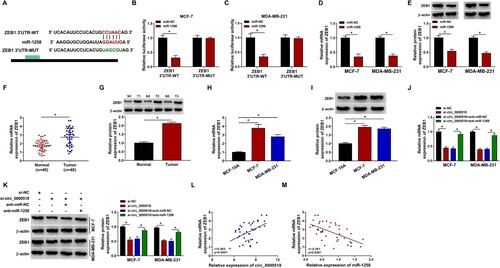
MiRNAs are involved in the regulation of cell phenotypes through inhibiting the translational process or degrading target mRNAs (Fabian et al. Citation2010). Bioinformatic analysis was conducted using miRmap database to explore the downstream targets of miR-1258. As mentioned in Figure (A), the 3′UTR of ZEB1 had the potential binding sites with miR-1258. Subsequently, dual-luciferase reporter assay was conducted to verify the interaction between miR-1258 and ZEB1. MiR-1258 overexpression significantly reduced the luciferase activity of ZEB1 3′UTR-WT luciferase reporter plasmid rather than ZEB1 3′UTR-MUT luciferase reporter plasmid (Figure (B,C)), suggesting that miR-1258 bound to 3′UTR of ZEB1 in BC cells. MiR-1258 overexpression significantly decreased the mRNA and protein expression of ZEB1 in BC cells (Figure (D,E)), demonstrating that there was negative regulatory relationship between miR-1258 and ZEB1 in BC cells. ZEB1 mRNA and protein levels were both up-regulated in BC tissue samples relative to adjacent normal tissue samples (Figure (F,G)). Compared with MCF-10A cell line, a significant up-regulation in ZEB1 mRNA and protein expression was observed in two BC cell lines (Figure (H,I)). Given the negative regulatory relationship between miR-1258 and circ_0000518 or ZEB1, we subsequently analyzed the regulatory relationship between circ_0000518 and ZEB1. As shown in Figure (J,K), circ_0000518 silencing reduced the expression of ZEB1 mRNA and protein, and the mRNA and protein expression of ZEB1 was largely recovered with the addition of anti-miR-1258 in BC cells, suggesting that circ_0000518 silencing reduced ZEB1 expression through up-regulating miR-1258. As expected, through conducting correlation analysis using Pearson correlation coefficient, we found that ZEB1 expression was positively correlated with circ_0000518 level and negatively correlated with miR-1258 expression (Figure (L,M)). Taken together, miR-1258 bound to the 3′UTR of ZEB1 in BC cells.
Figure 5. ZEB1 is a target of miR-1258 in BC cells. (A) The target relationship between miR-1258 and ZEB1 was predicted by miRmap database. (B and C) MCF-7 and MDA-MB-231 cells were transfected with luciferase plasmids and miR-NC or miR-1258, and luciferase activity was measured to assess if there existed target interaction between miR-1258 and ZEB1. (D and E) The influence of miR-1258 overexpression on ZEB1 level in BC cells was analyzed. The mRNA and protein expression of ZEB1 was examined in BC cells transfected with miR-NC or miR-1258. (F and G) The mRNA and protein levels of ZEB1 in BC tissues and adjacent normal tissues were measured by RT-qPCR and Western blot assay. (H and I) RT-qPCR and Western blot assay were implemented to examine the mRNA and protein expression of ZEB1. (J and K) BC cells were transfected with si-NC, si-circ_0000518, si-circ_0000518 + anti-miR-NC or si-circ_0000518 + anti-miR-1258. The mRNA and protein levels of ZEB1 in BC cells were measured by RT-qPCR and Western blot assay. (L and M) Pearson correlation coefficient was used to assess the linear correlation between ZEB1 and circ_0000518 or miR-1258. *P < 0.05.
MiR-1258 overexpression-induced influences in BC cells are partly alleviated by the introduction of ZEB1 overexpression plasmid
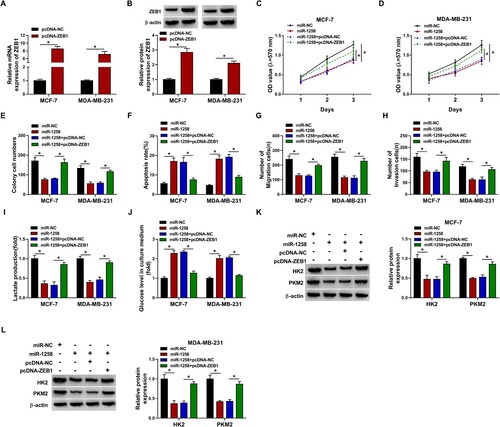
The transfection of pcDNA-ZEB1 notably increased the expression of ZEB1 mRNA and protein in BC cells (Figure (A,B), Supplementary Figure 3A and 3B). MiR-1258 overexpression suppressed the proliferation of BC cells, and the addition of ZEB1 plasmid rescued the proliferation ability of BC cells (Figure 6(C–E), Supplementary Figure 3C and 3D). The apoptosis rate was elevated with the overexpression of miR-1258, and ZEB1 accumulation suppressed miR-1258-induced apoptosis in BC cells (Figure (F) and Supplementary Figure 3E). The migration and invasion abilities were restrained with the overexpression of miR-1258, and the motility of BC cells was largely recovered in miR-1258 and pcDNA-ZEB1 co-transfected group (Figure (G) and 6H, Supplementary Figure 3F and 3G). MiR-1258 overexpression-mediated effects in the production of lactate and the consumption of glucose were both overturned by the addition of pcDNA-ZEB1 (Figure (I) and 6J, Supplementary Figure 3H and 3I). The expression of HK2 and PKM2 was down-regulated with the overexpression of miR-1258, and the co-transfection with pcDNA-ZEB1 largely recovered the levels of HK2 and PKM2 in BC cells (Figure (K,L), Supplementary Figure 3J). Taken together, miR-1258 overexpression suppressed BC progression partly through down-regulating ZEB1 in vitro.
Figure 6. MiR-1258 overexpression-induced influences in BC cells are partly alleviated by the introduction of ZEB1 overexpression plasmid. (A and B) The mRNA and protein expression of ZEB1 was measured in BC cells transfected with pcDNA-NC or pcDNA-ZEB1 by RT-qPCR and Western blot assay. (C and D) Cell proliferation ability was analyzed by MTT assay. (E) Colony formation assay was performed to measure the proliferation capacity of BC cells. (F) The apoptosis rate was analyzed using flow cytometry. (G) Cell migration ability was measured by transwell migration assay. (H) Cell invasion was assessed using transwell invasion assay. (I and J) The production of lactate and the level of glucose in culture medium were measured to evaluate cellular glycolytic rate. (K and L) The expression of HK2 and PKM2 in BC cells was analyzed via Western blot assay. *P < 0.05.
Circ_0000518 silencing suppresses BC progression in vivo
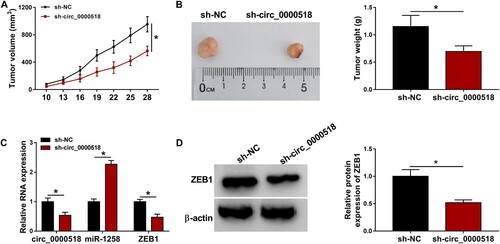
We established xenograft tumor model using MCF-7 cells stably expressing sh-circ_0000518 or sh-NC. As shown in Figure (A,B), circ_0000518 silencing suppressed xenograft tumor growth compared with that in sh-NC group. The expression of circ_0000518 and ZEB1 mRNA was notably reduced in tumor tissues in sh-circ_0000518 group relative to sh-NC group, whereas miR-1258 expression was significantly enhanced in sh-circ_0000518 group relative to sh-NC group (Figure (C)). The protein expression of ZEB1 was conspicuously decreased in sh-circ_0000518 group compared with that in sh-NC group (Figure (D)). These results suggested that circ_0000518 silencing suppressed tumor growth in vivo.
Figure 7. Circ_0000518 silencing suppresses BC progression in vivo. Xenograft tumor model was built using MCF-7 cells stably expressing sh-circ_0000518 or sh-NC. (A) Tumor volume was calculated every 3 d using the formula of width2 × length × 0.5, and tumor growth curve was then generated. (B) Tumors were resected and weighed after injection for 28 d. (C) RT-qPCR was applied to measure the expression of circ_0000518, miR-1258 and ZEB1 in resected tumor tissues. (D) Western blot assay was performed to analyze the protein level of ZEB1 in tumor tissues. *P < 0.05.
Discussion
BC is a common malignancy in women (Froes Brandao et al. Citation2016), and the mortality of BC patients is still high up to now (MacNeill and Karakatsanis Citation2017; Goldvaser and Amir Citation2019). Therefore, understanding the pathogenesis behind BC progression and identifying novel effective therapeutic targets are important for BC treatment. Increasing studies have pointed out that circRNAs functioned in cancer cells through targeting miRNAs/mRNAs axis (Kulcheski et al. Citation2016; Qu et al. Citation2018). For instance, circ_0058063 facilitated the development of bladder cancer through up-regulating CDK6 via sponging miR-145-5p (Sun et al. Citation2019). Here, the abnormal up-regulation of circ_0000518 in BC tissues in GSE101123 dataset attached our attention. Through comparing the expression of circ_0000518 in 40 pairs of BC tissues and adjacent normal tissues, we confirmed that circ_0000518 was highly expressed in BC tissues. Circ_0000518 silencing restrained cell proliferation, motility and glycolytic metabolism whereas induced cell apoptosis in BC cells, which demonstrated that circ_0000518 played an oncogenic role in BC cells.
CircRNAs are implicated in the regulation of cell behaviors through acting as miRNA sponges (Panda Citation2018). MiR-1258 was identified as a target of circ_0000518 for the first time in our study. MiR-1258 was identified as a tumor-suppressor molecule in multiple malignancies by former articles. For instance, miR-1258 silencing promoted liver cancer development through regulating CKS1B (Hu et al. Citation2016). Jiang et al. demonstrated that miR-1258 hampered the development of non-small cell lung cancer through modulating GRB2/Ras/Erk signaling (Jiang, Wei, et al. Citation2018). Peng et al. found that miR-1258 induced cell apoptosis in cervical cancer cells through modulating E2F1/P53 pathway (Peng et al. Citation2020). As for BC, Zhao et al. claimed that miR-1258 suppressed BC development via targeting E2F1 (Zhao Citation2020). Zhang et al. demonstrated that miR-1258 restrained the brain metastasis of breast cancer through regulating heparanase (Zhang et al. Citation2011). We found that miR-1258 was under-expressed in BC, and it was negatively regulated by circ_0000518 in BC cells. To test if circ_0000518 exhibited oncogenic role in BC cells through targeting miR-1258, we conducted rescue experiments. Since si-circ_0000518 transfection up-regulated miR-1258 expression, we transfected BC cells with si-circ_0000518 alone or together with anti-miR-1258 to perform rescue experiments. MiR-1258 knockdown largely attenuated circ_0000518 interference-induced effects in BC cells, suggesting that circ_0000518 functioned in BC cells partly through targeting miR-1258.
MiRNAs regulate cell biological processes through suppressing the translation or degrading target mRNAs (Fabian et al. Citation2010). ZEB1 is a transcription factor that functions as an important modulator of EMT (Caramel et al. Citation2018). ZEB1 was also found to promote the malignant phenotypes of BC cells. For example, ZEB1 accelerated the chemoresistance of ovarian cancer cells to cisplatin through inhibiting SLC3A2 (Cui et al. Citation2019). NEAT1 accelerated the proliferation and motility of BC cells through up-regulating ZEB1 via sponging miR-448 (Jiang, Zhou, et al. Citation2018). ZEB1 was identified to be a target of miR-1258 in BC cells for the first time in our study, and it was negatively modulated by miR-1258. ZEB1 expression was observed to be significantly up-regulated in BC. Given the negative regulatory relationship between miR-1258 and circ_0000518 or ZEB1, we subsequently explored the relationship between circ_0000518 and ZEB1 in BC cells. Through transfecting si-circ_0000518 alone or together with anti-miR-1258 into BC cells, we found that circ_0000518 elevated ZEB1 expression through acting as miR-1258 sponge in BC cells. We rescued the expression of ZEB1 through transfecting ZEB1 plasmid into miR-1258-overexpressed BC cells, and the results revealed that miR-1258 overexpression blocked the malignant progression of BC partly through suppressing ZEB1.
Finally, the in vivo role of circ_0000518 in BC tumor growth was explored through using xenograft tumor model. Circ_0000518 interference notably suppressed the growth of xenograft tumors in vivo.
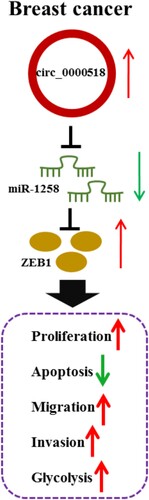
Collectively, our study found that circ_0000518 was a carcinogenic circRNA in BC, which accelerated the proliferation, migration, invasion, glycolytic metabolism and hampered the apoptosis of BC cells through mediating miR-1258/ZEB1 axis (Figure ). Circ_0000518/miR-1258/ZEB1 axis might be potential therapeutic target for BC treatment.
Figure 8. The diagram shows the role of circ_0000518/miR-1258/ZEB1 axis in BC progression.
Supplemental Material
Download Zip (5.4 MB)Disclosure statement
No potential conflict of interest was reported by the author(s).
Related Research Data
References
- Azim HA Jr, Partridge AH. 2014. Biology of breast cancer in young women. Breast Cancer Res. 16:427.
- Caramel J, Ligier M, Puisieux A. 2018. Pleiotropic roles for ZEB1 in cancer. Cancer Res. 78:30–35.
- Cui Y, Qin L, Tian D, Wang T, Fan L, Zhang P, Wang Z. 2019. ZEB1 promotes chemoresistance to cisplatin in ovarian cancer cells by suppressing SLC3A2. Chemotherapy. 63:262–271.
- Fabian MR, Sonenberg N, Filipowicz W. 2010. Regulation of mRNA translation and stability by microRNAs. Annu Rev Biochem. 79:351–379.
- Fang J, Huang C, Ke J, et al. 2020. lncRNA TTN-AS1 facilitates proliferation, invasion, and epithelial-mesenchymal transition of breast cancer cells by regulating miR-139-5p/ZEB1 axis. J Cell Biochem.
- Froes Brandao D, Strasser-Weippl K, Goss PE. 2016. Prolactin and breast cancer: the need to avoid undertreatment of serious psychiatric illnesses in breast cancer patients: a review. Cancer. 122:184–188.
- Goldvaser H, Amir E. 2019. Role of bisphosphonates in breast cancer therapy. Curr Treat Options Oncol. 20:26.
- Harbeck N, Gnant M. 2017. Breast cancer. The Lancet. 389:1134–1150.
- Hata A, Lieberman J. 2015. Dysregulation of microRNA biogenesis and gene silencing in cancer. Sci Signal. 8:re3.
- Hu M, Wang M, Lu H, Wang X, Fang X, Wang J, Ma C, Chen X, Xia H. 2016. Loss of miR-1258 contributes to carcinogenesis and progression of liver cancer through targeting CDC28 protein kinase regulatory subunit 1B. Oncotarget. 7:43419–43431.
- Jiang Y, Jin S, Tan S, Shen Q, Xue Y. 2019. MiR-203 acts as a radiosensitizer of gastric cancer cells by directly targeting ZEB1. Onco Targets Ther. 12:6093–6104.
- Jiang J, Lin H, Shi S, Hong Y. 2020. Bai X and Cao X: Hsa_circRNA0000518 facilitates breast cancer development via regulation of the miR-326/FGFR1 axis. Thorac Cancer. 11:3181–3192.
- Jiang W, Wei K, Pan C, Li H, Cao J, Han X, Tang Y, Zhu S, Yuan W, He Y, et al. 2018. MicroRNA-1258 suppresses tumour progression via GRB2/Ras/Erk pathway in non-small-cell lung cancer. Cell Prolif. 51:e12502.
- Jiang X, Zhou Y, Sun AJ, Xue JL. 2018. NEAT1 contributes to breast cancer progression through modulating miR-448 and ZEB1. J Cell Physiol. 233:8558–8566.
- Kulcheski FR, Christoff AP, Margis R. 2016. Circular RNAs are miRNA sponges and can be used as a new class of biomarker. J Biotechnol. 238:42–51.
- Liang TC, Fu WG, Zhong YS. 2019. MicroRNA-1236-3p inhibits proliferation and invasion of breast cancer cells by targeting ZEB1. Eur Rev Med Pharmacol Sci. 23:9988–9995.
- MacNeill F, Karakatsanis A. 2017. Over surgery in breast cancer. The Breast. 31:284–289.
- Panda AC. 2018. Circular RNAs Act as miRNA sponges. Adv Exp Med Biol. 1087:67–79.
- Peng X, Zhang Y, Gao J, Cai C. 2020. MiR-1258 promotes the apoptosis of cervical cancer cells by regulating the E2F1/P53 signaling pathway. Exp Mol Pathol. 114:104368.
- Qu S, Liu Z, Yang X, Zhou J, Yu H, Zhang R, Li H. 2018. The emerging functions and roles of circular RNAs in cancer. Cancer Lett. 414:301–309.
- Sun M, Zhao W, Chen Z, Li M, Li S, Wu B, Bu R. 2019. Circ_0058063 regulates CDK6 to promote bladder cancer progression by sponging miR-145-5p. J Cell Physiol. 234:4812–4824.
- Yong W, Zhuoqi X, Baocheng W, Dongsheng Z, Chuan Z, Yueming S. 2018. Hsa_circ_0071589 promotes carcinogenesis via the miR-600/EZH2 axis in colorectal cancer. Biomed Pharmacother. 102:1188–1194.
- Zhang L, Sullivan PS, Goodman JC, Gunaratne PH, Marchetti D. 2011. MicroRNA-1258 suppresses breast cancer brain metastasis by targeting heparanase. Cancer Res. 71:645–654.
- Zhang P, Sun Y, Ma L. 2015. ZEB1: at the crossroads of epithelial-mesenchymal transition, metastasis and therapy resistance. Cell Cycle. 14:481–487.
- Zhao X. 2020. miR-1258 regulates cell proliferation and cell cycle to inhibit the progression of breast cancer by targeting E2F1. BioMed Res Int. 2020:1480819.