
Abstract
Metastasis is one of the most significant independent risk factors that can negatively affect prostate cancer (PCa) patients. However, the exact mechanisms have not been fully elucidated. To illustrate the mechanisms underlying PCa metastasis, we conducted a series of integrated bioinformatics analyses. The essential genes involved in PCa metastasis were obtained by analyzing differentially expressed genes (DEGs) between metastatic PCa and localized PCa. Gene Ontology and KEGG pathway enrichment analysis were performed for functional annotation. Protein–protein interaction networks were constructed for hub gene selection. Three transcription factor genes (FOS, CENPA, and FOXM1) were identified by integrating the hub genes with human transcription factors from The Human Transcription Factors database. Moreover, expression validation and prognostic analysis of the three transcription factor genes were carried out on GEO, TCGA, GEPIA, and the Human Protein Atlas, respectively. Further verification showed that expression variation of the three transcription factor genes existed between metastatic PCa and localized PCa as well as between localized PCa and normal prostate. In addition, different expressions of the three transcription factor genes were associated with the prognosis of localized PCa. In summary, the three transcription factor genes can serve as potential prognostic biomarkers as well as therapeutic targets for PCa.
Abbreviations: PCa: prostate cancer; DEGs: differentially expressed genes; TFs: transcription factors; GEO: Gene Expression Omnibus; FC: fold change; DAVID: Database for Annotation, Visualization, and Integrated Discovery; GO: Gene Ontology; KEGG: Kyoto Encyclopedia of Genes and Genomes; BP: biological process; CC: cell component; MF: molecular function; PPI: protein–protein interaction; MCODE: Molecular Complex Detection; GEPIA: Gene Expression Profiling Interactive Analysis; GTEx: Genotype-Tissue Expression; TCGA: The Cancer Genome Atlas Program; MCC: Maximal Clique Centrality; DMNC: Density of Maximum Neighborhood Component; MNC: Maximum neighborhood component; EPC: Edge Percolated component; DFS: disease-free survival; OS: overall survival; MAPK: mitogen-activated protein kinases
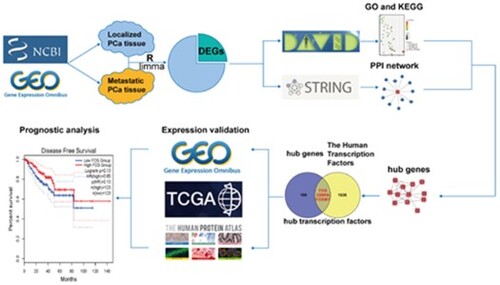
GRAPHICAL ABSTRACT
1. Introduction
Prostate cancer (PCa) is estimated to be the fourth most common cancer globally and the most frequent cancer in men in the United States in 2021 (Siegel et al. Citation2021; Sung et al. Citation2021). While patients with localized PCa have favorable outcomes, the 5-year survival rate for metastatic PCa patients decreases to 30% rapidly as metastatic PCa is incurable currently (Siegel et al. Citation2017). Metastasis is the principal cause of PCa morbidity and mortality (Clarke et al. Citation2009). Since the molecular underpinnings of PCa metastasis are still poorly known, there are currently no effective therapeutics to target PCa metastasis. Therefore, it is imperative to illustrate the mechanisms underlying PCa metastasis to improve its prognosis. Genome characteristics and gene expression of tumors determine their biological behaviors to a large extent (Hanahan and Weinberg Citation2011). Hence, gene profiling of localized PCa and metastatic PCa will help us understand the biological principles behind tumors (Tomlins et al. Citation2007).
Multiple independent studies have been undertaken to perform gene profilings between metastatic PCa and localized PCa (Chandran et al. Citation2007; Lapointe et al. Citation2007; Tomlins et al. Citation2007; Taylor et al. Citation2010). Alterations of oncogenic and tumor suppressor genes have been recognized as PCa metastasis drivers (Taylor et al. Citation2010; Robinson et al. Citation2015; Hamid et al. Citation2019). For example, Taylor et al. identified NCOA2, an AR coactivator, as an oncogene in PCa progression through integrative genomic profiling of 218 PCa tumors (Taylor et al. Citation2010). Robinson et al. reported that TP53 and AR alterations were more prevalent in mCRPC than primary PCa through integrative genomic profiling of 150 advanced PCa samples (Robinson et al. Citation2015). Hamid et al. demonstrated that alterations of tumor suppressor genes such as PTEN and RB1 were associated with an increased risk of relapse and death in primary PCa patients (Hamid et al. Citation2019). These results have shown that some essential genes are involved in PCa progression.
Nevertheless, most of these studies are from a single center. They may be restricted by a limited sample size. Some other essential genes may be omitted in this way. Therefore, integrated bioinformatics studies emerge as a solution to address this inadequacy. So far, there have been relatively few integrated bioinformatics studies focusing on comparing gene expression profilings between localized PCa and metastatic PCa (LaTulippe et al. Citation2002; Chandran et al. Citation2007; Liu et al. Citation2018; Guo et al. Citation2019). Besides, most of them contained limited samples or gene expression datasets. To address this limitation, we performed an integrated bioinformatics analysis, incorporating a sufficient number of cases and high-quality datasets, to identify specific genes differentially expressed between metastatic PCa and localized PCa. These genes may reflect the molecular differences between the two cohorts and provide insights into PCa metastasis mechanisms. In addition, PCa progression involves the dysregulation of transcription factor expression (Labbe and Brown Citation2018). Therefore, differentially expressed transcription factor genes associated with PCa prognosis were further identified and validated.
2. Materials and methods
2.1 Flowchart of data processing
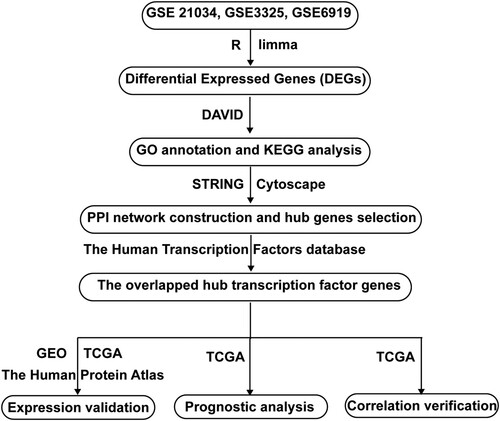
The flowchart of this study was shown in Figure . Three GSE datasets (GSE21034, GSE3325, and GSE6919) were downloaded from the GEO database (http://www.ncbi.nlm.nih.gov/geo). DEGs between metastatic PCa and localized PCa were obtained using the limma R package. Next, Go annotation and KEGG pathway analysis were conducted using the DAVID database. Then, the PPI network was constructed using the STRING database. Subsequently, hub genes were screened using Cytoscape. Next, hub transcription factor genes were selected by integrating hub genes with The Human Transcription Factors database. Subsequently, expression of the three hub transcription factor genes was validated in GEO, TCGA, and The Human Protein Atlas. Finally, prognostic analysis and correlation verification was performed in TCGA.
Figure 1. Flowchart of this study. GSE, Gene Expression Omnibus (GEO) Series; DEGs, differentially expressed genes; DAVID, The Database for Annotation, Visualization and Integrated Discovery; GO, Gene Ontology; KEGG, Kyoto Encyclopedia of Genes and Genomes; PPI, Protein-Protein Interactions; GEO, Gene Expression Omnibus; TCGA, The Cancer Genome Atlas.
2.2. Microarray data
Three gene expression datasets (GSE21034, GSE3325, and GSE6919) were downloaded from the GEO database (http://www.ncbi.nlm.nih.gov/geo) according to the following criteria: (a) the samples include metastatic PCa samples and localized PCa samples; (b) the file type of raw gene expression dataset is CEL; (c) the platform file contain probe ID, gene symbol and Entrez gene ID. GSE21034 was based on the GPL5188 platform (Affymetrix Human Exon 1.0 ST Array), which contained 179 samples, including 131 localized PCa samples and 19 metastatic PCa samples. GSE3325 was based on the GPL570 platform (Affymetrix Human Genome U133 Plus 2.0 Array), which consisted of 19 samples, including seven localized PCa samples and six metastatic PCa samples. GSE6919 was based on the GPL8300 platform (Affymetrix Human Genome U95 Version 2.0 Array), which comprised 171 samples, including 65 localized PCa samples and 25 metastatic PCa samples.
2.3. Data processing and differentially expressed genes (DEGs) screening
The raw CEL data were downloaded and standardized by the Oligo package of R language (Parrish and Spencer Citation2004). According to the annotation files, each probe ID of the expression matrix was replaced with the corresponding gene symbol. If multiple probes corresponded to the same gene, the average value was calculated using the R language for further analysis. Then the genes of each dataset were screened using the limma R package. Genes with an adjusted P-value < 0.05 and |log2fold change (FC)| > 1 were considered as DEGs (Smyth Citation2004). DEGs from the three datasets were integrated using an online web tool, Venn diagrams (https://bioinfogp.cnb.csic.es/tools/venny/).
2.4. GO annotation and KEGG pathway analysis of DEGs
The DAVID 6.8 database (https://david.ncifcrf.gov/) was used to perform GO annotation and KEGG pathway enrichment analysis of the integrated DEGs (Dennis et al. Citation2003). GO annotation of the integrated DEGs involves three parts: biological process (BP), cellular component (CC), and molecular function (MF). P < 0.05 was considered to indicate a statistically significant difference.
2.5. Protein–protein interaction (PPI) network construction and hub gene selection
A PPI network of the integrated DEGs was constructed using STRING database (https://string-db.org/) with a default high confidence (0.47). Then Cytoscape software (version 3.8.0) was used to visualize the PPI network (Shannon et al. Citation2003). The plug-in cytoHubba was used to rank nodes in a network by their network features through 12 topological analysis methods, including MCC, DMNC, MNC, and EPC (Chin et al. Citation2014). Genes with degree ≥20 in the PPI network were considered as hub genes.
2.6. Selection of hub transcription factor genes, expression validation, and prognostic analysis
Four public databases were used to select hub transcription factor genes and conduct subsequent integrated analysis.
The Human Transcription Factors database (http://humantfs.ccbr.utoronto.ca/) provides curated 1639 human TFs with detailed information to survey human TF function, expression, and association with human diseases (Lambert et al. Citation2018).
UALCAN (https://ualcan.path.uab.edu/) is a website for analyzing cancer OMICS data based on the TCGA database (Chandrashekar et al. Citation2017).
Gene Expression Profiling Interactive Analysis (GEPIA) (https://gepia.cancer-pku.cn/) is a public database to analyze gene expression profiles based on the TCGA and Genotype-Tissue Expression (GTEx) projects (Tang et al. Citation2017).
The Human Protein Atlas (https://www.proteinatlas.org/) is a public database to examine human proteome at multiple levels (Uhlen et al. Citation2015).
Hub transcription factor genes were obtained by integrating hub genes in the PPI network with 1639 transcription factors in The Human Transcription Factors database. The expression of hub transcription factor genes in localized PCa and metastatic PCa was analyzed in the three GEO datasets mentioned above and in the TCGA database. The prognostic significance of the hub transcription factor genes for localized PCa was interrogated on the GEPIA database and The Human Protein Atlas database.
Furthermore, the expression of hub transcription factor genes in localized PCa and normal prostate was analyzed with the TCGA database on the UALCAN website and The Human Protein Atlas database. Specifically, mRNA expression evaluation of the hub transcription factor genes in localized PCa and normal prostate was performed on the UALCAN website. Immunohistochemistry images of hub transcription factor genes in localized PCa and normal prostate were downloaded from The Human Protein Atlas database. Image-Pro Plus software was applied for the quantitative analysis of the immunohistochemical results. Three immunohistochemical images of each group were taken to measure the average optical density (Xu et al. Citation2015). Student's t-test was used to analyze the statistical difference between the two groups. P < 0.05 was considered to indicate a statistically significant difference.
2.7. Validation and prognostic analysis of genes associated with hub transcription factor genes
Hub transcription factor genes and their related genes underwent GO functional annotation, KEGG pathway enrichment analysis, and PPI network construction. Correlation validation of the top five genes associated with hub transcription factor genes in the PPI network was performed in the TCGA database. The prognostic significance of each correlated gene was interrogated in the GEPIA database. P < 0.05 was considered statistically significant.
3. Results
3.1 Microarray data normalization and identification of integrated DEGs
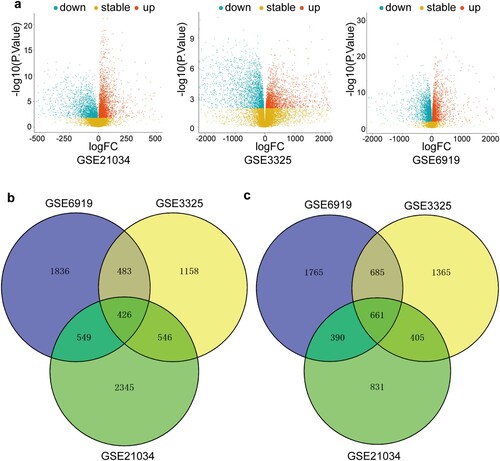
The three GEO datasets included GSE21034, GSE3325, and GSE6919 (Table S1). The three GEO datasets were normalized by the Oligo package of the R language. The DEGs were screened using the limma R package (screening criteria: adjusted P < 0.05 and |log2 fold change (FC)| > 1). Up-regulation or down-regulation referred to the expression of specific genes in metastatic PCa relative to that in localized PCa. The GSE21034 dataset contained 6153 DEGs, including 3866 up-regulated genes and 2287 down-regulated genes. The GSE3325 dataset comprised 5729 DEGs, among them 2613 up-regulated and 3116 down-regulated. The GSE6919 dataset consisted of 6795 DEGs, involving 3294 up-regulated and 3501 down-regulated. The up-regulated DEGs and down-regulated DEGs in each GEO dataset were shown in volcano plots (Figure a). An overlap of up-regulated DEGs from the three GEO datasets was identified (Figure b). Similarly, an overlap of down-regulated DEGs was selected (Figure c). Collectively, there were 426 up-regulated integrated DEGs and 661 down-regulated integrated DEGs between metastatic PCa and localized PCa from the three GEO datasets (Table S2).
Figure 2. Identification of the DEGs. (a) Volcano plots of microarrays from GSE21034, GSE3325, and GSE6919. The red nodes represent up-regulated DEGs. The green nodes indicate down-regulated DEGs. (b) Venn diagrams of the overlapping up-regulated DEGs between the three indicated microarrays. (c) Venn diagrams of the overlapping down-regulated DEGs between the three indicated microarrays.
3.2. GO annotation and KEGG pathway enrichment analysis of DEGs
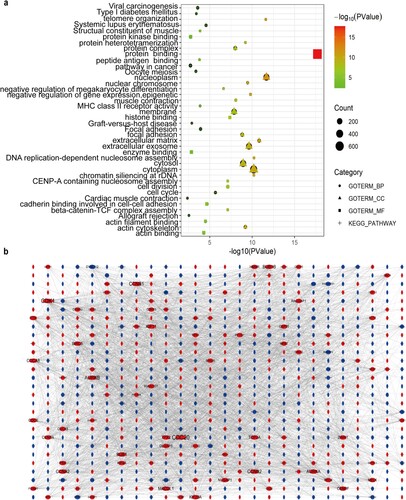
Each top five GO terms of up-regulated and down-regulated DEGs were shown in Table S3 (Table S3). The up-regulated DEGs in metastatic PCa were primarily enriched in the regulation of cell division, nucleoplasm, and protein binding. In contrast, the down-regulated DEGs in metastatic PCa were mainly involved in cell adhesion, extracellular exosome, and muscle structure. As for the KEGG pathway, the up-regulated DEGs in metastatic PCa were substantially enriched in the cell cycle. By contrast, the down-regulated DEGs in metastatic PCa were significantly involved in focal adhesion and cancer pathways (Figure a).
Figure 3. GO annotation and KEGG pathway enrichment analysis of the overlapping DEGs and protein-protein interactions (PPI) network construction. (a) GO enrichment analysis and KEGG pathway enrichment analysis of the overlapping DEGs. (b) PPI network of the overlapping DEGs. The red nodes represent up-regulated DEGs. The blue nodes indicate down-regulated DEGs.
3.3. PPI network construction and hub gene selection
PPI network of DEGs was constructed using the STRING database (Figure b). As criteria described above, 103 genes were identified as hub genes in the PPI network (Table S4).
3.4. Selection of hub transcription factor genes, expression validation, and prognostic analysis
Three hub transcription factor genes, FOS, CENPA, and FOXM1, were identified by integrating 103 hub genes in the PPI network with 1639 transcription factors from The Human Transcription Factors database (Figure a). The expression of the three hub transcription factor genes in localized PCa (T) and metastatic PCa (M) in the three GEO datasets mentioned above was analyzed. FOS was down-regulated in metastatic PCa (M) compared with localized PCa (T). By contrast, CENPA and FOXM1 were up-regulated in metastatic PCa (M) compared to localized PCa (T) (Figure b).
Figure 4. Identification and validation of hub transcription factor genes. (a) Venn diagrams of 103 hub genes in the PPI network and 1639 transcription factors from The Human Transcription Factors database. (b) mRNA expression of the three hub transcription factor genes in localized PCa (T) and metastatic PCa (M) in the three GEO datasets. (c) mRNA expression of the three hub transcription factor genes in normal prostate samples (Normal), localized PCa (N0), and metastatic PCa (N1) from TCGA database. * P < 0.05; ** P < 0.01; *** P < 0.001. P < 0.05 was considered statistically significant. Student's t-test was used. (d) Disease-free survival curves of localized PCa patients with different expression of the three hub transcription factor genes.
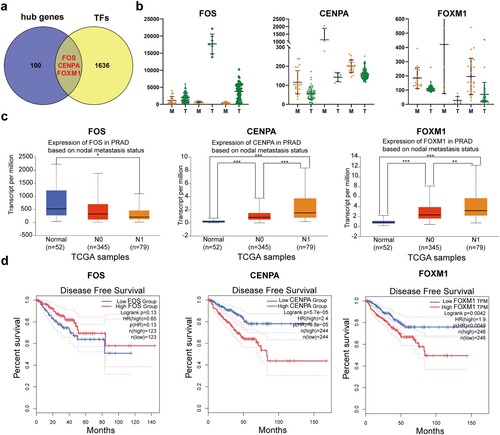
Similarly, the results were confirmed in the TCGA database. FOS was down-regulated in metastatic PCa (N1) compared with localized PCa (N0) and normal prostate samples (normal) from the TCGA database on the UALCAN website. In contrast, CENPA and FOXM1 were up-regulated in metastatic PCa (N1) compared to localized PCa (N0) and normal prostate samples (normal) (Figure c).
To further investigate whether these genes contribute to predicting the prognosis of PCa, the GEPIA database was used to analyze the disease-free survival of localized PCa patients with different expressions of these genes. Patients with higher expression of FOS showed a tendency of improved disease-free survival compared with patients with lower expression of FOS, although there was no statistical significance. Interestingly, higher expression of FOS was associated with better overall survival in localized PCa patients from The Human Protein Atlas database (Figure S1). Conversely, higher expression of CENPA and FOXM1 was correlated with worse disease-free survival (Figure d).
Furthermore, the three transcription factor genes in localized PCa and normal prostate from the TCGA database were examined. FOS was down-regulated in localized PCa compared with normal prostate at both mRNA and protein levels (Figure S2a). By contrast, CENPA and FOXM1 were up-regulated in localized PCa compared to normal prostate at mRNA as well as protein level (Figure S2 b and c).
3.5. Functional analysis of FOS and its related genes
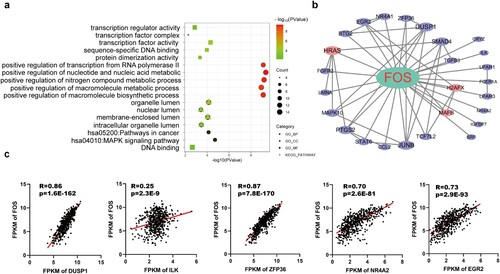
GO annotation and KEGG pathway enrichment analysis of FOS and its associated genes were performed. They were principally involved in the positive regulation of the nucleic acid metabolic process and transcription factor activity. The KEGG pathway analysis revealed that they were primarily enriched in the MAPK signaling pathway and cancer pathways (Figure a). PPI network of FOS and its related genes was constructed. The top five FOS-related genes in the PPI network were DUSP1, ILK, ZFP36, NR4A2, EGR2 (Figure b). Their correlation with FOS was validated in the TCGA database (Figure c).
Figure 5. Functional analysis of FOS related genes. (a) GO annotation and KEGG pathway enrichment analysis of FOS related genes. (b) PPI network of FOS related genes. (c) Correlation validation of the top five FOS related genes (DUSP1, ILK, ZFP36, NR4A2, EGR2) in the PPI network was performed in the TCGA database.
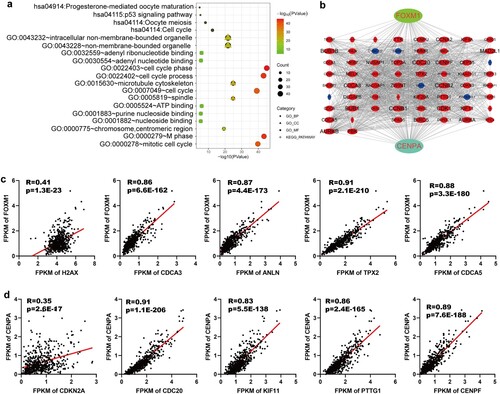
3.6. Functional analysis of CENPA, FOXM1, and their related genes
GO annotation and KEGG pathway enrichment analysis of FOXM1, CENPA, and their related genes was conducted. They were primarily enriched in the cell cycle phase, microtubule cytoskeleton, and ATP-binding. The KEGG pathway analysis was mainly involved in the cell cycle (Figure a). PPI networks of FOXM1, CENPA, and their related genes were constructed. The top five FOXM1 related genes in the PPI network were H2AX, CDCA3, ANLN, TPX2, CDCA5 (Figure b). Their correlation with FOXM1 was validated in the TCGA database (Figure c). Similarly, the top five CENPA related genes in the PPI network were CDKN2A, CDC20, KIF11, PTTG1, CENPF (Figure b). Their correlation with CENPA was verified in the TCGA database (Figure d).
Figure 6. Functional analysis of FOXM1 and CENPA related genes. (a) GO annotation and KEGG pathway enrichment analysis of FOXM1 related genes and CENPA related genes. (b) PPI networks of FOXM1 related genes and CENPA related genes. (c) Correlation validation of the top five FOXM1 related genes (H2AX, CDCA3, ANLN, TPX2, CDCA5) in the PPI network was performed in the TCGA database. (d) Correlation validation of the top five CENPA related genes (CDKN2A, CDC20, KIF11, PTTG1, CENPF) in the PPI network was conducted in the TCGA database.
3.7. Prognostic analysis of genes associated with FOXM1 and CENPA
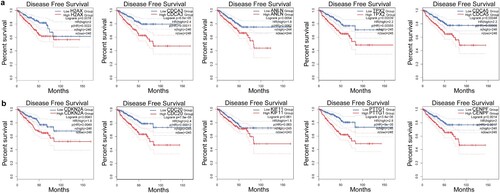
To further investigate whether each top five genes related to FOXM1 and CENPA contribute to predicting the prognosis of PCa, GEPIA was applied to compare the disease-free survival of localized PCa patients with different expressions of these genes. Higher expression of each of the top five FOXM1 related genes (H2AX, CDCA3, ANLN, TPX2, CDCA5) was associated with shorter disease-free survival of localized PCa patients (Figure a). Similarly, higher expression of each of the top five CENPA related genes (CDKN2A, CDC20, KIF11, PTTG1, CENPF) was correlated with shorter disease-free survival of localized PCa patients (Figure b).
Figure 7. The clinical significance of the top five FOXM1 and CENPA related genes. (a) Kaplan-Meier plots of disease-free survival for localized PCa patients with different expression of the top five FOXM1 related genes. (b) Kaplan-Meier plots of disease-free survival for localized PCa patients with different expression of the top five CENPA related genes.
4. Discussion
Over the past decades, numerous studies, including various sequencing technologies, have focused on the molecular mechanisms of PCa metastasis. However, the biological principle underlying this complex process remains poorly understood.
Previous studies reported that different gene expression profiles existed between metastatic PCa and localized PCa either in a single cohort (LaTulippe et al. Citation2002; Varambally et al. Citation2005; Chandran et al. Citation2007; Taylor et al. Citation2010) or in an integrated series (Liu et al. Citation2018; Guo et al. Citation2019; Xu et al. Citation2020). As an integrated analysis based on previous studies, our results showed partial overlap with those previously described. For example, consistent with previous investigations, FOS and FOXM1 were listed in the DEGs between metastatic PCa and localized PCa (Chandran et al. Citation2007; Guo et al. Citation2019). However, differences existed. For instance, in our study, FOS was down-regulated in localized PCa compared with normal prostate. While in Chandran's observation, they found that FOS was up-regulated in localized PCa compared to normal prostate (Chandran et al. Citation2007). Different patient cohorts, sample processing methods, experimental design, and statistical methods may account for the differences in the results obtained by various studies.
Our study demonstrated several biological programs associated with cell division, cell adhesion, and transcriptional regulation were altered in metastatic PCa compared with localized PCa. These results suggested that increased cell division and decreased cell adhesion contributed to PCa metastasis.
Prostate cancer progression involves the destruction of the normal prostate transcriptional network, following the dysregulated expression of key transcription factors (Labbe and Brown Citation2018). In the present study, we used a novel method to screen hub transcription factor genes associated with PCa metastasis. As a result, three hub transcription factor genes, FOS, CENPA, and FOXM1, were identified by integrating the hub genes screened from DEGs between metastatic PCa and localized PCa with The Human Transcription Factors database. These results indicated that these genes might play critical roles in the process of PCa metastasis.
FOS is one of the first studied proto-oncogenes that can dimerize with c-JUN and form the transcription factor complex AP-1. FOS has been regarded as a regulator of cell proliferation, differentiation, transformation, and apoptosis (Piechaczyk and Blanchard Citation1994; Zhang et al. Citation2007). Consistent with previous studies, FOS was down-regulated in metastatic PCa compared with the localized PCa in the three GEO datasets and the TCGA database in our study (Chandran et al. Citation2007; Guo et al. Citation2019). Moreover, higher expression of FOS was associated with better overall survival of localized PCa patients from the TCGA database, which indicated that FOS might act as an underlying metastasis-inhibitory transcription factor and a favorable prognostic marker. Some previous studies reported that FOS could induce apoptosis by suppressing the antiapoptotic molecule c-FLIP and inhibit cell growth by up-regulating cyclin-dependent kinase inhibitor p21 (Li et al. Citation2007; Zhang et al. Citation2007; Chan et al. Citation2010). However, some investigators found that FOS up-regulation in the advanced stage promoted PCa progression via MAPK pathway activation (Ouyang et al. Citation2008). Therefore, further investigations into the role and mechanisms of FOS in the development of PCa are needed.
CENPA encodes centromere protein A, which contains a histone H3 related histone fold domain to target the centromere. Overexpression of CENPA may contribute to chromosomal instability, which is the initial trigger of the metastasis cascade (Shrestha et al. Citation2017; Fares et al. Citation2020). A previous report pointed out that CENPA could be used as a biomarker for poor prognosis in multiple cancers (Sun et al. Citation2016). CENPA was up-regulated in metastatic PCa compared with localized PCa in the three GEO datasets and the TCGA database in the present study. Furthermore, higher expression of CENPA was associated with worse disease-free survival of localized PCa patients from the TCGA database, which suggested that CENPA might serve as an underlying metastasis-promoting transcription factor and an adverse prognostic indicator. The notion was in accordance with Saha's observation that CENPA was highly overexpressed and promoted tumor growth in PCa (Saha et al. Citation2020). Moreover, higher expression of each of the top five CENPA related genes (CDKN2A, CDC20, KIF11, PTTG1, CENPF) was correlated with shorter disease-free survival of localized PCa. Altogether, these results imply that CENPA might act as a potential therapeutic target and an adverse prognostic marker in PCa.
FOXM1 is a transcriptional activator involved in cell proliferation, which regulates the expression of several cell cycle genes, such as cyclin B1 and cyclin D1. FOXM1 has been demonstrated as one of the driving factors promoting PCa progression (Kalin et al. Citation2006; Aytes et al. Citation2014; Lin et al. Citation2016). FOXM1 was up-regulated in metastatic PCa compared with localized PCa in the three GEO datasets and the TCGA database in our study. Additionally, higher expression of FOXM1 was associated with worse disease-free survival in the PCa cohort from the TCGA database, indicating that FOXM1 might function as a metastasis-promoting transcription factor and an adverse prognostic marker. Furthermore, higher expression of each of the top five FOXM1 related genes (H2AX, CDCA3, ANLN, TPX2, CDCA5) was correlated with shorter disease-free survival of localized PCa. Collectively, these findings further support that FOXM1 might serve as a potential therapeutic target and an unfavorable prognostic biomarker in PCa.
Interestingly, by comparing the expression of the three transcription factor genes between localized PCa and normal prostate, we found similar gene expression patterns with that between metastatic PCa and localized PCa. These results mean that the three transcription factor genes may be involved in the whole process of PCa development, i.e. from normal prostate to localized PCa, and from localized PCa to metastatic PCa.
In summary, our findings shed light on the roles of FOS, CENPA, and FOXM1 in the development of metastatic PCa. FOS was down-regulated in metastatic PCa and positively associated with the prognosis of localized PCa. Conversely, CENPA and FOXM1 were up-regulated in metastatic PCa and negatively correlated with the prognosis of localized PCa. Therefore, FOS, CENPA, and FOXM1 may serve as potential prognostic biomarkers for localized PCa. Systematic study and validation of their roles and mechanisms underlying PCa metastasis will contribute to the development of therapies to inhibit PCa metastasis and prognosis improvement. Moreover, the different expression patterns of the three transcription factor genes between PCa and normal prostate indicate that they may be used as potential diagnostic biomarkers for PCa. Furthermore, in view of the involvement of FOS, CENPA, and FOXM in the entire development of PCa, they are expected to become potential markers of molecular subtyping of PCa and therapeutic targets for personalized medicine.
Although there are several findings in this study, there are some limitations as well. First, due to the in silico nature of the analysis, the study depends on previous investigations and data to a large extent. Some critical genes might have been left out due to the absence of some data sources. Second, the lack of experimental verification is also a weakness of this study. Third, the limited sample size may also represent an inadequacy to draw compelling conclusions. Notwithstanding these insufficiencies, the investigation may still provide valuable insights into PCa metastasis and facilitate the development of prognostic biomarkers for PCa.
Conclusions
In conclusion, we have identified three essential transcription factor genes (FOS, CENPA, FOXM1) involved in PCa metastasis and associated with its prognosis using a series of integrated bioinformatics methods. These genes may serve as potential prognostic biomarkers as well as therapeutic targets for PCa in the future.
Supplemental Material
Download Zip (33.7 MB)Acknowledgments
We thank all the online public databases, including TCGA, GEO, UALCAN, GEPIA, and The Human Protein Atlas.
Data availability statement
The data and materials supporting the results or analyses presented in our paper are freely available. The data are deposited at the below sites: https://doi.org/10.6084/m9.figshare.14226992.v1; (manuscript) https://doi.org/10.6084/m9.figshare.14227058.v1; (figures)
Disclosure statement
No potential conflict of interest was reported by the author(s).
Additional information
Funding
Related Research Data
References
- Aytes A, Mitrofanova A, Lefebvre C, Alvarez MJ, Castillo-Martin M, Zheng T, Eastham JA, Gopalan A, Pienta KJ, Shen MM, et al. 2014. Cross-species regulatory network analysis identifies a synergistic interaction between FOXM1 and CENPF that drives prostate cancer malignancy. Cancer Cell. 25:638–651. doi:10.1016/j.ccr.2014.03.017.
- Chan QK, Lam HM, Ng CF, Lee AY, Chan ES, Ng HK, Ho SM, Lau KM. 2010. Activation of GPR30 inhibits the growth of prostate cancer cells through sustained activation of Erk1/2, c-jun/c-fos-dependent upregulation of p21, and induction of G(2) cell-cycle arrest. Cell Death Differ. 17:1511–1523. doi:10.1038/cdd.2010.20.
- Chandran UR, Ma C, Dhir R, Bisceglia M, Lyons-Weiler M, Liang W, Michalopoulos G, Becich M, Monzon FA. 2007. Gene expression profiles of prostate cancer reveal involvement of multiple molecular pathways in the metastatic process. BMC Cancer. 7:64. doi:10.1186/1471-2407-7-64.
- Chandrashekar DS, Bashel B, Balasubramanya SAH, Creighton CJ, Ponce-Rodriguez I, Chakravarthi B, Varambally S. 2017. UALCAN: a portal for facilitating tumor subgroup gene expression and survival analyses. Neoplasia. 19:649–658. doi:10.1016/j.neo.2017.05.002.
- Chin CH, Chen SH, Wu HH, Ho CW, Ko MT, Lin CY. 2014. Cytohubba: identifying hub objects and sub-networks from complex interactome. BMC Syst Biol. 8(Suppl 4):S11. doi:10.1186/1752-0509-8-S4-S11.
- Clarke NW, Hart CA, Brown MD. 2009. Molecular mechanisms of metastasis in prostate cancer. Asian J Androl. 11:57–67. doi:10.1038/aja.2008.29.
- Dennis G, Jr., Sherman BT, Hosack DA, Yang J, Gao W, Lane HC, Lempicki RA. 2003. DAVID: database for annotation, visualization, and integrated discovery. Genome Biol. 4:P3.
- Fares J, Fares MY, Khachfe HH, Salhab HA, Fares Y. 2020. Molecular principles of metastasis: a hallmark of cancer revisited. Signal Transduct Target Ther. 5:28. doi:10.1038/s41392-020-0134-x.
- Guo L, Lin M, Cheng Z, Chen Y, Huang Y, Xu K. 2019. Identification of key genes and multiple molecular pathways of metastatic process in prostate cancer. PeerJ. 7:e7899. doi:10.7717/peerj.7899.
- Hamid AA, Gray KP, Shaw G, MacConaill LE, Evan C, Bernard B, Loda M, Corcoran NM, Van Allen EM, Choudhury AD, Sweeney CJ. 2019. Compound genomic alterations of TP53, PTEN, and RB1 tumor suppressors in localized and metastatic prostate cancer. Eur Urol. 76:89–97. doi:10.1016/j.eururo.2018.11.045.
- Hanahan D, Weinberg RA. 2011. Hallmarks of cancer: the next generation. Cell. 144:646–674. doi:10.1016/j.cell.2011.02.013.
- Kalin TV, Wang IC, Ackerson TJ, Major ML, Detrisac CJ, Kalinichenko VV, Lyubimov A, Costa RH. 2006. Increased levels of the FoxM1 transcription factor accelerate development and progression of prostate carcinomas in both TRAMP and LADY transgenic mice. Cancer Res. 66:1712–1720. doi:10.1158/0008-5472.CAN-05-3138.
- Labbe DP, Brown M. 2018. Transcriptional regulation in prostate cancer. Cold Spring Harb Perspect Med. 8. doi:10.1101/cshperspect.a030437.
- Lambert SA, Jolma A, Campitelli LF, Das PK, Yin Y, Albu M, Chen X, Taipale J, Hughes TR, Weirauch MT. 2018. The Human Transcription factors. Cell. 175:598–599. doi:10.1016/j.cell.2018.09.045.
- Lapointe J, Li C, Giacomini CP, Salari K, Huang S, Wang P, Ferrari M, Hernandez-Boussard T, Brooks JD, Pollack JR. 2007. Genomic profiling reveals alternative genetic pathways of prostate tumorigenesis. Cancer Res. 67:8504–8510. doi:10.1158/0008-5472.CAN-07-0673.
- LaTulippe E, Satagopan J, Smith A, Scher H, Scardino P, Reuter V, Gerald WL. 2002. Comprehensive gene expression analysis of prostate cancer reveals distinct transcriptional programs associated with metastatic disease. Cancer Res. 62:4499–4506.
- Li W, Zhang X, Olumi AF. 2007. MG-132 sensitizes TRAIL-resistant prostate cancer cells by activating c-Fos/c-Jun heterodimers and repressing c-FLIP(L). Cancer Res. 67:2247–2255. doi:10.1158/0008-5472.CAN-06-3793.
- Lin SC, Kao CY, Lee HJ, Creighton CJ, Ittmann MM, Tsai SJ, Tsai SY, Tsai MJ. 2016. Dysregulation of miRNAs-COUP-TFII-FOXM1-CENPF axis contributes to the metastasis of prostate cancer. Nat Commun. 7:11418. doi:10.1038/ncomms11418.
- Liu LY, Guo KM, Liang ZW, Li FB, Wang HL. 2018. Identification of candidate genes that may contribute to the metastasis of prostate cancer by bioinformatics analysis. Oncol Lett. 15:1220–1228. doi:10.3892/ol.2017.7404.
- Ouyang X, Jessen WJ, Al-Ahmadie H, Serio AM, Lin Y, Shih WJ, Reuter VE, Scardino PT, Shen MM, Aronow BJ, et al. 2008. Activator protein-1 transcription factors are associated with progression and recurrence of prostate cancer. Cancer Res. 68:2132–2144. doi:10.1158/0008-5472.CAN-07-6055.
- Parrish RS, Spencer HJ. 2004. 3rd, Effect of normalization on significance testing for oligonucleotide microarrays. J Biopharm Stat. 14:575–589. doi:10.1081/BIP-200025650.
- Piechaczyk M, Blanchard JM. 1994. c-fos proto-oncogene regulation and function. Crit Rev Oncol Hematol. 17:93–131. doi:10.1016/1040-8428(94)90021-3.
- Robinson D, Van Allen EM, Wu YM, Schultz N, Lonigro RJ, Mosquera JM, Montgomery B, Taplin ME, Pritchard CC, Attard G, et al. 2015. Integrative clinical genomics of advanced prostate cancer. Cell. 162:454. doi:10.1016/j.cell.2015.06.053.
- Saha AK, Contreras-Galindo R, Niknafs YS, Iyer M, Qin T, Padmanabhan K, Siddiqui J, Palande M, Wang C, Qian B, et al. 2020. The role of the histone H3 variant CENPA in prostate cancer. J Biol Chem. 295:8537–8549. doi:10.1074/jbc.RA119.010080.
- Shannon P, Markiel A, Ozier O, Baliga NS, Wang JT, Ramage D, Amin N, Schwikowski B, Ideker T. 2003. Cytoscape: a software environment for integrated models of biomolecular interaction networks. Genome Res. 13:2498–2504. doi:10.1101/gr.1239303.
- Shrestha RL, Ahn GS, Staples MI, Sathyan KM, Karpova TS, Foltz DR, Basrai MA. 2017. Mislocalization of centromeric histone H3 variant CENP-A contributes to chromosomal instability (CIN) in human cells. Oncotarget. 8:46781–46800. doi:10.18632/oncotarget.18108.
- Siegel RL, Miller KD, Fuchs HE, Jemal A, Statistics C. 2021. CA Cancer J Clin. 71(2021):7–33. doi:10.3322/caac.21654.
- Siegel RL, Miller KD, Jemal A, Statistics C. 2017. CA Cancer J Clin. 67(2017):7–30. doi:10.3322/caac.21387.
- Smyth GK. 2004. Linear models and empirical bayes methods for assessing differential expression in microarray experiments. Stat Appl Genet Mol Biol. 3:Article3. doi:10.2202/1544-6115.1027.
- Sun X, Clermont PL, Jiao W, Helgason CD, Gout PW, Wang Y, Qu S. 2016. Elevated expression of the centromere protein-A(CENP-A)-encoding gene as a prognostic and predictive biomarker in human cancers. Int J Cancer. 139:899–907. doi:10.1002/ijc.30133.
- Sung H, Ferlay J, Siegel RL, Laversanne M, Soerjomataram I, Jemal A, Bray F. 2021. Global cancer statistics 2020: GLOBOCAN estimates of incidence and mortality worldwide for 36 cancers in 185 countries. CA Cancer J Clin. doi:10.3322/caac.21660.
- Tang Z, Li C, Kang B, Gao G, Li C, Zhang Z. 2017. GEPIA: a web server for cancer and normal gene expression profiling and interactive analyses. Nucleic Acids Res. 45:W98–W102. doi:10.1093/nar/gkx247.
- Taylor BS, Schultz N, Hieronymus H, Gopalan A, Xiao Y, Carver BS, Arora VK, Kaushik P, Cerami E, Reva B, et al. 2010. Integrative genomic profiling of human prostate cancer. Cancer Cell. 18:11–22. doi:10.1016/j.ccr.2010.05.026.
- Tomlins SA, Mehra R, Rhodes DR, Cao X, Wang L, Dhanasekaran SM, Kalyana-Sundaram S, Wei JT, Rubin MA, Pienta KJ, et al. 2007. Integrative molecular concept modeling of prostate cancer progression. Nat Genet. 39:41–51. doi:10.1038/ng1935.
- Uhlen M, Fagerberg L, Hallstrom BM, Lindskog C, Oksvold P, Mardinoglu A, Sivertsson A, Kampf C, Sjostedt E, Asplund A, et al. 2015. Proteomics. Tissue-based map of the human proteome. Science. 347:1260419. doi:10.1126/science.1260419.
- Varambally S, Yu J, Laxman B, Rhodes DR, Mehra R, Tomlins SA, Shah RB, Chandran U, Monzon FA, Becich MJ, et al. 2005. Integrative genomic and proteomic analysis of prostate cancer reveals signatures of metastatic progression. Cancer Cell. 8:393–406. doi:10.1016/j.ccr.2005.10.001.
- Xu N, Chen SH, Lin TT, Cai H, Ke ZB, Dong RN, Huang P, Li XD, Chen YH, Zheng QS. 2020. Development and validation of hub genes for lymph node metastasis in patients with prostate cancer. J Cell Mol Med. 24:4402–4414. doi:10.1111/jcmm.15098.
- Xu Y, Ma X-p, An J-n, Zhang Z-j, Ding J, Qu Y-k, Liu Z-l, Lin N. 2015. Short-time QiBaoMeiRan formula treatment exerts estrogenic activities without side effects on reproductive tissues in immature mice. Sci Rep. 5:17436. doi:10.1038/srep17436.
- Yu YP, Landsittel D, Jing L, Nelson J, Ren B, Liu L, McDonald C, Thomas R, Dhir R, Finkelstein S, et al. 2004. Gene expression alterations in prostate cancer predicting tumor aggression and preceding development of malignancy. J Clin Oncol. 22:2790–2799. doi:10.1200/JCO.2004.05.158.
- Zhang XP, Zhang L, Yang HM, Huang X, Otu H, Libermann TA, DeWolf WC, Khosravi-Far R, Olumi AF. 2007. c-Fos as a proapoptotic agent in TRAIL-induced apoptosis in prostate cancer cells. Cancer Res. 67:9425–9434. doi:10.1158/0008-5472.Can-07-1310.