
 ?Mathematical formulae have been encoded as MathML and are displayed in this HTML version using MathJax in order to improve their display. Uncheck the box to turn MathJax off. This feature requires Javascript. Click on a formula to zoom.
Abstract
Among abiotic stresses, drought influences plant growth and productivity, and plant stress responses depend on stress intensity and genotype. The effects of simulated drought stress on germination parameters were tested for tolerance and sensitivity in 59 barley accessions from all regions of Iraq and phenotypic, physiological, and biochemical responses associated with drought stress were investigated. Stress treatments with polyethylene glycol (PEG) reduced the germination rate and dramatically delayed the development of the seedlings. Significant changes in the physiological and biochemical profiles in barley accessions were observed. A smaller reduction in water absorption of seeds was observed across all accessions, while all biochemical characteristics except total flavonoid content were increased with the increase in water deficiency in most accessions. Among the 59 barley accessions, ABN was the most tolerant accession, while Black-Garmiyan was the most drought-prone. Significant relationships were found between most trait pairs, with 24 significant associations under no stress, 39 significant correlations under the 10.25% PEG treatment, and 60 significant correlations under the 20.50% PEG treatment. According to the key importance analysis, seed water uptake, total phenol content, soluble sugar content, and catalase are classified as relative significance traits for germination percentage, root and shoot length under stress conditions.
Introduction
Plants are related to countless abiotic and biotic stresses affecting their development, metabolism, and yield due to adverse environmental conditions (Tsubo et al. Citation2005). One of the major abiotic stresses constraining crop productivity is drought stress condition, which reduces the productivity of the plant by slowing growth, and closing of stomata, which leads to reduces the activity of photosynthesis (Singh and Prasad Citation2014). For recognizing plant tolerance and oxidative stress in reaction to water deficit, many field studies have been conducted (Khanna-Chopra and Selote Citation2007; Vendruscolo et al. Citation2007; Semwal and Khanna-Chopra Citation2020). It is widely accepted the study of drought resistance is not an easy task as many genes are involved in such resistance and it is a complex trait and mostly conditioned by many component responses and durations and intensities of water deficit will greatly involve (Luo et al. Citation2019). In addition, the selection on the basis of the phenotype will challenge for certain traits because most agronomic attributes are demonstrated differently under optimal and stressful circumstances and are considered to be influenced by environmental factors (Kumar et al. Citation2018).
Barley (Hordeum vulgare L.) is an essential grain cereal in semi-arid dryland systems. Germination and development of barley are strongly influenced by the water deficit, especially in these regions, due to the inappropriate distribution of rainfall. In several developing countries, barley is typically subjected to severe drought stress, which has a major impact on development and production (Grando and Macpherson Citation2005). Compared to other cereals, barley is grown over a wider environmental range and can overcome in such unfavorable conditions. In such situations, barley undergoes drought stress during seed germination and early stages of development. These phases are vital to drought stress and challenge the development of barley (Amini Citation2013).
Drought stress highly affects seed germination (Hongbo et al. Citation2005). In real environment conditions, it is almost disagreeable duty to create and maintain pure water potential, which is available for plants. Consequently, one of the best approaches to study the effects of drought stress on germination, is to create conditions for drought stress using different osmotic materials to generate osmotic capacities. In these respects, polyethylene glycol (PEG-6000) is used specifically for assessing details relevant to dryness tension from plants (Veselov et al. Citation2002; Vanani et al. Citation2020). This molecule has a high molecular weight; it cannot pass through the cell wall membrane. PEG caused water stress in plants and did not have any harmful properties (Johnson Citation2001).
Generally, drought causes many biochemical and physiological modifications ranging from subcellular levels to the whole plant. One of these changes in the making of reactive oxygen species (ROS), which harms the plant metabolism. In these ways, the plants naturally have established diverse pathways to resist this barrier (Yordanov et al. Citation2000; Zhang et al. Citation2015). A normal amount of ROS is required for plant metabolism, but excess quantity will harm the plants. Therefore, for limiting the oxidative damage and terminating the active oxygen species, plant cells have produced antioxidant defense systems. This mechanism consists of scavenging free radicals with regular antioxidants. Several non-enzymatic and enzymatic antioxidant defense systems are governing the ROS production, including ascorbate peroxidase (APX), catalase (CAT), proline oxidase (POX), superoxide dismutase (SOD), monodehydroascorbate reductase, and many others, while non-enzymatic catalysts contain ascorbate, glutathione, carotenoids, proline, phenolic compounds, sugars and glycine betaine (Barna et al. Citation2003; Zhang et al. Citation2015). This study aims to investigate: (1) a collection of barley accessions for their drought tolerance and (2) phenotypic, physiological, and biochemical responses associated with drought stress.
Materials and methods
Chemical materials
PEG-6000, gallic acid, vanillin, quercetin, 1- diphenyl-2-picrylhydrazyl, 6-hydroxy-2,5,7,8-tetramethylchroman-2-carboxylic acid, L-proline, Folin–Ciocalteu reagent, anthrone, ninhydrin, and guaiacol were acquired from Sigma-Aldrich Co. Inc., Germany. Whereas, other chemicals at analytical grades were purchased from Biochem-Biopharma Co., Inc., France.
Plant materials
The plant materials consisted of 59 accessions, which originated from almost all research centers in Iraq (Table ). The accessions are the most widely cultivated in Iraq. The barley accessions are cultivated mainly in three geographical regions in Iraq. Three advanced breeding lines (V40, V41, and V42) have recently been released by Assistant Professor Dr. Kamil from the University of Sulaimani, College of Agricultural Engineering Sciences, and have kindly been made available to us to investigate our study. Moreover, some of these accessions (V17, V18, V19, V20, V44, V45, V46, V47, V48, V50, V51, V52, V53, and V54) are landraces collected from northern Iraq. All experiments were conducted at the University of Sulaimani, College of Agricultural Engineering Sciences.
Table 1. Code, origin, and name of 59 barley accessions included in this analysis.
Studied characters
Morphological, physiological, and biochemical characteristics were tested under standard and stress conditions and abbreviated as shown in Table .
Table 2. Abbreviation and unit of different characteristics for barley accessions.
Test of germination and phenotypic traits
To determine the tolerance to water stress during germination, the seeds were soaked in a 1% sodium hypochlorite solution for 11 min and then washed five times with purified water. Whatman papers were sterilized in an autoclave. Twenty seeds of each accession with three replications were transferred to each disposable Petri dish with a diameter of 9 cm, in which two filter papers were placed. Nine milliliters of distilled water was applied to each Petri dish as a control treatment. Subsequently, 9 ml of the solution was added to the Petri plates for each treatment with concentrations of (10.25 and 20.5% PEG). This investigation was done out in an incubator (Daihan LabTech Co., Ltd, Korea) with the temperature maintained at about 20 ± 0.2°C. The seeds with a root length of 2 mm or more are measured as germinated seeds. On the 8th day, seedlings were taken out to assess the morphological, physiological, and biochemical parameters.
Physiological tests
Seed water content
The initial weight of each seed was registered before the start of the test to assess the quantity of water consumed by the seeds. At 40 and 64 h after sowing, the seeds (samples of 4 seeds with 3 replications) from treated samples, with or without PEG solution, were taken from each accession and weighted. This equation calculated the seed water uptake (WU):
(1)
(1) Where WU is the percentage of seed water uptake, SWAS is the seed weight after soaking with PEG or water (g), and SWBS is the seed mass (g) before soaking (initial mass) (El-Hendawy et al. Citation2019).
Electrolyte leakage and relative leaf water content
Seeds of 59 accessions, were sown in the tray boxes (22 × 16 × 5 cm3) containing loamy soil in a greenhouse with temperature sustained at about 15 ± 1.5°C. The experiment was performed on 15 November 2019. The field potential of the soil was 31%. The stress of water was applied by withholding water when the plant formed the second leaf. After four days, the soil moisture content touched 19% and the stress point was started. The barley seedlings remained in this state for a further two days until the soil moisture content reached 15%. To measure the membrane permeability of the leaves, the electrolyte leakage was calculated using the process mentioned by (Dionisio-Sese and Tobita Citation1998). Nine 4.5 cm mid-section parts of leaves with three replicates were put in test tubes comprising 9 mL of distilled deionized water. The sample tubes were held for 150 min at a temperature of 36°C and the initial electrical conductivity of the medium (EC1) was tested with an electrical conductivity analyzer (IrDA Port 8303, China). Samples were boiled for 27 min at 98°C to release the electrolytes, cooled to 23°C, and then the final electrical conductivity (EC2) was calculated. Leaf leakage was determined using the formula:
(2)
(2) Where EL is the electrolyte leakage, EC1 is the initial electrical conductivity, and EC2 is the final electrical conductivity.
To measure the relative water content of the leaves, three leaves from 12 plants were taken. Leaf samples with a mild cut of 4.5 cm were collected at a stress point of 15% of soil moisture and immediately placed in the pre-weighed tubes. All sample tubes were weighted (FW) and 12.5 mL of distilled water was added. The sample tubes were stored in the dark at 4°C for 18 h. The leaf samples were gently dried with a paper towel. The leaf samples were weighted (TW) and placed in an oven at 69°C for 87 h for drying. After drying, the leaf samples were weighted (DW) and the relative leaf water content (RWC) was estimated using the following equation (Pieczynski et al. Citation2013):
(3)
(3) Where FWS is the fresh weight of the leaf sample (g), DWS is the dry weight of the leaf sample (g), and TWS is the turgid weight of the leaf sample (g).
Biochemical tests
Total phenolic content
The fresh seedlings of the control and stress conditions were crushed in a mortar with a pestle with liquid nitrogen. Fresh powder (0.1 g) was extracted with 0.7 mL of 60% (v/v), acidic methanol (methanol + HCl in a ratio of 99: 1) and incubated at 10°C for 16 h. The mixture was centrifuged for 19 min at 14000 rpm at 4°C. The supernatant layer (extract) was used for the analysis of total phenolic content (TPC). The content of total phenolic compounds in each extract was determined according to (Djeridane et al. Citation2006; Tahir et al. Citation2019) using the Folin–Ciocalteu method with some modifications. An aliquot of 25 μL of each extract (Sample) or deionized water (Blank) was mixed with 2 mL of 1:9 Folin–Ciocalteu reagent: water (v/v) and allowed to react for 6 min and then,1.6 mL of 10% saturated Na2CO3 solution was added and allowed to stand for 53 min in the dark at 38°C. Then, the absorbance of the reaction mixture was read at 750 nm against the blank using a UV-visible spectrophotometer (UV-365, SHIMADZU, Japan). The standard solution was prepared by dissolving 9 mg of gallic acid in 9 mL of methanol to attain a final concentration of 1 mg/mL. A sequence of dilutions of gallic acid (0, 50, 100, 150, 200, 250, 300 µg/mL) had been used to produce a standard curve and linear association between the absorbance values at 750 nm and the gallic acid content was observed. The total polyphenol content (TPC) of each extract was demonstrated as the equivalent of µg gallic acid (GAE) per gram of fresh seedling by the formula:
(4)
(4) Where V is the volume of extract (mL), W is the fresh weight of the seedling sample (g), and C is the concentration of gallic acid collected from the standard curve. Each value reflects the mean of three measurements.
Total flavonoid content
Fresh seedlings were powdered in a mortar with a pestle using liquid nitrogen. Fresh powder (0.1 g) was extracted with 700 µL of 60% (v/v), acidic methanol (methanol + HCl in a ratio of 99: 1) and incubated at 10°C for 16 h. The mixture was centrifuged at 14000 rpm at 4°C for 19 min and the supernatant layer (extract) was kept and used for total flavonoid content (TFC) analysis. TFC in each extract was determined according to (Rigane et al. Citation2017; Tahir et al. Citation2019) with some modifications. A stock solution of the standard compound was prepared by dissolving 8 mg quercetin in 8 mL methanol to achieve a final concentration of 1 mg/mL. A series of dilutions (0, 2.5, 5, 10, 20, 40, 80 µg/mL) was produced. A quercetin standard curve was created and a linear regression was found between the absorption values at 415 nm and the quercetin concentrations. Briefly, the extract solution or deionized water (40 μL) was mixed with 0.90 mL of methanol (80%), 0.30 mL of 2% aluminum chloride, 0.08 mL of 1 M potassium acetate, and 1.72 mL of deionized water. After incubation at room temperature for 32 min, the absorbance of the solution was read at 415 nm using a UV-visible spectrophotometer. (UV-365, SHIMADZU, Japan). The total flavonoid content of each extract was expressed as the equivalent of µg quercetin (QE) per gram of fresh seedling matter by the formula:
(5)
(5) Where V is the volume of extract (mL), W is the fresh weight of the seedling sample (g), and C is the concentration of quercetin determined from the standard curve. Each value is the average of three measurements.
Radical scavenging activity by DPPH
Fresh seedlings were crushed in a mortar with a pestle using liquid nitrogen. Fresh material (0.1 g) was extracted with 700 µL of 60% (v/v), acidic methanol (methanol + HCl in a ratio of 99: 1), and incubated for 16 h at 10°C. The sample was centrifuged for 19 min at 14000 rpm at 4°C and the supernatant (extract) was maintained and used for the analysis of the DPPH test. The antioxidant potential of the extracts was estimated according to the method, 1- diphenyl-2-picrylhydrazyl (DPPH) radical-scavenging as defined by (Shimada et al. Citation1992; Tahir et al. Citation2019) with some improvements. The standard compound: 6-hydroxy-2,5,7,8-tetramethylchroman-2-carboxylic acid (Trolox) was used to construct the calibration curve by using a series of dilution solutions. Trolox of 11 mg was mixed with 75% ethanol solvent and it was diluted to obtain some concentrations up to 0.325, 0.650, 1.300, 1.950, 2.600, and 3.25 µg/mL. Linear regression between the absorbance values at 517 nm and the various concentrations of Trolox was identified. Three groups of tubes were prepared. Group 1 included the mixing of 2 mL of DPPH solution (6 × 10⁻⁵ M) with a 10 µL sample. Group 2 is composed of a mixture of 10 µL methanol and 2 mL DPPH solution. Group 3 contained different concentrations of Trolox with 2 mL of DPPH solution. All tubes (Sample extract, control, and Trolox) were incubated in the dark at 22°C for 35 min and absorbed against a blank containing only methanol at 517 nm using a UV-visible spectrophotometer (UV-365, SHIMADZU, Japan). The triple experiment was conducted. The antioxidant capacity of different extracts was expressed as the equivalent of Trolox per gram of fresh seedling powder by the formula:
(6)
(6) Where V is the volume of extract (mL), W is the fresh weight of the seedling sample (g), and C is the concentration of Trolox determined from the standard curve.
Soluble sugar content
Soluble sugar content was measured following the method described by (Yemm and Willis Citation1954; Zheng et al. Citation2008). A stock solution of standard compound (glucose) was prepared by adding 10 mL of deionized water to 10 mg of glucose to get a final concentration of 1 mg/mL. A series of dilutions of glucose (0, 4, 10, 20, 30, 50, 80, 160, 320, 640 µg) was prepared. Linear regression was observed between the absorbance values at 620 nm and the glucose concentrations. Fresh ground seedlings (0.1 g) were soaked in 800 μL deionized water. The solution mixture was boiled at 100°C for 30 min. then, it cooled and centrifuged for 15 min at 4000 rpm. This residue was re-extracted two more times with deionized water. Three hundred μL of the supernatant sample or standard compound (glucose) was taken and mixed with 2.7 mL of anthrone reagent (0.15 g anthrone in 84 mL of sulphuric acid and 16 mL deionized water). The mixture was boiled for 5 min. After cooling, the absorbance of the mixture was recorded at 620 nm. The content of soluble sugar was calculated from the standard curve of glucose at 620 nm using a UV-visible spectrophotometer (UV-365, SHIMADZU, Japan). The formula for calculating the soluble sugar content was
(7)
(7) Where V is the volume of extract (mL), W is the fresh weight of the seedling sample (g), and C is the concentration of glucose determined from the standard curve.
Proline content
Proline content in seedling samples is defined following the method of (Bates et al. Citation1973). Fresh seedling powder (0.1 g) was homogenized in 3 mL of 3% (w/v) sulphosalicylic acid and centrifuged at 4000 rpm for 28 min at 5°C. A two milliliters of supernatant was mixed with 2 mL of acid ninhydrin reagent (2.5 g ninhydrin in 60 mL of glacial acetic acid and 40 mL of 6 M phosphoric acid) and 2 mL of glacial acetic acid. The samples were subsequently incubated at 100°C for 60 min. The sample materials were cooled and mixed with 4 mL of toluene. The toluene layer was read at 520 nm against the blank containing toluene with a UV-visible spectrophotometer (UV-365, SHIMADZU, Japan). The standard curve of proline (1 mg/mL) was prepared, taking different concentrations of L-proline. L-proline standard solutions (0.0, 50, 100, 150, 200, 250, 300, 350, 500, 700 μg) were applied to the stopper tubes and were all diluted with water up to 1 mL. A linear regression between the absorbance values at 520 nm and the L-proline content was detected. The proline content of the seedling sample has been determined from this typical curve. Values are the results of three replicates and represented as μg/g of fresh seedlings. The formula for the determination of the proline content was
(8)
(8) Where V is the volume of extract (mL), W is the fresh weight of the seedling sample (g), and C is the concentration of proline determined from the standard curve.
Guaiacol peroxidase activity
Guaiacol peroxidase was tested using the formula mentioned in (Zheng et al. Citation2008) with some modifications. The fine powder tissue of seedlings (0.1 g) was combined with 1 mL of phosphate buffer (pH 7.0) and the mixture was separated at 4000 rpm at 4°C for 35 min. The supernatant was taken for analysis. The reaction mixture contained 25 μL of 20 mM guaiacol, 2.4 mL of 10 mM phosphate buffer (pH 7.0), 50 μL of extract. The reaction was started with the addition of 10 μL 40 mM H2O2 and the absorbance was recorded five times at 470 with 1 min interval using a UV-visible spectrophotometer (UV-365, SHIMADZU, Japan). The formula calculated the enzyme-specific activity:
(9)
(9) Where extinction coefficient = 35.86 mM−1cm−1; Δt = time change in minute; TV = total volume of the extract (mL); VU = volume used (mL); FWT = weight of the fresh seedling powder (g).
Catalase activity
Catalase was determined using the formula described by (Aebi Citation1984). Powder material of fresh seedlings (0.1 g) was homogenized in 2.5 mL of solution (50 mM Tris pH 8.0, 0.5% (v/v) Triton X-100, 2% (w/v) PVP, and 0.5 mM EDTA). The homogenate was centrifuged for 40 min at 4°C at 4000 rpm, and the resultant supernatant was dialyzed prior to enzyme assay. The reaction mixture containing 1.5 mL phosphate buffer (50 mM of phosphate buffer, pH 7) and 300 μL of enzyme extract was initiated by adding 1.2 mL of 60 mM of hydrogen peroxide. A spectrophotometer measured the absorbance at an observed rate of 240 nm for 3 min with a 1 min interval using a UV-visible spectrophotometer (UV-365, SHIMADZU, Japan). The formula calculated the enzyme-specific activity:
(10)
(10) where extinction coefficient = 6.93 × 10⁻³ mM−1cm−1 and FWT = weight of the fresh material of seedling (g)
Statistical data analysis
One-way ANOVA-CRD and Duncan’s new multiple range tests were used to assess significant variations (p ≤ 0.01 and p ≤ 0.001) among barley accessions using XLSTAT software version 2020 (Addinsoft, New York, USA). The box chart and principal component analysis plot were created using XLSTAT software. Correlation and key importance analysis were achieved by Q Research software (Market Research Software, Australia). Also, the ranking method was used to determine the best accessions by the method suggested by (Ketata et al. Citation1989), utilizing different calculated characters. The stress tolerance index (STI) and the average number of ranks (ASRs) were introduced using as the criterion for choosing the best accessions for all traits. In this assessment, each trait’s greatest performance recorded the lowest rank; thus, the best accessions were known, with the maximum STI and lowest ASR values (Pour-Aboughadareh et al. Citation2019; Rahim et al. Citation2020).
Results
Responses of plant traits to drought stress
Drought stress tolerance dependent on phenotypic characters
Under control conditions as well as under induced drought (PEG treatment), a huge significant phenotypic diversity (p ≤ 0.001) for all attributes was identified among the genotypes as indicated by the ANOVA analysis and box charts, and significant reductions were shown as the concentration of PEG increased (Table ). The measured scores of the accessions under control conditions were between 63.33–100.00% with an average of 84.34%, 5.16–15.15 cm with a mean of 10.48 cm, 6.20–12.98 cm with an average of 9.87 cm, 11.41–27.00 cm with an average of 20.34 cm and 922.15–2371.18 with an average of 1729.21 for GP, RL, SL, SEL, and SV, respectively (Table and Figure ).
Figure 1. A radar chart of phenotypic traits changes of 59 barley seedling accessions grew under control condition. The values specified are the mean values determined for the three measurements. The full name of accessions and traits is shown in Tables and .
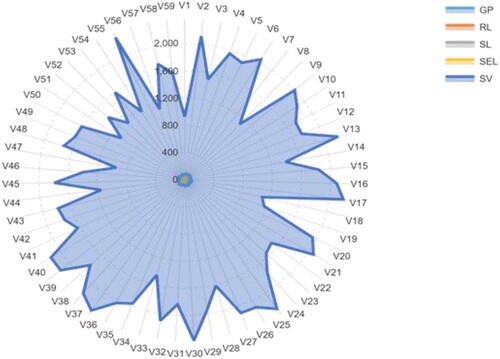
Table 3. Descriptive statistics of different traits studied in this work. The full name of the traits is shown in Table .
The vulnerability of barley to PEG was, also, shown by all aspects of morphological data. At T10.25 stress condition, the average values of GP, RL, SL, SEL, and SV were ranged between 20.00–100.00% with a mean of 71.98%, 3.56–14.54 cm with an average of 8.46 cm, 1.95––10.50 cm with a mean of 7.20 cm, 7.56–23.54 cm with a mean of 15.66 cm and 217.50–2158.00 with an average of 1150.80, respectively (Table and Figure ). The mean values of the accessions were varied between 10.00–96.67% with an average of 50.20%, 0.86–9.24 cm with a mean of 4.87 cm, 0.30–5.60 cm with a mean of 2.68 cm, 1.16–14.21 cm with an average of 7.56 cm and 16.59–1165.13 with a mean of 418.76 for GP, RL, SL, SEL, and SV, respectively, under induced drought stress (T20.50) (Table and Figure ). The box charts of all traits illustrated significant variations between T0.00 (control), T10.25, and T20.50, as shown for each characteristic by the lower and upper box plot limits (Figure ). The barley accessions had significantly higher trait values under normal conditions compared to stressed plants. These reports indicated that following exposure to T20.50, germination and seedling growth parameters depression were more serious for all accessions.
Figure 2. A radar diagram with phenotypic characteristic variations of 59 barley seedling accessions developed under the T10.25 stress condition. The values indicated are the averages determined for the three measurements. The whole name of the accessions and characteristics is described in Tables and .
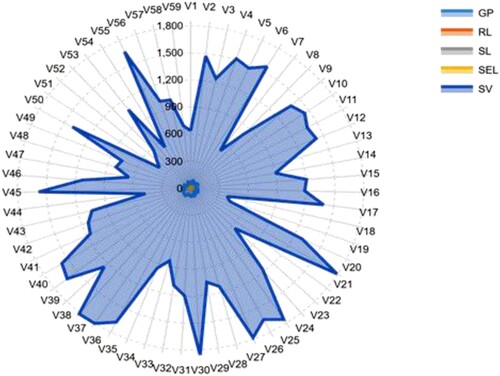
Figure 3. A radar graph of the phenotypic characteristics of 59 barley seedling accessions was conducted under the stress condition of T20.50. The values given are the averages determined for the three measurements. The full name of these accessions and characteristics can be found in Tables and .
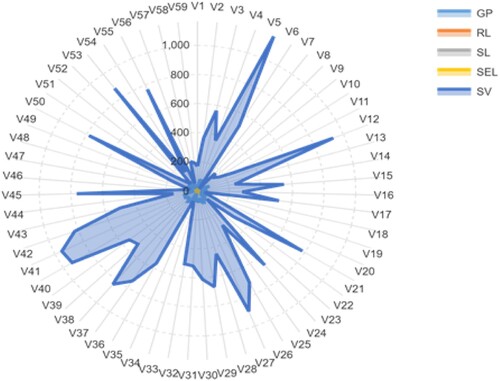
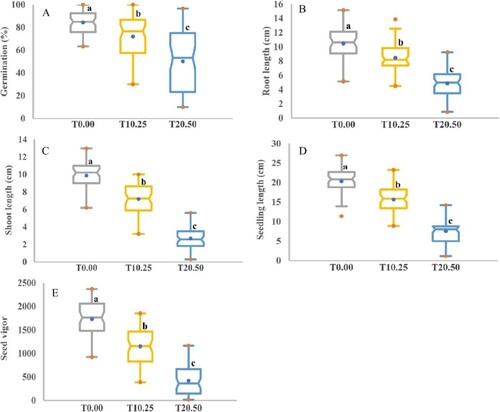
Figure 4. The graph box illustrates the variation in phenotypic traits under control and stress conditions. (A) Germination percentage, (B) Root length, (C) Shoot length, (D) Seedling length, and (E) Seed vigor. The values specified are the mean values determined for the three measurements collected for control (T0.00) and PEG concentrations (T10.25 and T20.50). Different letters represent a significant difference between the mean values according to Duncan’s Multiple-Range Test (p ≤ 0.01). A blue dot in the box indicates the mean, while red dots represent the minimum and maximum values.
Drought stress tolerance reliant on physiological traits
Drought stress has significantly impacted plant physiological characteristics. Significant differences in seed water uptake between the tested accessions were noticed (Table and Figures ). The estimated scores of the controlled accessions were between 92.72–210.83% with an average of 138.70% and 108.82–351.00% with an average of 184.76% for WU-40 and WU-64, respectively. The sensitivity of barley to PEG was exposed by all characteristics of physiological data. At T10.25 condition, the average values of WU-40 and WU-64 were extended between 52.74–198.14% with a mean of 112.26% and 36.76–383.11% with an average of 147.03%, respectively. The mean accession values varied between 38.09 and 141.20% with an average of 87.45% and between 51.47 and 216.98% with an average of 102.94% for WU-40 and WU-64 respectively under induced dry stress of T20.50. The trait charts showed significant differences between T0.00 (control), T10.25, and T20.50, as revealed by the lower and upper box limits for each physiological attribute (Figure ). The barley accessions had significantly higher trait values under normal conditions compared to stressed seedlings.
Figure 5. Physiological and biochemical behavior of seedling of 59 barley accessions under stress-free conditions. The values indicated are the averages determined for the three measurements. The entire name of the accessions and characteristics is presented in Tables and .
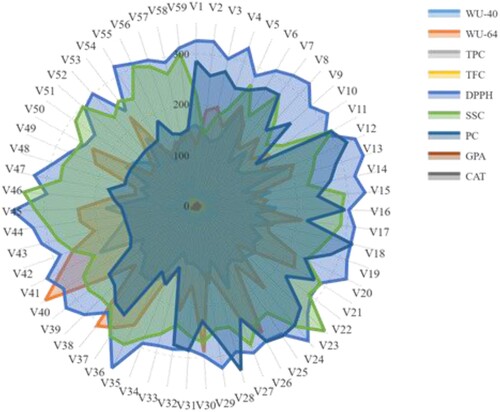
Figure 6. Radar chart displaying the physiological and biochemical response profiles of 59 accessions of barley exposed to 10.25% PEG. The displayed values are the averages for the three measurements. The full name of the accession and characteristics is furnished in Tables and .
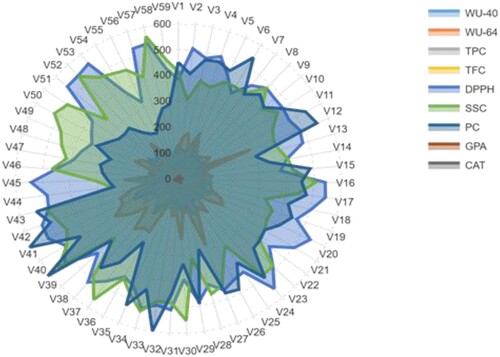
Figure 7. Radar diagram with physiological and biochemical reaction profiles of 59 barley accessions subjected to a PEG of 20.50%. The values displayed are the average values of the three measurements. The entire name of the accession and characteristics is provided in Tables and .
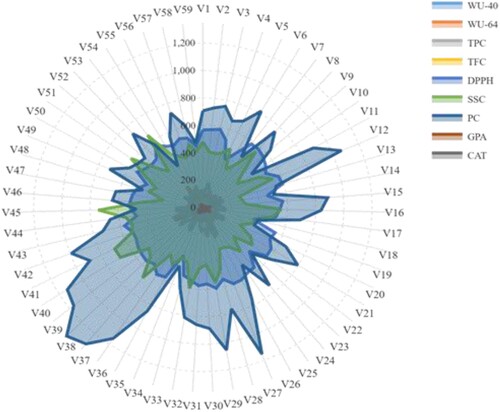
Figure 8. Box graph demonstrating the variation in physiological traits. (A) Seed water uptake after 40 h of sowing, (B) Seed water uptake after 64 h of sowing, (C) Electrolyte leakage, and (D) Relative water content in barley under optimal and stress conditions. The values given are the mean values obtained for the three measurements for control (T0.00) and PEG concentrations (T10.25 and T20.50). Different letters designate a significant variation between box mean values by Duncan’s Multiple-Range Analysis (p ≤ 0.01). A blue dot in the box denotes the mean value. Red dots symbolize the minimum and maximum values.
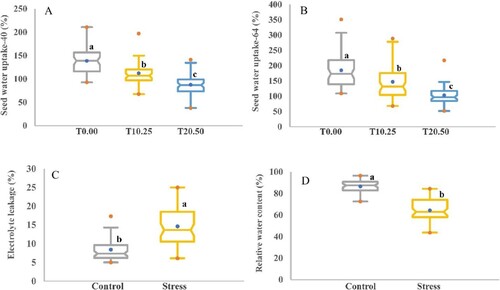
Drought stress had a significant effect on the physiological features of the leaves (EL and RWC). The difference between the leak values of leaf electrolytes (EL) and the relative water content of the leaves (RWC) is shown in Figure C and D for 20-day seedlings under normal conditions and dehydration (water deficiency). The range representing the lower and upper deviation limits of the mean value in the EL box plot is greater in the stressed condition than in the control condition. When treated with water stress, EL in stressed barley leaves was increased by 1.74% relative to unstressed barley leaves. Nevertheless, the determined mean under dehydration stress for RWC was drastically decreased compared to the control group. This is largely supported by the highly significant data analysis obtained by ANOVA and Duncan test for the control vs. water deficiency treatment mentioned in Table . The calculated mean values for RWC were 86.54% and 64.37%, respectively, for optimal and stress conditions. Under the water stress condition, RWC was significantly declined by 26% related to non-stressed plants.
Drought stress tolerance through biochemical characteristics
Validation of drought tolerance by non-enzymatic stress markers
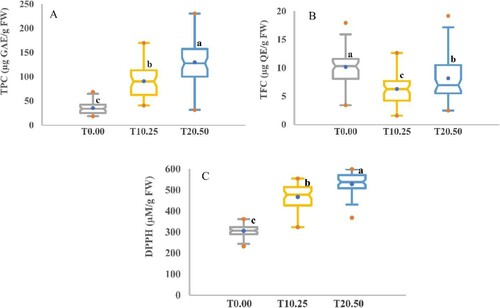
Biochemical analysis of seedlings found that the biochemical profiles in the different accessions had the same patterns concerning the treatments, but with substantial quantitative variations, and the results are illustrated in Table and Figures and . The stresses influenced biochemical parameters significantly, and the differences were mainly related to the accessions. In seedlings of all accessions under induced drought, TPC and DPPH were gradually affected by drought stress. In this study, TPC and antioxidant potential (DPPH) significantly improved with an increase in the severity of PEG stress in the sequence of T0.00 < T10.25 < T20.50. In T10.25 and T20.50, TPC and DPPH were augmented by (2.58% and 3.69%, respectively) and (1.53% and 1.73%, respectively) compared to T0.00 conditions. This study found slight differences in TFC among the studied accessions. Broadly, the average TFC value in the control samples (T0.00) produced 10.16 mg QE/g FW, whereas, in the induced drought stress, the TFC reached 6.26 and 8.17 mg QE/g FW for T10.25 and T20.50, respectively.
Figure 9. Box chart analysis of the distinction of the non-enzymatic stress markers in barley seedlings. (A) Total phenol content (TPC), (B) Total flavonoid content (TFC), and (C) Antioxidant assay in barley accessions under control and drought stress. The values given are the mean values obtained for the three measurements for control (T0.00) and PEG concentrations (T10.25 and T20.50). Different letters represent a significant difference between the mean values according to Duncan’s Multiple-Range Test (p ≤ 0.01). A blue dot in the box indicates the mean, while red dots represent the minimum and maximum values
Validation of drought tolerance by osmolyte contents
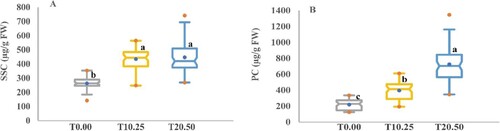
Under drought stress, plants generate and store suitable solutes, including carbohydrates, polyols, and amino acids, to promote osmotic equilibrium and absorption and retention of water (Hussain et al. Citation2018). The amount of SSC and PC contents was measured to ascertain whether barley responds to the low water potential caused by PEG. SSC and PC had considerable variations in their contents under control and stimulated stress conditions. As predicted, the concentration of SSC in the medium with 10.25% and 20.50% PEG increased significantly across all accessions by 1.65 and 1.70 times, respectively, compared to the PEG-free medium (Table and Figures , and ). The results disclosed that the PC in barley seedlings significantly augmented by increasing the PEG concentrations and the medium containing 20.50% of PEG displayed the maximum amount of proline compared to the PEG-free medium. Consequently, it improved by 3.31 times compared to the PEG-free medium. SSC and PC varied from 263.44 to 447.18 µg/g FW and 219.68–726.25 µg/g FW, nevertheless, the amount of these compounds increased sharply and significantly from T0.00 to T10.25 and T20.50 as evidenced by the order: T0.00 < T10.25 < T20.50.
Figure 10. Boxplot analysis of the osmoprotective substance variation. (A) Soluble sugar content (SSC) and (B) Proline content (PC) in 59 barley accessions under control and drought stress conditions. The values presented are the mean values obtained for the three measurements for control (T0.00) and PEG concentrations (T10.25 and T20.50). Different letters indicate a significant difference between box mean values by Duncan’s Multiple-Range Analysis (p ≤ 0.01). A blue dot in the box signifies the mean value. Red dots symbolize the minimum and maximum values.
Accession validation of the PEG tolerance by antioxidant enzymatic stress markers
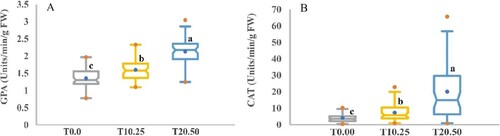
The antioxidant enzyme’s results are presented in Table and Figures , and . The enzyme’s activities of barley seedlings were progressively affected by stimulated drought stress; however, GPA and CAT were sharply and statistically enlarged with the harshness of PEG stress showing the order: T20.50 > T10.50 > T0.00. GPA and CAT ranged from 1.36 to 2.13 unit/min/g FW with the highest GPA and CAT were recorded in T20.50 stress and the lowest in the control condition. Further, in T10.25 and T20.50, the increase in GPA and CAT activities were (1.18 and 1.57%) and (1.79 and 4.83%), respectively, over the control condition.
Figure 11. Boxplot analysis of variation of the antioxidant enzyme activity. (A) Guaiacol peroxidase activity (GPA) and (B) Catalase activity in barley accessions under control and drought stress. The determined values are the average values calculated from three measurements for control (T0.00) and PEG concentrations (T10.25 and T20.50). Diverse letters designate a significant disparity between box mean values by Duncan’s Multiple-Range Analysis (p ≤ 0.01). A blue dot in the box symbolizes the mean value. Red dots indicate the minimum and maximum values.
Ranking of accessions for germination percentage and seedling elongation under PEG stress conditions
The ranking method was performed based on germination percentage and seedling length (root length + shoot length) to recognize the best accessions utilizing specific tested traits according to the procedure developed by (Ketata et al. Citation1989). The average sum of ranks (ASR) has been used as a predictor for choosing the best accessions for germination and seedling growth (Pour-Aboughadareh et al. Citation2019). The direction of accessions from PEG resistant > susceptible was MORA (V36) > ABN (V37) > MSEL (V27) > … … … … … Abrash (V51) > Black-Bhoos Akre (V18) > Black-Zaxo (V19) for T10.25 condition and ABN (V37) > Bhoos-H1 (V40) > MORA (V36) > … … … … White-Zarayan (V50) > Black-Garmiyan (V47) > Black-Zaxo (V19) under T20.50 treatment (Tables and ). For both stress conditions (T10.25 and T20.50), the accessions resistance/susceptibility rating according to their germination parameters was as follows: PEG resistant > susceptible, ABN (V37) > MORA (V36) > MSEL (V27) > … … … Bujayl 2-Shaqlawa (V52) > Al-warka (V7) > Black-Garmiyan (V47). The mean value of the investigated characters of both PEG stress states was measured and presented in Table for comparison between the best performance variant (tolerant to PEG) and the lowest performance variant (sensitive to PEG). As shown in Table , all traits studied (phenotypic, physiological, and biochemical properties), except for TFC, were significantly higher in the highest performing ABN (V37) accession than in the lowest-performing Black-Garmiyan (V47) accession.
Table 4. Rank of 59 barley accessions determined by stress tolerance index (STI) and an average number of ranks (ASR), depending on germination percentage and growth characteristics of seedlings under T10.25.
Table 5. Rank of barley accessions calculated by stress tolerance index (STI) and an average number of ranks (ASR) based on germination percentage and growth characteristics of seedlings under stress condition T20.50.
Table 6. Rank of barley accessions measured by stress tolerance index (STI) and the average number of ranks (ASR) relying on germination percentage and seedling growth characteristics under both stress conditions (T10.25 and T20.50).
Table 7. Average values of studied traits under control, T10.25 and T20.50 conditions for best performance accession and least performance accession.
Relationship analysis of traits under control and induced drought conditions
Association among different characters
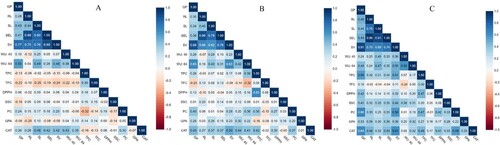
Pearson correlations (r) of the studied traits under non-stressed and stressed conditions are determined from their mean values and described in Figure . Under the control conditions, 24 significant positive and negative r values (between 0.28 and 0.89) have been registered, 2 for WU-40, 5 for WU-64, 4 for GP, 4 for RL, 3 for SL, 2 for SEL, 1 for SV, 2 for TPC and 1 for PC of the 7-day-old seedlings. Positive correlations were noted for most characteristics tested. Similarly, SEL stated strong positive correlations with SV (r = 0.89***, p = 0.0001) and RL (r = 0.89***, p = 0.0001). Positive and negative associations were observed under induced drought of T10.25 treatment. Some phenotypic and biochemical characteristics are significantly correlated. Furthermore, 39 important r-values (significant and highly significant) with a diversity of 0.26–0.88 were reported. Out of 39 significant r-values, only 10 revealed highly significant r values were ≥ 0.5 for GP, SEL, SV, DPPH and CAT traits. GP and WU-64 also significantly correlated with most of the traits. GP and SV had the highest positive significant r-value (r = 0.88***, p = 0.000), followed by SL and SEL (r = 0.78***, p = 0.000), SV and SEL (r = 0.76***, p = 0.000). Negative correlation between WU-64 and TFC (r = −0.32*, p = 0.013) was significant. Correlation coefficient calculations under greater osmotic stress (T20.50) showed there were significant positive and negative correlations among observed traits. A total of 60 significant r values were detected among the observed characters. The r values were varied from 0.27 to 0.96. GP significantly correlated with 11 characters: WU-64, RL, SL, SEL, SV, TPC, DPPH, SSC, PC, GPA, and CAT, followed by RL, which was aligned with 9 traits, GP, SL, SEL, SV, TPC, SSC, PC, GPA, and CAT. A strong positive significant association between SEL and RL traits (r = 0.96***, p = 0.000) followed by SEL and SL (r = 0.91***, p = 0.000), SV and GP (r = 0.91***, p = 0.000) was observed.
Figure 12. Pearson correlation (r) of fourteen growth, physiological and biochemical parameters dependent on their values in non-stressed and stressed conditions. (A) T0.00, (B) T10.25, and (C) T20.50. The whole name of the characteristics is given in Table .
Relationship between different traits and accessions
To further clarify the quantitative relationship between morphological, physiological, and biochemical parameters, PCA was conducted using stressed and unstressed plant values of morphological, biochemical, and physiological characters to assess their involvement in drought tolerance (Grzesiak et al. Citation2019).
In each principal component, the differential influence of the variables is calculated by the association between each variable and the main component. As marked in Figure A, under the optimal condition the first primary component (PC1) described roughly 28.40% of the variation and positively influenced by phenotypic traits (GP, RL, SL, SEL, and SV), physiological trait (WU-64), and biochemical parameter (CAT), which were positively correlated with the first component. The second main component (PC2) clarified 12.25% of the variance, which was positively correlated with TPC and negatively associated with the PC trait.
Figure 13. Principal component analysis (PCA) plot presents the spreading and association between barley accessions and studied traits. (A) Normal condition, (B) T10.25 stress, and (C) T20.50 stress. The complete name of the accession and characteristics is shown in Tables and .
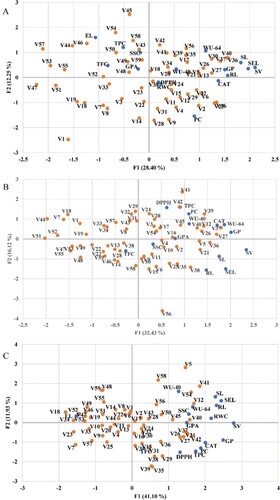
At T10.25 stress, PC1 and PC2 could hold together 48.55% (32.43% by PC1 and 16.12% by PC2) of the initial variation (Figure B). Among the measured traits in PC1, GP, SL, SEL, SV, WU-64, and CAT were responsible for the maximum variation, while RL, TPC, DPPH, and PC were liable for the highest variances in PC2. GP, SL, SEL, SV, WU-64, and CAT were responsible for the differentiation of MORA (V36), ABN (V37), V40 (Bhoos-H1), BN2R (V41), BN6 (V12), 16 HB (V5), Bhoos-912 (V21), CANELA (V26), and MSEL (V27), situated on the right side of the PC1. Those accessions were characterized by the highest values of GP, SL, SEL, SV, WU-64, and CAT and considered the highest tolerant plants. Alternatively, the accessions located on the left side of the PCA plot, especially Shoaa (V1), Al-warka (V7), Black-Bhoos Akre (V18), Black-Zaxo (V19), Black -Kalar (V44), Abrash (V51), Black-Garmiyan (V47), Rehaan (V55), Black-Chiman (V48), and Bujayl 2-Shaqlawa (V53) were categorized by the lowest values of GP, SL, SEL, SV, WU-64, TPC, DPPH, PC, SSC, GPA, and CAT and considered the lowest tolerant accessions under T10.25 condition. Under the T20.50 conditions, the first two components jointly explained 53.03% of the observed variation, therefore, represented in a two-dimensional space (Figure C). PC1 plotted on the horizontal axis accounted for the largest proportion of variance (41.10%), while PC2 plotted on the vertical axis represented an additional 11.93% of the variance. The maximum variation along PC1 was explained by GP, RL, SL, SEL, SV, TPC, SSC, PC, CAT, and RWC, which appeared to be positively associated with drought stress, as they were placed on the right side of the horizontal axis reflecting PC1. GP, RL, SL, SEL, SV, TPC, SSC, PC, CAT, and RWC were then considered responsible for discriminating the tolerant-plant group, located to the right side of PC1. Thereby, this group was distinguished by accessions with higher potential to germinate under adverse conditions and with the greatest values of GP, RL, SL, SEL, SV, TPC, SSC, PC, CAT, and RWC. Furthermore, the PCA graph discriminated the accessions that tended to the left side of the biplot, namely Al-warka (V7), Black-Garmiyan (V47), Samr (V23), Black-Bhoos Baghdad (V33), Black-Bhoos Akre (V18), Irani (V34), Bujayl 1-Shaqlawa (V52), and IBAA- 995 (V59), whose accessions were considered the group of sensitive accessions and were described as having the lowest ability to germinate under low water availability.
Key driver analysis of different studied characters
The key driver analysis or analysis of relative importance determines the importance of each physiological and biochemical trait (independent variable) in predicting a phenotypic trait (dependent variable). Each predictor is commonly referred to as a driver and explores the correlations between the variables.
Importance of the physiological and biochemical traits under T10.25 stress
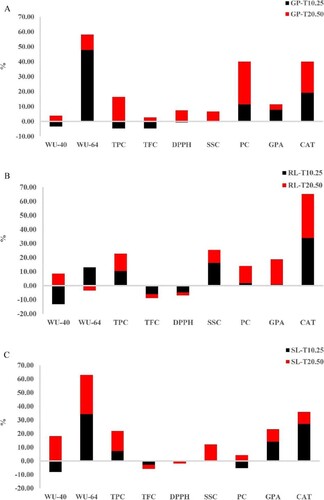
WU-64, PC, GPA, and CAT rated favorable relative values for GP in order from highest to lowest: WU-64 > CAT > PC > GPA, while WU-40, TFC and TPC had slightly negative scores (Figure A). WU-64 and TFC had the highest positive (47.73%) and negative (−4.68%) values for seed germination, respectively, indicating that WU-64 had the maximum influence in determining GP and increasing TFC levels, thereby reducing GP germination rates (Winkel-Shirley Citation1998, Citation2001). Regarding the RL characteristic, WU-64, TPC, SSC, PC, GPA, and CAT evidenced positive relative significance, while WU-40, TFC, and DPPH expressed negative values (Figure B). CAT reported the largest positive effects (33.87%), followed by SSC (16.08%), while WU-40 (−13.15%) documented the highest negative impact. Four positive and five negative relative importance scores were reported as effective physiological and biochemical characteristics of the SL trait (Figure C). The greatest positive effects on SL were observed in WU-64, CAT, and GPA, where the negative impacts of WU-40 and PC on the SL character were detected.
Figure 14. Key driver analysis demonstrating the significance of the physiological and biochemical features in barley seedlings under stress conditions. (A) Relative importance score for germination percentage, (B) Relative importance score for root length, and (C) Relative importance score for shoot length (SL). The full name of the traits is presented in Table .
Effectiveness of the physiological and biochemical characters under T20.50 stress
All physiological and biochemical characters showed positive importance values on GP. The ranking of characteristics from the most important to the least important for the GP trait was as follows: PC > CAT > TPC > WU-64 > DPPH > SSC > WU-40 > GPA > TFC (Figure A). Six positive and three negative values were observed for RL characteristic. The order of the positive values from the highest to the minimum effect was as follows: CAT > GPA > TPC > PC > SSC > WU-40 (Figure B). Conversely, the rank of independent variables, in terms of their effects on RL, was ranged from the greatest negative influence to the lowest negative influence as follows: WU-64 > TFC > DPPH. Relating SL, seven positive importance values for WU-40, WU-64, TPC, SSC, GPA, CAT, and PC were detected (Figure C). TFC and DPPH stated the negative impacts on SL. The ranking of characters from the positive greatest importance to the positive lowest importance for SL was as follows: WU-40 > WU-64 > TPC SSC > GPA > CAT > PC. These results suggest PC, CAT, TPC, and WU traits were more important for GP, RL, and SL characters under T20.50 conditions.
Discussion
Effective screening to differentiate between drought-tolerant and drought-sensitive genotypes based on easily measurable traits can help investigate the stress capacity of barley accessions. The reaction of plants to drought is the product of dynamic and diverse adaptations. Consequently, it should be studied at a level ranging from morphological and physiological changes in organs to complex reactions to gene expression and regulation rates and biochemical reactions at the cell and organ level. The present study showed natural variations between the studied accessions, which exhibited different growth characteristics in the control and stress conditions of the fifty-nine accessions, and significant decreases were noted as the concentration of PEG increased. These results are in line with previous studies and provide further evidence of the suitability of PEG as a molecule for simulating droughts under in vitro conditions. These findings are like previous research and show the response to droughts depends on both genotypes and levels of stress (Almansouri et al. Citation2001; Cai et al. Citation2020). It is generally known that the first step of drought-imposed moisture deficiency is disrupted germination, resulting in poor plant standing at the early seedling level and impeding early crop development. It was noticed that a decrease in the germination percentage and seedling growth with a rise in PEG concentrations (reduction in water potential) may be attributed to low environmental hydraulic conductivity, the high viscosity of the medium in which the solubility and diffusion of oxygen have been decreased, whereby PEG 6000 causes water unavailable to seeds, disrupting seed imbibition processes that are important for germination. The reduction of seedling growth is the result of cell division and enlargement restrictions, which are due to reduced water absorption (Fraser et al. Citation1990; Wu et al. Citation2019; Basal et al. Citation2020; Koskosidis et al. Citation2020). The outcomes of this research were in line with the reporting of the (Hellal et al. Citation2018; Thabet et al. Citation2018; Xue et al. Citation2019). For both stress states, the resistance/susceptibility of the accessions was assessed according to their germination parameters as follows: PEG-resistant > susceptible, ABN (V37) > MORA (V36) > MSEL (V27) > … … … > Bujayl 2-Shaqlawa (V53) > Al-warkaa (V7) > Black-Garmiyan (V47). In both stress environments, ABN grew better than the other accessions, exhibiting greater tolerance to osmotic stress, while Black-Garmiyan displayed the lowest germination and growth performance accession under drought stress treatments.
Many methods are available to investigate the reactions of plants to water shortages. One of these methods is the water absorption process, which contributes to breaking down stored starch and protein into soluble sugars to provide energy and nutrients for germinating seeds. So, we hypothesized the water uptake trend during seed germination could provide valuable information on the early growth stage mechanisms of PEG tolerance in barley. It has been observed a decline in seed water uptake with an improvement in PEG concentrations can be due to the high viscosity of the medium in which the diffusion of water has decreased, whereby PEG 6000 render water inaccessible to seeds and interrupts seed imbibition processes.
Dehydration of plant tissues has harmful effects on many processes of biosynthetic pathways, like chlorophyl synthesis, functional and structural adjustments in the chloroplast, disruption in the aggregation and distribution of assimilation products, and even on some biological activities, in specific changes in the capacity of the leaf water and photosynthesis. The reduction in RWC in this study initially leads to stomatal closure, decreasing the supply of CO2 to the mesophyll cells and subsequently a decrease in photosynthesis rates (Flexas and Medrano Citation2002; Lawlor and Cornic Citation2002; Zhang Citation2011). Measuring electrolyte leakage in leaves is an effective way to evaluate the sensitivity to drought stress because drought induces the loosening of lamellar membranes in the chloroplast and raises coarse grain matrix rates (Palta Citation1990; Grzesiak et al. Citation2019). Oxidative stress is one of the significant causes of reduced development under stress conditions. Lipid peroxidation also used to measure oxidative stress damage in plants, is one of the major damages caused by oxidative stress. Membrane lipid peroxidation typically weakens the membranes, which allow minerals and other essential cellular metabolites to leak out of the cells, leading to cell death (Cruz de Carvalho Citation2008). ROS-activated, outward-facing K+ channels are responsible for the K+ release from plant cells (an essential component of electrolyte leakage). Ion channel-mediated K+ efflux can lead to K+ loss that triggers programed cell death (Demidchik et al. Citation2014). Thus, a significant increase in EL, especially in plants under severe water stress, where the rate was about 3-fold relative to control plants, could be the main cause of growth impairment in barley under water deficit conditions.
TPC in this study was 2.58 and 3.69 times higher in T10.25 and T20.50 compared to normal conditions. Several researchers have documented elevated levels of antioxidant activity, polyphenol, and flavonoid, with extreme drought stress. The bioactivity of phenolic molecules is considered a signal trigger that leads to protective mechanisms against ROS attack by acting as an antioxidant agent to reduce the generation of cell-damaging oxidants like free radicals (Akula and Ravishankar Citation2011; Nichols et al. Citation2015; Quan et al. Citation2016; Tani et al. Citation2019; Piasecka et al. Citation2020). In our study, a slight decrease in TFC in stressed seedlings was observed, possibly due to decreased expression of some genes related to the biosynthesis of total flavonoids in the phenylpropanoid pathway in stressed seedlings such as chalcone synthase and stilbene synthase. Therefore, the transformation line of P-coumaroyl CoA into phenolic compounds including sinapic acid, ferulic acid, and lignin units may be more active than the transformation line of P-coumaroyl CoA into malonyl CoA, converted into flavonoid compounds. For this reason, the stressed seedlings contained substantial amounts of TPC and lower amounts of TFC. Furthermore, the accumulation of some plant hormones such as gibberellin in stressed seedlings negatively influences the total content of flavonoids (Yuan et al. Citation2012).
In our results, SSC was boosted by 1.65-fold and 1.70-fold under T10.25 and T20.50 treatments, compared to T0.00 treatment. In osmotic adjustment, proline and soluble sugars were inferred as an adaptive reaction to drought stress (Bandurska Citation2001). SSC has several roles including osmotic modification, carbon preservation, detoxification of reactive oxygen species, defense of membrane integrity, safety of DNA structures, and protein stabilization. In serious dehydrated conditions, sugars become an important water substitute, perhaps more than proline, for the hydration of proteins (Bowne et al. Citation2012). In this study, PC was extended 1.81 and 3.31 times in both states of stress, compared to the optimal state. Proline is osmotic, playing a significant role in the stabilization of the membrane. It also works by scavenging free radicals and syncing the redox ability of the cells, which allows plants to fight abiotic stress (Marcińska et al. Citation2013).
As the results show, CAT activity improved 1.79 times in T10.25 and 4.83 times in T20.50 compared to non-stress conditions. These results are following the reports of (Hasanloo et al. Citation2013) who reported that drought stress triggered a rise in GPA and CAT activities in barley genotypes. One of the first reactions of the plant to abiotic stress is the accumulation of ROS, which acts as a signal molecule inside the dynamic network of the process of stress response in the plant. Prolonged stress, however, may induce ROS aggregation at the plasma membrane, and resultant damage to cells. Therefore, to minimize the ROS generation, the plant needs the up-regulation of antioxidant/detoxifying systems including APX, SOD, CAT, and POD (Barna et al. Citation2003; Zhang et al. Citation2015).
As suggested in this study, all traits (phenotypic, physiological, and biochemical characteristics) except TFC in the best performance accession (ABN-V37) were significantly greater than those obtained from the lowest performance accession (Black-Garmiyan-V47). A correlation between the physiological trait (WU) and some biochemical traits was observed concerning the comparison between the best and the worst performing accessions. ABN accession had a higher WU compared to the lowest-performing accession (Black-Garmiyan), suggesting that ABN accession had a more efficient water absorption, which may be related to the increase in PC, SSC, and TPC, demonstrating that the drought tolerance of this accession is related to the accumulation of osmolytes and phenolic compounds that enhanced their water status.
In this analysis, high associations have been reported for WU-64, GP, RL, and SL with the most traits under normal and stressful conditions, suggesting that these traits are highly genetically regulated. Thus, concentrating on these variants will provide knowledge to determine the genetic diversity of seedling traits in barley accessions to accurately test many genotypes in a limited period. Another primary goal of this research is to classify barley accessions according to their response to drought stress. The 59 accessions were represented in the PCA scattered plot with the characters studied. The classification of the accessions of the PCA plot showed that the ABN and MORA accessions with the highest values of the best-studied traits and the Black-Garmiyan and Alwarka accessions with the lowest values of the parameters studied were grouped as two distinct classes.
According to the results of key importance analysis, WU, TPC, SSC, and CAT were rated as the favorable relative importance traits for GP, RL, and SL under stress conditions. The positive and negative effects of proline in plants under stress conditions rely on the severity of drought stress and the amount of proline. Proline at low concentrations had beneficial effects on seedling production, whereas, at higher concentrations, it acts as a detrimental factor and slows plant growth (Roy et al. Citation1993; Hayat et al. Citation2012).
The selection of potential germplasm is the first step in testing of genetic variations for drought tolerance in different accessions. The results of this study showed a high genetic variation between the barley accessions in response to drought stress. From this view, the advantage of screening different accessions in drought conditions is to select the superior accession for drought resistance and to use it as a parent in the cross-breeding program to create a new variety suitable for the region that has rainfall limitation.
Conclusion
Natural stress tolerance is a complex phenomenon involving various physiological and biochemical processes. Germination and seedling growth assessment were conducted under induced osmotic stress mediated by PEG treatments as a reflective basis for drought tolerance of selected accessions. All PEG concentrations significantly minimized germination and seedling early growth. The results of this study showed that the reactions of barley seeds to PEG-induced drought stress initially revealed a reduction in WU and an increase in the content of osmolytes, non-enzymatic and enzymatic compounds. Based on the results, the ABN accession seems the most tolerant, while the Black-Garmiyan accession was most susceptible to PEG stress. ABN has expressed the smallest decrease in seedling growth and physiological traits, although there is a significant increase in biochemical traits except for TFC. According to key importance analysis, WU, TPC, SSC, and CAT are ranked as favorable relative importance traits for GP, RL, and SL under stress conditions. In summary, the use of germination and seedling traits is a cost-effective solution for the rapid identification of tolerant or sensitive barley accessions for a limited period. Further research based on metabolic modifications (secondary metabolites and proteomic profiles) in accessions with many stress tolerance levels is therefore proposed to provide valuable empirical data for a deeper understanding of the function of different metabolites in habituation to harsh environments. ABN and Black-Garmiyan could be evaluated in field environments as a future project to identify a link between in vitro and field reactions of both accessions.
Acknowledgments
The authors thank the Department of Horticulture of the College of Agricultural Engineering Sciences for their support and help.
Disclosure statement
No potential conflict of interest was reported by the author(s).
Data availability statement
The row data supporting the results of this investigation is available in the link: https://datadryad.org/stash/share/1DEi9CDOjbaa07_xmuR0rd6kprSBcofbQEp1G6fUrf4. DOI: 10.5061/dryad.vx0k6djqc.
Authors' contributions
DL and NT carried out the experiments and analyzed the data. NT and KM designed the experiments and wrote the manuscript.
References
- Aebi H. 1984. Catalase in vitro. Meth Enzymol. 105:121–126.
- Akula R, Ravishankar GA. 2011. Influence of abiotic stress signals on secondary metabolites in plants. Plant Signal Behav. 6:1720–1731.
- Almansouri M, Kinet J-M, Lutts S. 2001. Effect of salt and osmotic stresses on germination in durum wheat (Triticum durum Desf.). Plant Soil. 231:243–254.
- Amini R. 2013. Drought stress tolerance of barley (Hordeum vulgare L.) affected by priming with PEG. Int J Farm Alli Sci. 2:803–808.
- Bandurska H. 2001. Does proline accumulated in leaves of water deficit stressed barley plants confine cell membrane injuries? II. Proline accumulation during hardening and its involvement in reducing membrane injuries in leaves subjected to severe osmotic stress. Acta Physiol Plant. 23:483–490.
- Barna B, Fodor J, Pogány M, Király Z. 2003. Role of reactive oxygen species and antioxidants in plant disease resistance. Pest Manag Sci. 59:459–464.
- Basal O, Szabó A, Veres S. 2020. PEG-induced drought stress effects on soybean germination parameters. J Plant Nutr. 43:1768–1779.
- Bates LS, Waldren RP, Teare ID. 1973. Rapid determination of free proline for water-stress studies. Plant Soil. 39:205–207.
- Bowne JB, Erwin TA, Juttner J, Schnurbusch T, Langridge P, Bacic A, Roessner U. 2012. Drought responses of leaf tissues from wheat cultivars of differing drought tolerance at the metabolite level. Mol Plant. 5:418–429.
- Cai K, Chen X, Han Z, Wu X, Zhang S, Li Q, Nazir MM, Zhang G, Zeng F. 2020. Screening of worldwide barley collection for drought tolerance: the assessment of various physiological measures as the selection criteria. Front Plant Sci. 11:1159.
- Cruz de Carvalho MH. 2008. Drought stress and reactive oxygen species: production, scavenging and signaling. Plant Signal Behav. 3:156–165.
- Demidchik V, Straltsova D, Medvedev SS, Pozhvanov GA, Sokolik A, Yurin V. 2014. Stress-induced electrolyte leakage: the role of K+-permeable channels and involvement in programmed cell death and metabolic adjustment. J Exp Bot. 65:1259–1270.
- Dionisio-Sese ML, Tobita S. 1998. Antioxidant responses of rice seedlings to salinity stress. Plant Sci. 135:1–9.
- Djeridane A, Yousfi M, Nadjemi B, Boutassouna D, Stocker P, Vidal N. 2006. Antioxidant activity of some algerian medicinal plants extracts containing phenolic compounds. Food Chem. 97:654–660.
- El-Hendawy S, Elshafei A, Al-Suhaibani N, Alotabi M, Hassan W, Dewir YH, Abdella K. 2019. Assessment of the salt tolerance of wheat genotypes during the germination stage based on germination ability parameters and associated SSR markers. J Plant Interact. 14:151–163.
- Flexas J, Medrano H. 2002. Energy dissipation in C3 plants under drought. Funct Plant Biol. 29:1209–1215.
- Fraser TE, Silk WK, Rost TL. 1990. Effects of low water potential on cortical cell length in growing regions of maize roots. Plant Physiol. 93:648–651.
- Grando S, Macpherson HG. 2005. Food barley: importance, uses and local knowledge. Aleppo, Syria: International Center for Agricultural Research in the Dry Areas.
- Grzesiak S, Hordyńska N, Szczyrek P, Grzesiak MT, Noga A, Szechyńska-Hebda M. 2019. Variation among wheat (Triticum easativum L.) genotypes in response to the drought stress: I – selection approaches. J Plant Interact. 14:30–44.
- Hasanloo T, Pazirandeh MS, Niknam V, Shahbazi M, Ebrahimzadeh Mabood H, Ghaffari A. 2013. Effects of drought and methyl jasmonate on antioxidant activities of selected barley genotypes. J Agrobiol. 30:71–82.
- Hayat S, Hayat Q, Alyemeni MN, Wani AS, Pichtel J, Ahmad A. 2012. Role of proline under changing environments: a review. Plant Signal Behav. 7:1456–1466.
- Hellal FA, El-Shabrawi HM, Abd El-Hady M, Khatab IA, El-Sayed SAA, Abdelly C. 2018. Influence of PEG induced drought stress on molecular and biochemical constituents and seedling growth of Egyptian barley cultivars. J Genet Eng Biotechnol. 16:203–212.
- Hongbo S, Zongsuo L, Mingan S, Bochu W. 2005. Impacts of PEG-6000 pretreatment for barley (Hordeum vulgare L.) seeds on the effect of their mature embryo in vitro culture and primary investigation on its physiological mechanism. Colloids Surf B. 41:73–77.
- Hussain HA, Hussain S, Khaliq A, Ashraf U, Anjum SA, Men S, Wang L. 2018. Chilling and drought stresses in crop plants: implications, cross talk, and potential management opportunities. Front Plant Sci. 9:393.
- Johnson W. 2001. Final report on the safety assessment of PEG-25 propylene glycol stearate, PEG-75 propylene glycol stearate, PEG-120 propylene glycol stearate, PEG-10 propylene glycol, PEG-8 propylene glycol cocoate, and PEG-55 propylene glycol oleate. Int J Toxicol. 20:13–26.
- Ketata HY, Yau SK, Nachit M. 1989. Relative consistency performance across environments. In: International symposium on physiology and breeding of winter cereals for stressed mediterranean environments, Montpellier, France, 1989, 3–6 July, pp. Montpellier, France: [publisher unknown].
- Khanna-Chopra R, Selote DS. 2007. Acclimation to drought stress generates oxidative stress tolerance in drought-resistant than -susceptible wheat cultivar under field conditions. Environ Exp Bot. 60:276–283.
- Koskosidis A, Khah E, Mavromatis A, Pavli O, Vlachostergios DN. 2020. Effect of PEG-induced drought stress on germination of ten chickpea (cicer arietinum L.) genotypes. Not Bot Horti Agrobo. 48:294–304.
- Kumar S, Sachdeva S, Bhat KV, Vats S. 2018. Plant responses to drought stress: physiological, biochemical and molecular basis. In: Vats S, editor. Biotic and abiotic stress tolerance in plants. Singapore: Springer Singapore; p. 1–25.
- Lawlor DW, Cornic G. 2002. Photosynthetic carbon assimilation and associated metabolism in relation to water deficits in higher plants. Plant Cell Environ. 25:275–294.
- Luo L, Xia H, Lu B-R. 2019. Crop breeding for drought resistance. Front Plant Sci. 10:314.
- Marcińska I, Czyczyło-Mysza I, Skrzypek E, Grzesiak MT, Janowiak F, Filek M, Dziurka M, Dziurka K, Waligórski P, Juzoń K, et al. 2013. Alleviation of osmotic stress effects by exogenous application of salicylic or abscisic acid on wheat seedlings. Int J Mol Sci. 14:13171–13193.
- Nichols SN, Hofmann RW, Williams WM. 2015. Physiological drought resistance and accumulation of leaf phenolics in white clover interspecific hybrids. Environ Exp Bot. 119:40–47.
- Palta JP. 1990. Stress interactions at the cellular and membrane levels. HortScience. 25:1377–1381.
- Piasecka A, Sawikowska A, Kuczyńska A, Ogrodowicz P, Mikołajczak K, Krajewski P, Kachlicki P. 2020. Phenolic metabolites from barley in contribution to phenome in soil moisture deficit. Int J Mol Sci. 21:6032.
- Pieczynski M, Marczewski W, Hennig J, Dolata J, Bielewicz D, Piontek P, Wyrzykowska A, Krusiewicz D, Strzelczyk-Zyta D, Konopka-Postupolska D, et al. 2013. Down-regulation of CBP80 gene expression as a strategy to engineer a drought-tolerant potato. Plant Biotechnol J. 11:459–469.
- Pour-Aboughadareh A, Yousefian M, Moradkhani H, Moghaddam Vahed M, Poczai P, Siddique KHM. 2019. iPASTIC: An online toolkit to estimate plant abiotic stress indices. Appl Plant Sci. 7: e11278.
- Quan N, Anh L, Khang D, Tuyen P, Toan N, Minh T, Minh L, Bach D, Ha P, et al. 2016. Involvement of secondary metabolites in response to drought stress of rice (Oryza sativa L.). Agriculture. 6:23.
- Rahim D, Kalousek P, Tahir N, Vyhnánek T, Tarkowski P, Trojan V, Abdulkhaleq D, Ameen AH, Havel L. 2020. In vitro assessment of kurdish rice genotypes in response to PEG-induced drought stress. Appl Sci. 10:4471.
- Rigane G, Ghazghazi H, Aouadhi C, Ben Salem R, Nasr Z. 2017. Phenolic content, antioxidant capacity and antimicrobial activity of leaf extracts from Pistacia atlantica. Nat Prod Res. 31:696–699.
- Roy D, Basu N, Bhunia A, Banerjee SK. 1993. Counteraction of exogenous L-proline with NaCl in salt-sensitive cultivar of rice. Biol Plant. 35:69.
- Semwal VK, Khanna-Chopra R. 2020. Enhanced oxidative stress, damage and inadequate antioxidant defense contributes towards insufficient recovery in water deficit stress and heat stress combination compared to either stresses alone in Chenopodium album (Bathua). Physiol Mol Biol Plants. 26:1331–1339. eng.
- Shimada K, Fujikawa K, Yahara K, Nakamura T. 1992. Antioxidative properties of xanthan on the autoxidation of soybean oil in cyclodextrin emulsion. J Agric Food Chem. 40:945–948.
- Singh S, Prasad SM. 2014. Growth, photosynthesis and oxidative responses of Solanum melongena L. seedlings to cadmium stress: mechanism of toxicity amelioration by kinetin. Sci Hortic. 176:1–10.
- Tahir NA, Ahmed JO, Azeez HA, Palani WRM, Omer DA. 2019. Phytochemical, antibacterial, antioxidant and phytotoxicity screening of the extracts collected from the fruit and root of wild Mt. Atlas Mastic tree (Pistacia atlantica Subsp. Kurdica). Appl Ecol Environ Res. 17:4417–4429.
- Tani E, Chronopoulou E, Labrou N, Sarri E, Goufa Μ, Vaharidi X, Tornesaki A, Psychogiou M, Bebeli P, Abraham Ε. 2019. Growth, physiological, biochemical, and transcriptional responses to drought stress in seedlings of Medicago sativa L., Medicago arborea L. and their hybrid (Alborea). Agronomy. 9:38.
- Thabet SG, Moursi YS, Karam MA, Graner A, Alqudah AM. 2018. Genetic basis of drought tolerance during seed germination in barley. PLoS One. 13:e0206682.
- Tsubo M, Walker S, Ogindo HO. 2005. A simulation model of cereal-legume intercropping systems for semi-arid regions I. Model development. Field Crops Res. 93:10–22.
- Vanani FR, Shabani L, Sabzalian MR, Dehghanian F, Winner L. 2020. Comparative physiological and proteomic analysis indicates lower shock response to drought stress conditions in a self-pollinating perennial ryegrass. PLoS One. 15: e0234317.
- Vendruscolo ECG, Schuster I, Pileggi M, Scapim CA, Molinari HBC, Marur CJ, Vieira LGE. 2007. Stress-induced synthesis of proline confers tolerance to water deficit in transgenic wheat. J Plant Physiol. 164:1367–1376.
- Veselov DS, Mustafina AR, Sabirjanova IB, Akhiyarova GR, Dedov AV, Veselov SU, Kudoyarova GR. 2002. Effect of PEG-treatment on the leaf growth response and auxin content in shoots of wheat seedlings. Plant Growth Regul. 38:191–194.
- Winkel-Shirley B. 1998. Flavonoids in seeds and grains: physiological function, agronomic importance and the genetics of biosynthesis. Seed Sci Res. 8:415–422.
- Winkel-Shirley B. 2001. Flavonoid biosynthesis. A colorful model for genetics, biochemistry, cell biology, and biotechnology. Plant Physiol. 126:485–493.
- Wu L-M, Fang Y, Yang H-N, Bai L-Y. 2019. Effects of drought-stress on seed germination and growth physiology of quinclorac-resistant Echinochloa crusgalli. PLoS One. 14:e0214480.
- Xue W, Yan J, Jiang Y, Zhan Z, Zhao G, Tondelli A, Cattivelli L, Cheng J. 2019. Genetic dissection of winter barley seedling response to salt and osmotic stress. Mol Breed. 39:137.
- Yemm EW, Willis AJ. 1954. The estimation of carbohydrates in plant extracts by anthrone. Biochem J. 57:508–514.
- Yordanov I, Velikova V, Tsonev T. 2000. Plant responses to drought, acclimation, and stress tolerance. Photosynthetica. 38:171–186.
- Yuan Y, Liu Y, Wu C, Chen S, Wang Z, Yang Z, Qin S, Huang L. 2012. Water deficit affected flavonoid accumulation by regulating hormone metabolism in Scutellaria baicalensis Georgi roots. PLoS One. 7:e42946.
- Zhang L. 2011. Strong plant-soil associations in a heterogeneous subtropical broad-leaved forest. Plant Soil. 347:211–220.
- Zhang M, Jin Z-Q, Zhao J, Zhang G, Wu F. 2015. Physiological and biochemical responses to drought stress in cultivated and Tibetan wild barley. Plant Growth Regul. 75:567–574.
- Zheng Y, Jia A, Ning T, Xu J, Li Z, Jiang G. 2008. Potassium nitrate application alleviates sodium chloride stress in winter wheat cultivars differing in salt tolerance. J Plant Physiol. 165:1455–1465.