
 ?Mathematical formulae have been encoded as MathML and are displayed in this HTML version using MathJax in order to improve their display. Uncheck the box to turn MathJax off. This feature requires Javascript. Click on a formula to zoom.
Abstract
Harmful algal blooms caused by cyanobacteria have detrimental impacts on lake ecosystems. Uncovering the factors influencing such blooms could facilitate aquatic ecosystem conservation and early warning activities. The experiment simulated the environmental characteristics of shallow eutrophic Lake Ulansuhai in arid regions of China. The experiments were conducted at various temperatures (6, 10, 19, 25°C) and different nutrient conditions (N: 1∼6 mg/L, P: 0.05∼1.00 mg/L) and in the presence of water, algae, and sediment under various disturbance levels (0, 100, 200, 250, 300, 350, 400 rpm). In this study, The optimal Microcystis growth conditions observed in the study were as follows: 19°C ≤ temperature ≤ 25°C; 1.0 mg/L ≤ N ≤ 1.6 mg/L; 0.05 mg/L ≤ P ≤ 0.1 mg/L; 16 ≤ N/P ≤ 20; and lake flow velocity = 10 cm·s−1 (200 rpm). The most suitable pH for the growth of Microcystis is 8.5. Investigating the environmental factors that affect the growth of bloom-forming cyanobacteria could aid the development of early warning systems and guide lake restoration activities under climate warming, N:P imbalance, and varying lake velocity scenarios.
Introduction
Microcystis spp. represent one of Earth's oldest known group of prokaryotes, originating over 2.5 billion years ago, and is the primary cyanobacterial species responsible for algal blooms (Stumpf et al. Citation2012). Microcystis produces toxins that are harmful to humans and can reduce biodiversity, disturb ecological balance, cause the loss of fish resources, and accelerate lake ageing. The frequent occurrence of harmful algal blooms has drawn concern globally, and the control and prediction of eutrophication and Microcystis blooms have attracted the attention of researchers and ecosystem managers. Most Microcystis outbreaks occur in large, shallow eutrophic lakes, such as Chao lake (Li et al. Citation2017b) in China and lake Apopka in North America (Havens et al. Citation2019), and links between Microcystis blooms and environmental factors have been reported (Li et al. Citation2017a). In addition, Laboratory and field studies have demonstrated that when environmental conditions such as water temperature, nutrient concentrations, and wind speed are suitable for Microcystis growth, they often float from the middle or lower layers to the surface (Tang et al. Citation2018). Microcystis blooms, therefore, occur under specific conditions involving multiple environmental factors (Wu et al. Citation2014).
Temperature (Zhu et al. Citation2016), nutrient concentrations (Davis et al. Citation2009), and water and sediment disturbance (Couceiro et al. Citation2013) are the major environmental factors that influence the growth and metabolism of Microcystis. Microcystis blooms often occur in warm eutrophic ecosystems (Ninio et al. Citation2019). The biomass of Microcystis and other dominant cyanobacterial species has been demonstrated to be linearly correlated with water temperature within a certain range (15–35°C); and Chen et al. (Citation2001) have suggested that climate warming may promote the reproduction of Microcystis.
Nitrogen (N) and phosphorus (P) are essential nutrients for Microcystis growth in large, shallow, eutrophic lakes (Cade-Menun and Paytan Citation2010); therefore, reductions in the levels of both elements could effectively control the biomass of Microcystis (Paerl et al. Citation2011). In addition, significant decreases in Microcystis proliferation in late summer and early autumn have been shown to be related with the consumption of bioavailable N in aquatic ecosystems (Michalak et al. Citation2013) and Microcystis blooms can lead to reductions in N in eutrophic lakes. P is a recognized limiting nutrient for algal blooms in freshwater ecosystems, under insufficient N sources (Schindler Citation1977). Cyanobacterial abundance is also significantly correlated with the N-P ratio, and the optimal ratio for algal growth has been reported to be 16:1 (Redfield Citation1960).
The release of nutrient by sediments in lakes is a key process associated with large-scale outbreaks of Microcystis, with most of the release instigated by disturbance attributed to wind and wave action (Huang et al. Citation2016). Furthermore, increased turbulence can decrease the thickness of the diffusion boundary layer and, in turn, enhance the mass transfer of nutrients from lake sediments into the water column (Couceiro et al. Citation2013). As one of the key factors influencing Microcystis blooms, moderate water disturbance can rapidly alter the particle state in shallow lakes, increase concentrations of dissolved nutrients, and make metabolites more accessible to algal cells, thereby providing nutrients that can directly be used for algal growth (Zhu et al. Citation2017). Low levels of disturbance could also promote Microcystis growth (Zhang et al. Citation2013).
Numerous studies have demonstrated that certain environmental factors, including temperature (Zhu et al. Citation2016) and nutrient concentrations (Davis et al. Citation2009), may directly or indirectly influence the proliferation and aggregation of algal cells. However, such studies have generally involved controlling individual environmental factors without considering the actual lake water quality status or incorporating the effect of lake sediments. Therefore, there is a need to investigate the effects of specific nutrients, temperature, sediment and water disturbance on Microcystis blooms simultaneously and to clarify how environmental factors influence the proliferation and aggregation of algal cells in lacustrine ecosystems. Specifically, the following questions remain unaddressed: (1) what ranges of the environmental factors promote Microcystis blooms; and (2) does the limitation of multiple environmental factors affect Microcystis growth?
Consequently, in the present study, we quantitatively studied the environmental thresholds of Microcystis growth using multi-factor-controlled experiments. The purposes of the study were to determine the optimal growth temperature, nutrients and water disturbance for Microcystis blooms in a typical shallow lake. Our results could provide a reference resource that could facilitate Microcystis bloom management and reveal the potential role and significance of lake sediments in shallow lakes in cyanobacterial blooms in arid regions.
Materials and methods
Cyanobacterial strain
Microcystis sp. (No. FACHB-573) was purchased from the Freshwater Algae Culture Collection of the Institute of Hydrobiology, Chinese Academy of Sciences, and cultured in BG-11 medium with pH 8.0 in an artificial climate chamber (at 25 ± 1°C) under a 12:12 h light–dark cycle and an illumination of 25 µmol photons m−2·s−1 (Ma et al. Citation2014; Shira et al. Citation2019). All culture bottles were shaken manually at the same time twice per day to prevent the algae from attaching to the walls of the vessels. After 10 days of expansion, Microcystis were cultivated to the logarithmic growth phase for subsequent experiments. The volume of the beaker used in this experiment was 5L. The glassware was immersed in 0.1 mol/L HCl for 2 h, then rinsed with distilled water, and finally sterilized at high temperature (121°C) for 30 min.
Experimental set-up
The sediment used in the present study was collected from Lake Ulansuhai (40°42′N, 108°50′E), the largest wetland in the world at the latitude. We used the mud column method to dig out a 60 cm sediment column in the center of the lake. Afterward, we used an autoclave to sterilize the sediment to prevent other algae from influencing the results of the experiment. The experimental algae (Microcystis) were grown and cultured to the required initial cell density (0.2 × 10⁶ cells/mL) under an illumination of 25 µmol photons m−2·s−1. The Microcystis algal seed solution was centrifuged at 2200 ×g, using a TDZ4-WS tabletop low-speed centrifuge, for 10 min at room temperature (23°C), and then shaken and placed into a 5-L beaker of BG11 medium without nitrogen and phosphorus. In order to control the nutrient concentration variables, the mass concentrations of N and P were adjusted. Potassium nitrate (KNO3) was used for nitrate-N (-N), and dihydrogen phosphate was used for KH2PO4. In this experiment, the culture was set up as described by Zhu and Wan (Citation2008).
Experiments-a about the influence of temperature and nutrients on Microcystis
The experiments were based on a two-factor controlled culture, with varying temperature and nutrient salt concentrations. Microcystis were placed in beakers pre-filled with sterilized medium containing different N-P ratios or a single slurry of lake sediment (4 cm). According to the standards for evaluating lake eutrophication (Wang et al. Citation2002) and field measurements of average ranges N and P levels in Lake Ulansuhai (0.48–8.21 mg/L N; 0.04–1.00 mg/L P) in 2018–2019, we established four nutrient ratio groups, including T1 (1.00 mg/L N, 0.05 mg/L P), T2 (1.60 mg/L N, 0.10 mg/L P), T3 (2.10 mg/L N, 0.20 mg/L P), and T4 (6.00 mg/L N, 1.00 mg/L P), in addition to a group with Lake Ulansuhai sediment and distilled water, and no N and P nutrients were added (T5). The N-to-P ratios in groups T1 – T4 were 20, 16, 12, and 6, respectively. The beakers were then sealed with aluminum foil and placed in four incubators set at 6, 10, 19, and 25°C, which correspond to the mean water temperatures of Lake Ulansuhai measured in January, April, July and October, respectively, in 2017 and 2018. The beakers under a 12:12 h light–dark cycle and an illumination of 25 µmol photons m−2·s−1. The experimental design of this batch is shown in Table . The treatment group of experiment-a included 20 groups and all treatments were prepared in triplicate. Samples were counted under the microscope at two-day intervals from the date of inoculation for a total of 19 days.
Table 1. Design of the experiments-a that was used to investigate the effects of temperature, nutrient concentrations, and sediment on Microcystis cultures.
Experiments-b about the influence of disturbance intensity on Microcystis
The experiments included a series of disturbed cultures that were grown in the presence of water, algae, and sediment. This experiment was based on the optimal growth temperature of Microcystis and the sediment of Lake Ulansuhai sediment obtained in experiments-a. Autoclaved sediment was spread uniformly at a thickness of approximately 4 cm in a 5-L glass beaker (15 cm × 25 mL). Subsequently, 3 L of deionized water was slowly injected using a siphon. After allowing two days for the water and sediment to achieve an equilibrium, Microcystis were placed in the beaker, which was then sealed. All cultures were prepared in triplicate. The experimental design is shown in Table .
Table 2. Design of experiments-b used to investigate the effect of disturbance on Microcystis cultures.
In the experiments-b, the temperature was controlled at 25°C and the irradiance set at 25 µmol photons m−2·s−1, with a disturbance time of 12 h per day. The disturbance velocities were set to 0, 100, 200, 250, 300, 350 and 400 rpm to mimic the various water flow velocities in Lake Ulansuhai. The average water velocity in Ulansuhai lake was 3.3 m/s, and the average velocities of four seasons (Winter, Spring, Summer, and Autumn) were 0.03, 1.06, 3.20, and 9.2 m/s, respectively. The field flow rate was calculated based on the rpm and the rotational speed of the experimental device (JJ-1H constant speed type 120W) (Zhang Citation2017), as shown in Table . During cultivation, 100 ml water samples were collected at two-day intervals and used to measure Microcystis cell density; the chl-a, ammonia-N (-N), nitrate-N (
-N), and nitrite-N (
-N) contents, and the values of physicochemical parameters (pH, total dissolved solids [TDS], and dissolved oxygen [DO]). The cultures were disturbed during the collection of the water samples. The treatment group of experiment-b included 7 groups and all treatments were prepared in triplicate. The experiments were performed for 21 days.
Table 3. Correlation between laboratory disturbance and field hydrodynamics
Cell density was determined by observing the cells under a light microscope (Olympus CX33, Olympus, Tokyo, Japan) using cell counters (PT-C). Each sample was counted three times and averaged. Water quality indexes such as pH, DO, and TDS were measured using a portable water quality parameter instrument (Multi 3630 IDS, WTW, Weilheim, Germany). -N was determined by nanoreagent colorimetry,
-N was determined spectrophotometrically using naphthalene ethylenediamine hydrochloride,
-N was determined by phenol disulfonic acid spectrophotometry (Eaton et al. Citation1995), and chl-a was determined by acetone extraction spectrophotometry. (Figure ).
Figure 1. Diagram of the experimental design. (a) The design of batch test I: four culture temperatures (6, 9, 10, and 25°C) were set up and five nutrient gradients (T1 [1.0 mg/L N, 0.05 mg/L P], T2 [1.6 mg/L N, 0.1 mg/L P], T3 [2.1 mg/L N, 0.2 mg/L P], T4 [6 mg/L N, 1 mg/L P], T5 [sediment]) were set up at each temperature for cross-cultivation. Each group was set up in three parallel runs, yielding 20 groups in total; (b) The designs of the batch test II: experimental cultures were set up with different disturbance velocities (0, 100, 200, 250, 300, 350, and 400 rpm) under a constant temperature of 25°C.
![Figure 1. Diagram of the experimental design. (a) The design of batch test I: four culture temperatures (6, 9, 10, and 25°C) were set up and five nutrient gradients (T1 [1.0 mg/L N, 0.05 mg/L P], T2 [1.6 mg/L N, 0.1 mg/L P], T3 [2.1 mg/L N, 0.2 mg/L P], T4 [6 mg/L N, 1 mg/L P], T5 [sediment]) were set up at each temperature for cross-cultivation. Each group was set up in three parallel runs, yielding 20 groups in total; (b) The designs of the batch test II: experimental cultures were set up with different disturbance velocities (0, 100, 200, 250, 300, 350, and 400 rpm) under a constant temperature of 25°C.](/cms/asset/98064118-2fa5-4c4e-814f-c60c851a0dad/tfls_a_1919569_f0001_oc.jpg)
Statistical analysis
Microsoft Excel 2013 was used to record the data. IBM SPSS Statistics 24.0 (IBM Corp.) was used to conduct two-way Analysis of Variance (ANOVA) under different conditions, followed by a Least Significance Difference test. A p value of < 0.05 was considered significant. Origin 8.0 (OriginLab Corp.) was used to create the figures.
Results
Influence of nutrient concentration, temperature, and lake sediment on Microcystis growth characteristics
Microcystis growth characteristics under different nutrient conditions
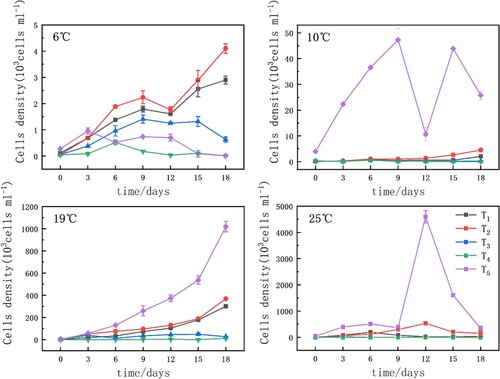
Microcystis cell density varied across different nutrient conditions under similar temperature conditions. As shown in Figure , Microcystis concentration trends were significantly different under different temperature conditions (p<0.05). Overall, low-temperature conditions (6°C and 10°C) significantly restricted Microcystis growth and prevented bloom formation (p <0.05). The optimal temperature for instigating Microcystis blooms was 25°C. At 6°C, Microcystis growth in the five nutritional treatment groups was limited, and the maximum value of the T2 group was only 4.1 × 10³ cells/mL on the 18th day. Growth in the T3 and T4 groups was slow up to the 6th day, after which it decreased gradually. Both the T4 and T5 groups decreased to a minimum of 0.1 × 10³ cells/mL on the 18th day. Microcystis in the T5 (sediments) group grew slowly because the release of nutrients from the sediment was limited by the low temperature. However, the algal cell density of the T5 group was significantly higher than those of all other groups at all the other tested temperatures, suggesting that the conditions in the samples with only natural sediment were the most suitable for the growth and propagation of Microcystis. At 10°C, Microcystis cell density in groups T1-T4 was relatively low, showing fluctuating in the 0.02 ∼ 4 × 10³ cells/mL range. Notably, Microcystis growth in the T5 group at 10°C increased rapidly in the early stage of the culture, and then began to decline markedly on the 9th day of culture, with Microcystis cell density decreasing from 47.31 × 10³ cells/mL to 10.61 × 10³ cells/mL. On the 12th day, cell density increased temporarily, and then decreased over the last three days. At 19°C, the densities of all of the experimental cultures increased steadily. The T5 group grew the fastest, followed by the T2 group (Figure ). At 25°C, the T5 group achieved a maximum cell density of 4.59 × 10⁶ cells/mL on the 12th day of culture, whereas the cells in the T3 and T4 groups grew slowly, and then generally stopped growing. At equivalent incubation times, Microcystis cell densities in the experimental groups were in the order of T5 > T2 > T1 > T3 > T4; the corresponding maximum cell densities were 4.59 × 10⁶ (25°C), 5.36 × 10⁵ (25°C), 3.02 × 10⁵ (19°C), 4.94 × 10⁴ (19°C), and 1.08 × 10⁴ cells/mL (19°C), respectively.
Figure 2 Microcystis cell density under the same temperature under different nutrient conditions. Nutrient conditions were as follows: T1 (1.0 mg/L N, 0.05 mg/L P), T2 (1.6 mg/L N, 0.1 mg/L P), T3 (2.1 mg/L N, 0.2 mg/L P), T4 (6 mg/L N, 1 mg/L P), and T5 (sediments). Data show the means (n = 3) with associated error bars (SD).
Changes in Microcystis growth under different temperatures
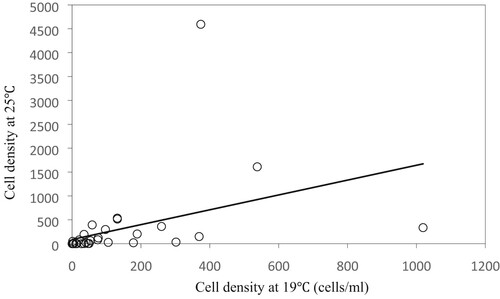
The effects of different nutrient concentrations on Microcystis growth at different temperatures are shown in Figure . When the temperature was 6°C or 10°C, the cell densities in all five nutrient groups were low, generally reflecting the stagnant stage. At 19°C, the cell densities of Microcystis in the T1 (1.0 mg/L N, 0.05 mg/L P), T2 (1.6 mg/L N, 0.1 mg/L P) and T5 (sediment) groups increased consistently and growth was greater overall than in the other groups. The growth rate of the T3 group exhibited a gradual increase during the first 3 days of culture before decreasing afterward; it then increased again for 9 days and finally decreased rapidly from day 15. In the T4 group, the cell density increased slowly until the 12th day and then decreased before rapidly increasing on the 15th day. At 25°C, the cell density of Microcystis in all five groups increased gradually and then decreased. In addition, the T2 and T5 groups had the longest growth period, 12 days, while the growth period of the T3 group was the shortest, at only 3 days. As shown in Figure , single-factor ANOVA revealed a significant difference between the cell density of Microcystis grown under 19°C and under 25°C (r = 0.390, P<0.05, N=35).
Figure 3. Cell density of Microcystis grown under the similar nutrient conditions at different temperatures (6°C, 10°C, 19°C, and 25°C). Nutrient conditions were as follows: T1 (1.0 mg/L N, 0.05 mg/L P), T2 (1.6 mg/L N, 0.1 mg/L P), T3 (2.1 mg/L N, 0.2 mg/L P), T4 (6 mg/L N, 1 mg/L P), and T5 (sediments). Data show the means (n = 3) with associated error bars (SD).
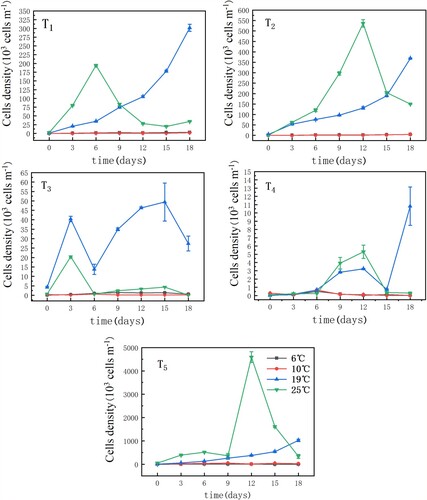
Figure 4. Two-way analysis of variance results for the relationship between the cell density of Microcystis cultured at 19°C and under 25°C.
Microcystis growth characteristics under the influence of water disturbance in sediment
Effects of water disturbance and sediment on Microcystis growth
The changes in algal cell density with time under different disturbance intensities at 25°C are shown in Figure (a). Overall, the growth curve of Microcystis entered a period of decline after a short adaptation period, with a logarithmic growth phase, and a stationary phase. Changes in disturbance intensity resulted in significant changes in the growth curve. The initial cell density of Microcystis under disturbed conditions was considerably higher than the initial cell density under static conditions.
Figure 5. Variation in the cell density of Microcystis (a) and chl-a concentrations (b) under different disturbance intensities. Data are means (n = 3) with associated error bars (SD).
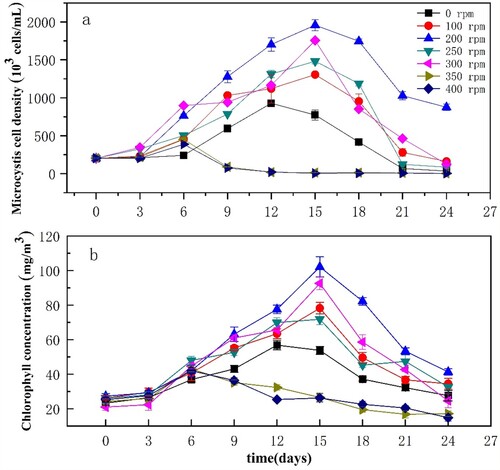
Under 25°C and 25 µmol photons m−2·s−1, a disturbance intensity of 200 rpm resulted in the highest cell density of the algae; under the conditions above, maximum algal biomass was 1.96 × 10⁶ cells/mL. The largest number of cells (1.76 × 10⁶ cells/mL) was observed on the 15th day in cultures exposed to a disturbance of 300 rpm. Microcystis growth was also promoted by exposure to 100 and 250 rpm disturbance. The growth of Microcystis cultures that were not disturbed (0 rpm) was relatively poor, with relatively short growth periods observed. Under 350 or 400 rpm disturbance, the growth periods of the cultures were shorter than those under other disturbance intensities, at only 6 days, and the maximum biomass of the algae was 4.52 × 10⁵ cells/mL. After the 6th day of culture, algal cell density began to decrease gradually, to a value lower than that at the time of inoculation. However, the biomass during the first 6 days was slightly greater than that observed in cultures without disturbance. The results indicate that an appropriate disturbance intensity promotes Microcystis growth, while excessive disturbance inhibits growth.
Chl-a concentrations as well as algal cell density can be used to evaluate algal biomass; therefore, we measured chl-a concentrations to verify Microcystis cell density and growth data (Figure (b)). Chl-a concentrations were consistent with the cell density results (Figure (a)); the chl-a concentrations were the maximum of 4.676 mg/m3 on the 15th day, under a 200 rpm disturbance, after which the cells gradually entered the decay phase. The cell density and chl-a values in cultures exposed to 100, 250, and 300 rpm disturbance intensities were significantly greater than those of the undisturbed groups, indicating that appropriate water disturbance is beneficial to algal growth and reproduction, when compared to an undisturbed state. Moreover, algal photosynthesis activity decreased when the cultures were exposed to disturbances of 350 and 400 rpm, with chl-a values in the cultures decreasing to levels below those at inoculation. The chl-a contents under 350 and 400 rpm disturbance intensities were significantly lower than those in the other groups. Under high levels of disturbance, the algal growth period was shortened, resulting in a significant reduction in the growth rate (p<0.05).
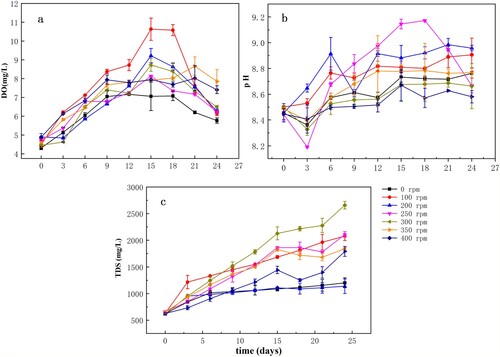
Effects of water disturbance, sediment release, and algal growth on water quality
The physiological characteristics of algal cells varied under difference conditions, based on changes in indicators such as chl-a as illustrated in Figure (b), pH, DO, and TDS, as illustrated in Figure . Different levels of disturbance increased DO contents in the initial stages of the experiment (Figure (a)). The DO contents the treatment groups exposed to disturbances were higher than those in the undisturbed group, and was the maximum at 100 rpm. Afterward, the DO contents decreased gradually in the course of the experiment. The changes in DO contents were generally consistent with the changes in algal cell density. Water pH changed steadily over the course of the experiment. Water pH in the cultures exposed to a disturbance of 250 rpm reached 9.0, while those in the other treatment groups were weakly alkaline, based on pH values ranging between 8.2 and 8.8 (Figure (b)). The TDS in the water were the highest in the 300-rpm treatment group (Figure (c)). The TDS in the 100-rpm group increased more rapidly than in the other groups at the beginning of the experiment, before reverting to a rate of increase close to those of the 250 and 350 rpm groups. In addition, the TDS values of the undisturbed and 200 rpm groups were significantly lower, while those of the 350-rpm group were slightly higher than those of the 0 and 200 rpm groups.
Figure 6. The dissolved oxygen (DO) content (a), pH (b), and total dissolved solids (TDS) concentrations (c) in overlying water under different disturbance conditions. Data are means (n = 3) with associated error bars (SD).
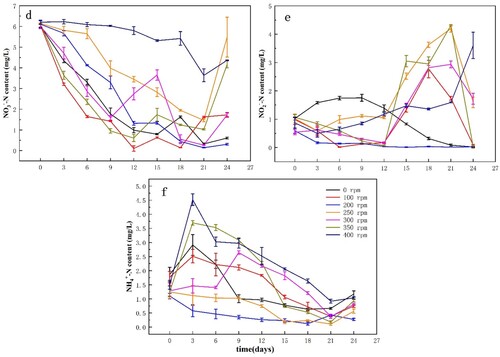
Changes in -N,
-N, and
-N contents in water under different disturbance intensities are shown in Figure . The highest
-N concentration during the experiment was 6.23 mg/L (Figure (d)). The overall trends in each experimental group were a gradual decrease, followed by a gradual increase, with the smallest change overall observed at 400 rpm. Under such conditions, some of the nutrients seem to have been consumed by the algae; therefore, inhibiting algal growth. The
-N concentrations in the medium increased gradually at the early stages of the culture and decreased to a minimum of 0.010 mg/L on the 15th day under the disturbance intensity of 200 rpm (Figure (e)). At the same time, the algal density reached its maximum in this state. The
-N value reached a maximum of 4.31 mg/L when the disturbance intensity was 350 rpm. Here, the
-N conversion was the lowest, and the growth of the algae was slow. The
-N content fluctuated in each treatment group (Figure (f)), and it was transformed into
-N and
-N in the early stages of the culture. The
-N contents were lowest under 200 and 250 rpm disturbance intensities. In contrast, Microcystis grew optimally within the disturbance range.
Figure 7. The -N (d),
-N (e), and
-N (f) concentrations in the overlying water under different levels of disturbance. Data are means (n = 3) with associated error bars (SD).
Discussion
The influence of temperature and different nutrient concentrations on Microcystis growth
The growth of aquatic Microcystis in lake ecosystems is regulated by the interactions of various environmental factors (Zhou et al. Citation2015), with those involving nutrients, temperature, sediment release rates, and water disturbance being the most influential (Cade-Menun and Paytan Citation2010; Su et al. Citation2019). Li et al. (Citation2018) demonstrated that algal growth could be promoted by increasing P concentrations and that when total P (TP) ≤ 0.045 mg/L, algal growth would be limited, in the Haihe River, which is consistent with our conclusion that a TP content ≥ 0.05 mg/L could promote Microcystis blooms in a shallow eutrophic lake. In addition, total N (TN) ≤ 10 mg/L and TP ≤ 0.5 mg/L have been demonstrated to be beneficial to Microcystis growth in Tai Lake, which is also a shallow eutrophic lake (Xu et al. Citation2014). Similarly, higher densities of phytoplankton have been associated with phosphate-P concentrations greater than 0.05 mg/L in Loch Leven, another eutrophic lake (Jupp and Spence Citation1977). The effect of N in promoting algal growth has been shown to only be limited when co-occurring P is ≤ 0.05 mg/L. When P levels are adequate, N levels ≤ 1.0 mg/L can effectively control the excessive growth of algae (Ren et al. Citation2019). Xu et al. (Citation2010) observed that algae grew optimally at an N-to-P ratio of 16:1. The results are consistent with our conclusion. In the present study, the optimal temperature for algal growth was 19–25°C, corresponding to optimal conditions occurring in spring and summer, rather than in autumn and winter. Consistent with our results, Microcystis dominance has been generally reported at relatively high water temperatures (>20.8°C) (Schindler Citation1977) and harmful cyanobacteria, including Microcystis, have been reported to thrive at temperatures of 25°C and above (Robarts and Zohary Citation1987), suggesting that such temperatures promote Microcystis outbreaks. Our results, in addition to previous works, therefore, could facilitate the control of Microcystis blooms in eutrophic lakes.
Algal cell density decreased on the 9th and 15th days of our culture experiments at 10°C potentially because the nutrients required for algal growth exceeded the nutrients released by the sediment at that stage (Davis Citation2009). However, the decrease in cell density on the 9th day could have been caused by a combination of a lack of nutrients and low temperature, and increasing competition for limited resources, which limited the growth and reproduction of Microcystis (Hense and Beckmann Citation2015). At 19°C, the presence of sediment and a suitable gradually increased the growth rate of Microcystis, and the algae continued to grow without environmental inhibition (Oberhaus et al. Citation2007), while optimal growth was observed under 25°C and sediment addition (Wyngaert et al. Citation2011). The growth periods of Microcystis were the longest in the T1, T2, T4, and T5 groups under 25°C, potentially due to the presence of adequate nutrients at the initial stages of the experiments, which could have facilitated the increase in algal numbers. When the temperature and N and P levels were optimal, Microcystis growth reduces spatial and nutritional resources required for algal growth. Consequently, after the achievement of a certain population density, intraspecific competition could have led to the death of some of the algae. The remaining algae were then able to exploit the large quantities of nitrate released by the dead algae, which promoted their growth and reproduction (Berthelot et al. Citation2017).
Hallegraeff (Citation1993) demonstrated that general increases in phytoplankton biomass, as well as increases in frequency and duration of blooming of individual phytoplankton species, are associated with increased freshwater nutrient input in lakes. P has been identified as the primary limiting nutrient in freshwater ecosystems (Schindler Citation1977). However, there is evidence that N may be as important, or even more than P in influencing the occurrence of toxic non-trophic cyanobacterial blooms (such as Microcystis) (Wayne S. Gardner et al. Citation2017). In our experiments, the algae in the T3 and T4 treatment groups (2.1 mg/L N, 0.2 mg/L P and 6 mg/L N, 1 mg/L P, respectively) grew slowly under all the four tested temperatures, indicating that the growth of Microcystis was not only related to temperature but also nutrients. However, this does not necessarily suggest that high nutrient concentrations are much more conducive for algal growth. The significant difference observed in Microcystis cell density between 19 and 25°C indicates that temperature is positively correlated with Microcystis growth at 19–25°C. The density of algal cells at 25°C was significantly greater than that at 19°C in the presence of sediment. The mutual promotion of Microcystis growth and the endogenous release of sediment at such temperatures was clear. At 19°C and 25°C, in the presence of sediment, continuous release of components essential to algal growth from the sediment into the water interface (Liu et al. Citation2018) occurs due to a strong gradient in nutrient concentrations at the sediment-water interface (Lu et al. Citation2018), which could explain the simultaneous promotion of Microcystis growth and the endogenous release of sediment. Therefore, under certain conditions, N and P in lake sediments are more easily released into the water (Wang Citation2008), and algal blooms are more likely to occur in the presence of the two elements alone (i.e. without sediment).
The influence of water disturbance and lake sediment on Microcystis growth
Wind and wave disturbances influence the formation of Microcystis blooms (Qu et al. Citation2018). Sediment at the bottom of large shallow lakes is prone to resuspension under frequent wind disturbance (Yang et al. Citation2018), which causes nutrients in the sediment to enter the water column, releasing abundant nutrients that can promote algal blooms. Huang et al. (Citation2015) demonstrated that water turbulence could promote phytoplankton growth and influence the composition of the species. Our results show that disturbances at different intensities can stimulate the release of nutrients from the sediment and significantly influence Microcystis biomass. Perturbation at 200–300 rpm also prolonged the logarithmic growth phase of Microcystis. Wang et al. (Citation2010) also demonstrated that water flows are conducive to Microcystis growth and reproduction, and that the maximum Microcystis biomass would be obtained at a flow rate of 15 cm/s (300 rpm). The results of our study are consistent with the conclusions.
Appropriate levels of disturbance in lakes promote nutrient circulation in the water-sediment-algae system, which increases Microcystis growth rate and prevents the attachment of algae to the sediment, which facilitates blooms. This is consistent with observations that continuous weak winds over large shallow lakes can accelerate the spread of blooms (Marmorino et al. Citation2017). In our study, the growth period of Microcystis was shortened following exposure to high levels of disturbance of 350–400 rpm; under such conditions, the algae rapidly reached a growth peak, and the maximum chl-a concentrations were relatively low. Mitsuhashi et al. (Citation1995) also observed that the shear force generated by turbulence could increase the photosynthetic efficiency of algae and that the algae subsequently entered a declining phase, indicating that an excessively high level of disturbance has an inhibitory effect on Microcystis. The maximum disturbance intensity applied in the present study, 400 rpm, did not cause mechanical damage to Microcystis, and previous work has shown that single-celled cyanobacteria can survive without mechanical damage at stirring rates of up to 3000 rpm (Bronnenmeier and Märkl Citation1982). However, high-intensity disturbance may inhibit the photosynthetic efficiency and destroy Microcystis cells (Mitsuhashi et al. Citation1995), thereby affecting their growth and proliferation (Hondzo and Lyn Citation1999).
Water quality changes under disturbance
Algal growth is influenced by water disturbance in the presence of sediment. The differences in the concentrations of materials at the sediment-water interface and the entrapment force generated by the water disturbance and the absorption and transformation of the algae would directly influence water quality in a sediment-containing water body (Ren et al. Citation2019).
Increases in algal density resulted in increased DO content in the water due to algal photosynthesis, suggesting that DO content can be used as an indicator of algal biomass in a water body (Shan et al. Citation2019), as suggested previously by Li et al. (Citation2014). Increased DO can further promote the large-scale reproduction of phytoplankton. Generally, DO concentrations are greater at the surface layers of water bodies than in the deeper layers; therefore, it is the primary factor influencing cyanobacterial blooms (Kong and Gao Citation2005). Algal photosynthesis consumes CO2 and releases O2. Decreases in CO2 affect the equilibrium between carbonic acid and carbonate in the overlying water and shift the chemical equilibrium of the reaction, , to the left, leading to the establishment of alkaline conditions (Li et al. Citation2011; Shen Citation2011). We observed a significant correlation between increased water pH and algal cell density. Algal photosynthesis also consumes carbon dioxide, also affecting the equilibrium between carbonic acid and carbonate in the overlying water, as above. Such activities increase pH, and, in turn, alkalinity, which is consistent with the conclusion of Zhang et al. (Citation2016) that phytoplankton growth interacts with lake pH. Liu (Citation2004) observed that a pH of approximately 8.5 was the most suitable for algal growth and that alkaline water often had high levels of productivity. In addition, our field observations revealed that June to October is the season with frequent algal outbreaks.
Water transparency is affected by TDS. Higher TDS content can reduce the transmission of light through water, thereby affecting algal growth by reducing light available (Wu et al. Citation2009). Moreover, TDS can be used to characterize the degree of water pollution and as an indirect indicator of salinization status in lakes (Min et al. Citation2016; Wu et al. Citation2016). Conductivity (TDS) is closely linked to the amounts of inorganic acids, bases, salts, and other compounds, and to the number and type of ions present in the water (Qu et al. Citation2018). The conductivity of a water body will increase because the dissolved matter in the sediment is more easily dispersed in the overlying water when the disturbance intensity increases.
Microcystis growth and proliferation are promoted when appropriate levels of dissolved solids are present. However, in our experiments, when the TDS value was too high, algal growth was significantly inhibited (p < 0.01). Under our experimental conditions, -N and
-N were converted into
-N (Huang et al. Citation2018). The metabolic pathway of N in cells (Zhao Citation2010) is
-N nitrate reductase →
-N nitrite reductase →
-N → protein. This shows that using
-N rather than
-N conserves energy; therefore,
-N is used preferentially by algae. Additionally, the rate at which
-N is utilized is higher than the rates of utilization of other compounds (Zhao Citation2010), which is consistent with the results of the present study. Certain levels of disturbance facilitate the absorption of N by Microcystis, which preferentially utilize
-N followed by
-N; conversely, the amount of
-N exploited is relatively low. Huang et al. (Citation2018) and other investigators have shown that algae only absorb inorganic N and any N not absorbed by algae participates in the N cycle in water.
The results of the present study suggest that the limitations of various environmental factors can affect Microcystis blooms in large shallow eutrophic lakes. Moreover, in the present study, the algal cell densities in the experimental groups followed the order T5 (sediment) > T2 (1.6 mg/L N, 0.1 mg/L P) >T1 (1.0 mg/L N, 0.05 mg/L P) >T3 (2.1 mg/L N, 0.2 mg/L P) >T4 (6 mg/L N, 1 mg/L P). The T5 (sediment) group was the condition most suitable for the growth and propagation of Microcystis, highlighting the importance of sediment dredging in lake management. Meanwhile, the optimum nutritional conditions for Microcystis blooms in the absence of sediment were 1.0 mg/L ≤ N ≤ 1.6, 0.05 mg/L ≤ P ≤ 0.1 mg/L, and 16 ≤ N/P ≤ 20. The optimal temperature for algal growth was 19–25°C, corresponding to optimal growth in spring and summer rather than in autumn and winter. Moreover, when the lake disturbance level was 200 rpm, it was the most conducive for Microcystis blooms. The present study reveals how different key environmental factors in aquatic environments potentially interact and influence Microcystis growth and provides a reference that could facilitate shallow lake management in arid areas. The results should be further validated in Microcystis culture experiments with different species.
Conclusions
In the present study, we identified the optimal nutrient conditions for algal blooms in large shallow lake ecosystems. In general, this study reveals the mechanisms by which outbreaks of Microcystis blooms occur; the findings suggest that in large, shallow lakes, such outbreaks are driven by multiple environmental factors. The experimental results were based on the natural conditions in Lake Ulansuhai during the spring and summer months, when Microcystis spp. are in their optimal growth phase. The results of the disturbance experiments showed that lake sediment can provide a continuous supply of nutrients for algal growth and that hydrodynamic action can cause sediment resuspension and promote algal blooms. We show that when studying the dynamic characteristics of Microcystis in eutrophic lakes, especially under multi-factor constraints, it is necessary to consider nutrients, temperature, and lake wind speed. Additionally, our results suggest that dredging of sediment may be particularly important in the context of managing algal blooms. The data and insights provided herein could facilitate the prediction of when algal blooms might occur and the management of lacustrine ecosystems, in addition to restoration projects. However, our study only involved the culture of a single algal species. In future research, experiments should investigate the effects of competition among microalgae, and between microalgae and macroalgae, under various environmental conditions.
Acknowledgements
We gratefully acknowledge Professor Xixi Lv for help with this paper and thank our classmates for their guidance on the experiments.
Disclosure statement
No potential conflict of interest was reported by the author(s).
Data availability statement
The data that support the findings of this study are available in https://osf.io/j7hmp/?viewonly=2766b25af68a4a71911e53c75f59550b.
Additional information
Funding
References
- Berthelot H, Benavides M, Moisander PH, Grosso O, Bonnet S. 2017. High nitrogen fixation rates in the particulate and dissolved pools in the Western Tropical Pacific (Solomon and Bismarck Seas). Geophys Res Lett. 44(16):8414–8423.
- Bronnenmeier R, Märkl H. 1982. Hydrodynamic stress capacity of microorganisms. Biotechnol Bioeng. 24(3):553–578.
- Cade-Menun BJ, Paytan A. 2010. Nutrient temperature and light stress alter phosphorus and carbon forms in culture-grown algae. Mar Chem. 121(1):27–36.
- Chen Y, Qing B, Gao X. 2001. Prediction of blue-green algae bloom using stepwise multiple regression between algae & related environmental factors in Meiliang Bay, Lake Taihu. Journal of Lake Sciences. 13(1):63–71.
- Couceiro F, Fones GR, Thompson CEL, Statham PJ, Sivyer DB, Parker R, Kelly-Gerreyn BA, Amos CL. 2013. Impact of resuspension of cohesive sediments at the Oyster Grounds;(North Sea) on nutrient exchange across the sediment-water interface. Biogeochemistry. 113(1-3):37–52.
- Davis TW. 2009. Effects of nutrients, temperature, and zooplankton grazing on toxic and non-toxic strains of the harmful cyanobacterium Microcystis spp. Doctoral dissertation, The Graduate School, Sony Brook University NY.
- Davis TW, Berry DL, Boyer GL, Gobler CJ. 2009. The effects of temperature and nutrients on the growth and dynamics of toxic and non-toxic strains of Microcystis during cyanobacteria blooms. Harmful Algae. 8(5):715–725.
- Eaton AD, Clesceri LS, Greenberg AE, Franson MAH. 1995. Standard methods for the examination of water and wastewater. Am J Public Health Nations Health. 56(3):387–388.
- Gardner WS, Newell SE, McCarthy MJ, Hoffman DK, Lu K, Lavrentyev PJ, Hellweger FL, Wilhelm SW, Liu Z, Bruesewitz DA. 2017. Community biological ammonium demand (CBAD): a conceptual model for cyanobacteria blooms in eutrophic lakes. Environ Sci Technol. 51:7785–7793.
- Hallegraeff GM. 1993. A review of harmful algal blooms and their apparent global increase. Phycologia. 32:79–99.
- Havens KE, Ji G, Beaver JR, Fulton RS, Teacher CE. 2019. Dynamics of cyanobacteria blooms are linked to the hydrology of shallow Florida lakes and provide insight into possible impacts of climate change. Hydrobiologia. 829:43–59.
- Hense I, Beckmann A. 2015. A theoretical investigation of the diatom cell size reduction–restitution cycle. Ecol Modell. 317:66–82.
- Hondzo M, Lyn D. 1999. Quantified small-scale turbulence inhibits the growth of a green alga. Freshw Biol. 41(1):51–61.
- Huang Y, Chen X, Li P, Chen G, Peng L, Pan L. 2018. Pressurized Microcystis can help to remove nitrate from eutrophic water. Bioresour Technol. 248:140–145.
- Huang J, Xi B, Xu Q, Wang X, Li W, He L, Liu H. 2016. Experiment study of the effects of hydrodynamic disturbance on the interaction between the cyanobacterial growth and the nutrients. J Hydrodyn. 28(3):411–422.
- Huang J, Xu Q, Xi B, Wang X, Li W, Gao G, Huo S, Xia X, Jiang T, Ji D. 2015. Impacts of hydrodynamic disturbance on sediment resuspension, phosphorus and phosphatase release, and cyanobacterial growth in Lake Tai. Environ Earth Sci. 74(5):3945–3954.
- Jupp BP, Spence DHN. 1977. Limitations on macrophytes in a eutrophic lake, Loch Leven: I. Effects of phytoplankton. J Ecol. 65(1):175–186.
- Kong F, Gao G. 2005. Hypothesis on cyanobacteria bloom-forming mechanism in large shallow eutrophic lakes. Acta Ecologica Sinica. 25(3):590–595.
- Li A, Li Y, Xing M, Zhang L, Zhou B, Zhou B, Li H, Ma Z, Ji M. 2018. Analysis on water quality and algae bloom influencing factors for Hai River trunk stream. Environ Eng. 24:556–562.
- Li Y, Liu B, Liu S, Li D. 2017b. The trophic state of lake water regulates spatial-temporal variations of bloom-forming Microcystis. Chin J Oceanol. 35:415–422.
- Li W, Wang X, Jin X, Xu J, Wang L. 2017a. Analysis on algae growth mechanism and water blooms prediction under effect of multi-factor. Saudi J Biol Sci. 24(3):556–562.
- Li W, Xu J, Yu L, Li X, Zhang X, Shi Y, Han P, Li C. 2014. Experimental study on influence of juvenile fish on phytoplankton's growth in lake Wuliangsuhai. Environ Eng. 32(1):10–13.
- Li H, Yao C, Dong X, Dong W, Fan Z. 2011. Effect of pH on inactivation of Microcystis aeruginosa by ozonation air in sequencing batch reactor. J Chem Technol Biotechnol. 86(3):468–471.
- Liu C. 2004. Analysis of environmental factors affecting algal growth and blooming in urban waterbodies. Nankai University.
- Liu X, Chen R, Lei Z, Xue T, Yuan W. 2018. Effect of sediment on the growth of algae under recycled water supplement conditions. Environ Eng. 36(7):42–46.
- Lu Y, Chen C, Liu G, Liu W. 2018. Sediment nitrogen cycling rates and microbial abundance along a submerged vegetation gradient in a eutrophic lake. Sci Total Environ. 616-617:899–907.
- Ma J, Jin P, Guo M, Dai K, Xu T, Yang C, Lin Q. 2014. Influences of phosphorus concentration on interactions among Microcystis aeruginosa, Daphnia magna and Ceratophyllum demersum. Acta Ecologica Sinica. 34:1520–1526.
- Marmorino GO, Smith GB, Miller WD. 2017. Turbulence characteristics inferred from time-lagged satellite imagery of surface algae in a shallow tidal sea. Cont Shelf Res. 148:178–184.
- Michalak AM, Anderson EJ, Beletsky D, Boland S, Bosch NS, Bridgeman TB, Chaffin JD, Cho K, Confesor R, Daloglu I. 2013. Record-setting algal bloom in Lake Erie caused by agricultural and meteorological trends consistent with expected future conditions. Proc Natl Acad Sci USA. 110(16):6448–6452.
- Min Z, Zhang Y, Zhen Y, Wei L, Yang W, Chao C, Kong F. 2016. Spatial and seasonal shifts in bloom-forming cyanobacteria in Lake Chaohu: Patterns and driving factors. Phycol Res. 64(1):44–55.
- Mitsuhashi S, Hosaka K, Tomonaga E, M H, T K. 1995. Effects of shear flow on photosynthesis in a dilute suspension of microalgae. Appl Microbiol Biotechnol. 42(5):744–749.
- Ninio S, Lupu A, Viner-Mozzini Y, Zohary T, Sukenik A. 2019. Multiannual variations in Microcystis bloom episodes -temperature drives shift in species composition. Harmful Algae. 21:247–259.
- Oberhaus L, Briand JF, Leboulanger C, Jacquet S, Humbert JF. 2007. Comparative effects of the quality and quantity of light and temperature on the growth of Planktothrix agardhii and P-rubescens. J Phycol. 43(6):1191–1199.
- Paerl HW, Xu H, Mccarthy MJ, Zhu G, Qin B, Li Y, Gardner WS. 2011. Controlling harmful cyanobacterial blooms in a hyper-eutrophic lake (Lake Taihu, China): The need for a dual nutrient (N & P) management strategy. Water Res. 45(5):1973–1983.
- Qu Y, Wu N, Guse B, Fohrer N. 2018. Riverine phytoplankton shifting along a lentic-lotic continuum under hydrological, physiochemical conditions and species dispersal. Sci Total Environ. 619-620:1628–1636.
- Redfield AC. 1960. The biological control of chemical factors in the environment. Am Sci. 46:205–221.
- Ren M, Chen R, Lei Z, Xue T, Wang X. 2019. Nitrogen and phosphorus restriction and main controlling factors in proliferation and toxicity production of Microcystis aeruginosa. Water Resour Prot. 35:102–107.
- Robarts RD, Zohary T. 1987. Temperature effects on photosynthetic capacity, respiration, and growth rates of bloom-forming cyanobacteria. N Z J Marine Freshwater Res. 21(3):391–399.
- Schindler DW. 1977. Evolution of phosphorus limitation in lakes. Science. 195(4275):260–262.
- Shan K, Song L, Chen W, Li L, Liu L, Wu Y, Jia Y, Zhou Q, Peng L. 2019. Analysis of environmental drivers influencing interspecific variations and associations among bloom-forming cyanobacteria in large, shallow eutrophic lakes. Harmful Algae. 84:84–94.
- Shen Q. 2011. Analyses on the influence of algae metabolism on pH and DO in surface water. Environ Sci Technol. 34:261–286.
- Shira N, Achsa L, Yehudit V-M, Tamar Z, Assaf S. 2019. Multiannual variations in Microcystis bloom episodes -temperature drives shift in species composition. Harmful Algae. 21:247–259.
- Stumpf RP, Wynne TT, Baker DB, Fahnenstiel GL. 2012. Interannual variability of cyanobacterial blooms in Lake Erie. Plos One. 7(8):e42444.
- Su M, Andersen T, Burch M, Jia Z, An W, Yu J, Yang M. 2019. Succession and interaction of surface and subsurface cyanobacterial blooms in oligotrophic/mesotrophic reservoirs: A case study in Miyun Reservoir. Sci Total Environ. 649:1553–1562.
- Tang C, Sun B, Yu K, Shi J, Liu M, Jiang T, Huo Y, He P. 2018. Environmental triggers of a Microcystis (Cyanophyceae) bloom in an artificial lagoon of Hangzhou Bay, China. Mar Pollut Bull. 135:776–782.
- Wang Y. 2008. Influence of Microcystis on the Nutrient Content of the Sediments in Lake Taihu (China). Doctoral dissertation, MS thesis, Nanjing University of Information Science and Technology, Nanjing University of Information Science and Technology, Nanjing.
- Wang M, Liu X, Zhang J. 2002. Evaluate method and classification standard on lake eutrophication. Environ Monit China. 18(5):47–49.
- Wang T, Zhu W, Li L. 2010. Simulation on the hydrodynamic effects of Microcystis aeruginosa in different temperature conditions. J Lake Sci. 22(4):563–568.
- Wu Y, Li L, Gan N, Zheng L, Ma H, Shan K, Liu J, Xiao B, Song L, Wu Y. 2014. Seasonal dynamics of water bloom-forming Microcystis morphospecies and the associated extracellular microcystin concentrations in large, shallow, eutrophic Dianchi Lake. J Environ Sci. 26(9):1921–1929.
- Wu Y, Li L, Zheng L, Dai G, Ma H, Shan K, Wu H, Zhou Q, Song L, Wu Y. 2016. Patterns of succession between bloom-forming cyanobacteria Aphanizomenon flos-aquaeand Microcystis and related environmental factors in large, shallow Dianchi Lake, China. Hydrobiologia. 765(1):1–13.
- Wu N, Tao T, Qu X, Cai Q. 2009. Spatial distribution of benthic algae in the Gangqu River, Shangrila, China. Aquat Ecol. 43(1):37–49.
- Wyngaert SVD, Salcher MM, Pernthaler J, Zeder M, Posch T. 2011. Quantitative dominance of seasonally persistent filamentous cyanobacteria (Planktothrix rubescens) in the microbial assemblages of a temperate lake. Limnol Oceanogr. 56(1):97–109.
- Xu H, Paerl HW, Qin B, Zhu G, Gaoa G. 2010. Nitrogen and phosphorus inputs control phytoplankton growth in eutrophic Lake Taihu, China. Limnol Oceanogr. 55(1):420–432.
- Xu H, Yang G, Zhou J, Qin B, Zhang G, Zou H. 2014. Effect of nitrogen and phosphorus concentration on colony growth of Microcystis flosaquae in Lake Taihu. J Lake Sci. 26:213–220.
- Yang S, Ling-Lei Z, Jia L, Min C, Yao-Wen Z. 2018. Mechanism of the influence of hydrodynamics on Microcystis ?>aeruginosa, a dominant bloom species in reservoirs. Sci Total Environ. 636:230–239.
- Zhang W. 2017. Effects of hydrodynamics on nutrient cycling and algal growth in Lake Tai. Chinese Research Academy of Environmental Sciences.
- Zhang B, Li F, Zhang Y, Zhang H, Chen L. 2013. Simulation experiment on the effect of water disturbance on growth of Microcystis aeruginosa. Environ Sci Technol. 36(s1):45–49.
- Zhang X, Luan Q, Sun J, Du M, Liang J, Zang Y, Zhang Y, Wang J. 2016. Annual variation in phytoplankton community and its relationship with ambient environmental factors in adjacent waters of Zhangzi Island. J Dalian Fisheries Univ. 31(3):315–323.
- Zhao X. 2010. Effects of the variously ambient nitrogen, phosphorus concentrations and nitrogen sources on growth of Karenia mikimotoi under laboratory conditions. Ocean University of China.
- Zhou Q, Xiong Q, Li L, Hu L, Song L. 2015. The physio-ecological characteristics of algae treated with low temperature and light intensity under different light intensity, nitrogen and phosphorus concentrations. J Lake Sci. 27(6):1059–1066.
- Zhu J, He Y, Wang J, Qiao Z, Wang Y, Li Z, Huang M. 2017. Impact of aeration disturbances on endogenous phosphorus fractions and their algae growth potential from malodorous river sediment. Environ Sci Pollut Res. 24(9):8062–8070.
- Zhu W, Wan L. 2008. Interspecies competition rule of algae under different temperature and nutrient concentration condition. Ecol Environ. 01:6–11.
- Zhu W, Zhou X, Chen H, Gao L, Xiao M, Li M. 2016. High nutrient concentration and temperature alleviated formation of large colonies of Microcystis: evidence from field investigations and laboratory experiments. Water Res. 101:167–175.