
Abstract
In order to establish nomograms that could forecast the postoperative survival for patients with appendiceal cancer after surgery, this study collected 5945 patients with surgically removed appendiceal cancer from the Surveillance, Epidemiology, and End Results database. Overall survival (OS) and cancer-specific survival (CSS) were analyzed by Cox regression analysis and nomograms. The population was randomly separated into a training group (n = 3963) and a validation group (n = 1982). Age, histological grade, T stage, N stage, regional nodes examination, tumor size, and CEA were independent prognostic factors for OS and were used in the nomogram. In addition, radiotherapy and chemotherapy were independent prognostic factors for CSS. The C-index values of the nomograms predicting postoperative OS and CSS were 0.76 (95% CI 0.74–0.78) and 0.80 (95% CI 0.78–0.82) in the training group and 0.77 (95% CI 0.74–0.79) and 0.81 (95% CI 0.78–0.84) in the validation group. Moreover, nomograms were better than traditional American Joint Committee on Cancer (AJCC) TNM 8th Edition Staging System in predicting prognosis derived from the results of DCA and ROC curves. In a word, we constructed new nomograms based on a large database that can accurately predict the OS and CSS of patients with appendiceal cancer after surgery.
Introduction
Appendiceal cancer, with reported incidences ranging from 0.1% to 17%, is a rare gastrointestinal cancer that accounts for only 4% of all intestinal tumors (Marmor et al. Citation2015; Siddharthan et al. Citation2019). Moreover, appendiceal cancer is associated with a fairly high mortality rate. The poor survival rate, to some extent, is due to higher rates of misdiagnosis and missed diagnosis. Appendiceal cancer is often misdiagnosed as acute inflammatory appendicitis as a result of appendix masses blocking the appendix, abnormal imaging findings of enlarged or perforated appendix, and symptoms of abdominal right lower quadrant pain (Siddharthan et al. Citation2019). Furthermore, recent studies testified that the morbidity and mortality of appendiceal cancer were on the rise (Shaib et al. Citation2017; Siegel et al. Citation2019). Therefore, appendiceal cancer should have been got more and more attention from surgeons and scholars.
The appendiceal adenocarcinoma, containing mucous, non-mucous (colonic), and signet-ring cell adenocarcinoma (McCusker et al. Citation2002; Ciarrocchi et al. Citation2016), ranks as the most primary malignancy among various pathological subtypes of appendiceal cancer (Ciarrocchi et al. Citation2015). Yet there is limited information on the treatment of appendiceal adenocarcinoma. The National Comprehensive Cancer Network (NCCN) recommends systemic chemotherapy for appendiceal adenocarcinoma in accordance with the NCCN guidelines for colon cancer because of the lack of large sample data (Benson et al. Citation2017). However, are the treatment methods fit to appendiceal cancer? It is unclear, especially for patients after surgery, which, mainly right hemicolectomy, is current the main treatment for appendiceal cancer (Turaga et al. Citation2013).
The Surveillance, Epidemiology, and End Results (SEER) database is the recognized authority on cancer statistics, recording the morbidity and mortality of patients with malignant tumors in the United States. SEER program publishes data about cancer incidence and survival rates based on population-based cancer registries that cover almost 34.6% of the U.S. population (Li et al. Citation2019). Nomogram can transform the complex regression model into a visual graph, making the results of the prediction model more readable and convenient for evaluation, and is able to provide the accuracy of individual prognostic prediction (Iasonos et al. Citation2008; Balachandran et al. Citation2015). In addition, it should be noted that some tumors in the American Joint Committee on Cancer (AJCC) TNM 8th Edition Staging System indicate that in a future version, they will consider nomogram for patient specific prognostic assessments (Lydiatt et al. Citation2017).
Therefore, the aim of our study was to create nomograms predicting postoperative overall survival (OS) and cancer-specific survival (CSS) in patients with appendiceal cancer after surgery based on the SEER database.
Material and methods
Patients
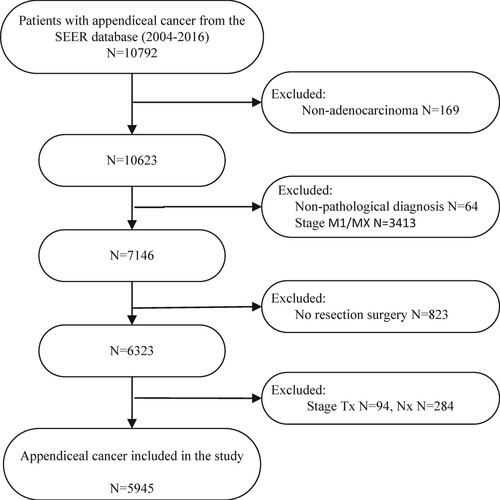
The study collected the data of all patients with appendiceal cancer from the SEER database during 2004–2016. The selection criteria were as follows: (1) patients with pathological diagnosis of appendiceal adenocarcinoma (histology recode: 8140–8389 and 8440–8499); (2) patients undergoing resection and with exact TNM stage information (refer to the AJCC TNM 8th Edition Staging System); (3) patients without distant metastases before surgery. According to these criteria, a total of 5945 patients were included in the study. The detailed screening process is shown in Figure . In this study, detailed information about patients with appendiceal cancer contained the age of diagnosis, race, gender, pathological grade, pathological type, TNM stage, type of surgery, radiotherapy and chemotherapy, regional nodes examination (RNE), tumor size, and CEA level. With reference to previous data (Enblad et al. Citation2018) and lymph node dissection experience in colorectal cancer, we grouped the number of lymph node examinations into 0–4, 4–7, 8–11, and≥12.
Figure 1. Flow chart of case inclusion and exclusion.
Statistical analysis
First, the appendiceal cancer patients meeting the inclusion criteria were randomly assigned to the training group (n = 3963) or the validation group (n = 1982) employing the randomization function of SPSS25.0 (IBM, Armonk, NY, USA). We used the R statistical software version 3.5 (http://www.r-project.org) with the survival and rms packages to build nomograms, and risk Regression package to evaluate the performance of the nomograms. SPSS 25.0 software was also utilized for univariate and multivariate Cox proportional hazard regression analysis to assess prognostic factors. Variables were calculated through the hazard ratio (HR) and the corresponding 95% confidence intervals (CI). The concordance index (C-index), the calibration diagram, the decision curve analysis (DCA) and time-dependent receiver operating characteristic (ROC) curve were used to evaluate the effect of nomograms. This study exists two primary endpoints, OS and CSS. OS was defined as the time interval between diagnosis and death due to any cause or the time of last follow-up with patients still alive. CSS was computed from the time of diagnosis to the time of death attributed to appendiceal cancer or still alive at last follow-up censored. In this study, all p values ≤0.05 were statistically significant.
Results
Basic characteristics of the patients
A total of 5945 patients were involved in the study. Randomization was performed according to the ratio of 2:1, with 3963 patients in the training group and 1982 patients in the validation group. The detail information of patients, including age at diagnosis, race, gender, histological grade, type of pathology, TNM stage, RNE, type of surgery, radiotherapy and chemotherapy, tumor size and CEA was shown in Table . The total population was mainly female (3092, 52.01%). About 67.79% of the total population were younger than 65 years. A total of 2870(48.28%) patients underwent appendectomy and 3075(51.72%) underwent colectomy. 2959 patients (49.77%) examined more than 12 lymph nodes. The number of patients receiving chemotherapy was 1251, about 21.04%. Only 104 (1.75%) patients underwent radiotherapy.
Table 1. The basic and clinical features of appendiceal cancer.
Construction of the OS and CSS nomograms
In the univariate Cox regression analysis, we discovered that both of OS and CSS did not relate to race, gender, and type of surgery in appendiceal cancer patients after surgery. Variables with significant difference in the univariate analysis were further involved in multivariate analysis. The multivariate analysis identified that postoperative OS related to 7 variables, including age at diagnosis, histological grade, T stage, N stage, RNE, tumor tissue size, and CEA (Table ). The multivariate analysis demonstrated that postoperative CSS was associated with nine variables, including age at diagnosis, histological grade, T stage, N stage, RNE, radiotherapy and chemotherapy, tumor tissue size, and CEA (Table ).
Table 2. Univariate and multivariate analysis of OS in the training group.
Table 3. Univariate and multivariate analysis of CSS in the training group.
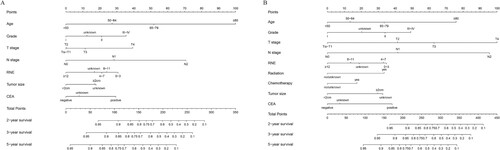
All of the independent prognostic factors were utilized to erect the predictive nomograms for OS and CSS in this study. The prognostic nomograms for estimating the 2-, 3-, and 5-year CSS and OS was displayed in Figure . The nomogram assigned a score to each prognostic variable. These scores were added to the total scores of the 2-, 3-, and 5-year OS and CSS prediction scales for patients with appendiceal cancer after surgery to construct an internally validated prediction nomogram.
Figure 2. Nomograms that predict 2-year, 3-year, and 5-year overall survival (A) and cancer-specific survival (B) in patients with appendiceal cancer after surgery.
Verification of the OS and CSS nomograms
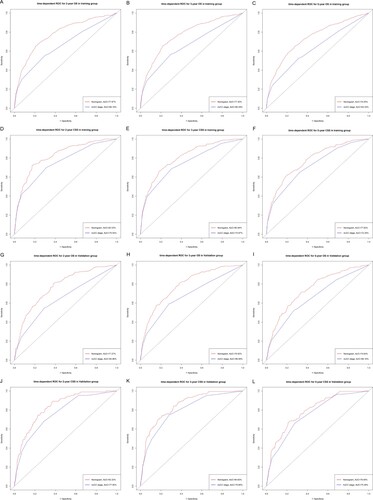
We used multiple methods to verify the predictive effects of the nomogram, including the C-index, the calibration diagram, the decision curve analysis and time-dependent ROC curve. The C-index of OS and CSS nomograms was 0.76 (95% CI 0.74–0.78) and 0.80 (95% CI 0.78–0.82) in training group, respectively. The C-index for the validation group was 0.77 (OS, 95% CI 0.74–0.79) and 0.81 (CSS, 95% CI 0.78–0.84). These results attested that our prognostic nomograms were fairly accurate. And the calibration diagram indicated that the actual survival rate was very compatible with the nomogram prediction (Figure ). The DCA curves suggested that the OS and CSS nomograms were superior to AJCC TNM 8th Edition Staging System regarding the predictive effect (Figure ). It could be seen from time-dependent ROC curve results that nomograms have a better sensitivity and specificity comparing with AJCC TNM 8th Edition Staging System (Figure ).
Figure 3. The calibration curve of nomograms. 2-year (A), 3-year (B), 5-year (C) overall survival nomogram calibration curves, 2-year (D), 3-year (E), 5-year (F) cancer-specific survival nomogram calibration curves in the training group; 2-year (G), 3-year (H), 5-year (I) overall survival nomogram calibration curves, 2-year (J), 3-year (K), 5-year (L) cancer-specific survival nomogram calibration curves in the validation group.
Note: The dashed line indicates an excellent match between actual survival results (y-axis) and nomogram predictions (x-axis). The closer the dotted line to the point, the higher the prediction accuracy. OS, overall survival; CSS, cancer-specific survival.
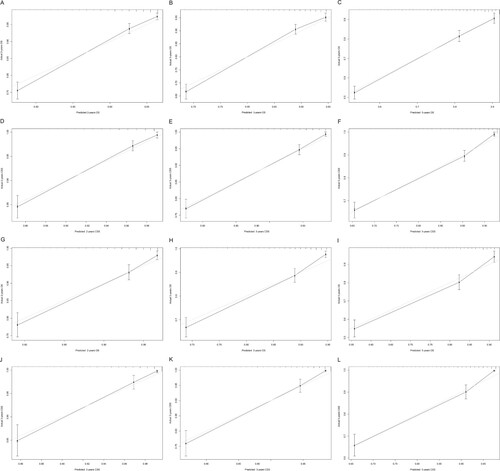
Figure 4. Decision curve analysis for nomograms compared with AJCC TNM. DCA curves of 2-year (A), 3-year (B), 5-year (C) overall survival nomogram, DCA curves of 2-year (D), 3-year (E), 5-year (F) cancer-specific survival nomogram in training group; DCA curves of 2 years (G), 3 years (H), and 5 years (I) total survival nomogram, DCA curves of 2 years (J), 3 years (K), 5 years (L) cancer-specific survival nomograms in the validation group. AJCC, American Joint Committee on Cancer.
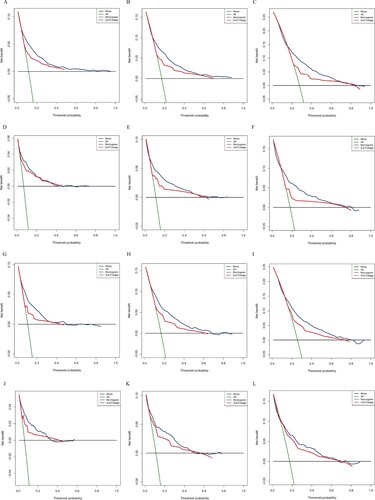
Figure 5. ROC curves of nomograms. ROC curves of 2-year (A), 3-year (B), 5-year (C) overall survival nomogram, ROC curves of 2-year (D), 3-year (E), 5-year (F) cancer-specific survival nomogram in training group; ROC curves of 2 years (G), 3 years (H), and 5 years (I) total survival nomogram, ROC curves of 2 years (J), 3 years (K), 5 years (L) cancer-specific survival nomograms in the validation group. ROC, receiver operating characteristic; OS, overall survival; CSS, cancer-specific survival.
Patient risk stratification
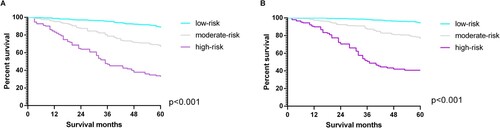
The cut-off values of the OS total score obtained through X-tile analysis were 98 and 163. According to the cut-off values, patients were divided into low-risk, moderate-risk and high-risk groups. The Kaplan–Meier analysis found that the low-risk group held the best prognosis, with the 5-year survival rate reaching 88.1%. Followed by the moderate-risk group (the 5-year survival rate of 66.5%), and the high-risk group (the 5-year survival rate of 31.8%) (Figure A). The cut-off values of the CSS total score obtained through X-tile analysis were 161 and 241. Depending on the cutoff values, the low-risk group showed the best prognosis with a 5-year survival rate of 94.2%, followed by the moderate-risk group with a 5-year survival rate of 77.3%. The high-risk group existed the worst prognosis with a 5-year survival rate of 43.8% (Figure -B). Similarly, among the OS and CSS total scores of the validation group, the low-risk group had the best prognosis, the moderate-risk group followed, and the high-risk group had the worst prognosis (Figure ).
Figure 6. X-tile analysis is used to determine the cut-off value of the OS(A) total score and CSS (B)total score. Note: Cutoff values of OS total score: 98 and 163; cutoff values of CSS total score: 161 and 241. Histograms and Kaplan Meier analysis are based on these cutoffs. OS, overall survival; CSS, cancer-specific survival.
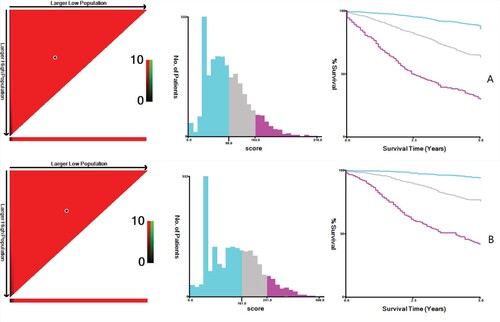
Figure 7. K–M survival curves in validation group. A: K–M survival curve of OS; B: K–M survival curve of CSS. OS, overall survival; CSS, cancer-specific survival.
Discussion
Appendiceal cancer is a rare tumor with a high degree of malignancy and an increasing incidence, and the main comprehensive treatment principles of appendiceal cancer mainly refer to right colon cancer. Although surgical and other treatments have made progress in local tumor control for appendiceal cancer, mortality remains high and long-term survival is worse than for colon cancer (Son et al. Citation2016). Therefore, to provide a personalized estimate of OS and CSS and risk stratification, we developed two nomograms to combine the independent risk prognostic factors after survival analysis for patients with postoperative appendiceal cancer.
Several obvious advantages can be found in this study compared with previous studies that established appendiceal cancer nomograms. First of all, we are the first to build nomograms specifically for the survival of patients with appendiceal cancer after surgery, while the previous nomograms did not specifically serve postoperative patients and was limited to mucinous adenocarcinoma (Xie et al. Citation2016; Yan et al. Citation2019). Furthermore, compared to the previous two studies which only included 1404 and 3234 patients (Xie et al. Citation2016; Yan et al. Citation2019), our nomogram was based on a larger data study, which included 5945 patients, and was validated in 1982 patients. Second, we included more commonly used prognostic factors in clinical practice compared with previous nomograms, such as preoperative CEA, chemotherapy and tumor size, which means that the prognosis of patients with appendiceal cancer can be more accurately predicted. Finally, the capability of our nomograms was assessed by C-index, DCA, ROC and calibration curve compared with previous studies. Both C-index and area under the curve are greater than 0.7, indicating that the model has a high accuracy, and the calibration curve is in good agreement with the 45° reference line. In addition, according to ROC analysis, the cut-off value was obtained for risk stratification, and the patients assigned to the high-risk group had a lower survival rate.
Our nomograms contained several prognostic factors commonly used in clinical practice. Age, pathological grade and T stage were key factors affecting the prognosis of patients with postoperative appendiceal cancer. Our research suggested that older age, poorly differentiated or undifferentiated pathological grade and deeper local tumor invasion lead to a worse prognosis, which is consistent with the results of other researches that have studied the relationship between these factors and the prognosis of appendiceal cancer (Turaga et al. Citation2012; Overman et al. Citation2013; Shaib et al. Citation2017). Previous study demonstrated that lymph node metastasis and CEA were important predictors of OS (Alexandraki et al. Citation2016; Ihemelandu et al. Citation2017). N stage and CEA were also closely associated with postoperative OS and CSS in patients with appendiceal cancer, that is, patients with lymph node metastasis owned a worse prognosis and patients with elevated CEA levels hold poor postoperative OS and CSS. This phenomenon may be attributed to lymph node metastasis and elevated CEA suggesting a strong likelihood of recurrence (Nash et al. Citation2015; Wang et al. Citation2020). We found that the RNE affected postoperative OS and CSS in patients with appendiceal cancer and patients with more than 12 examination numbers possessed the best prognosis. Similarly, Fleischmann et al. claimed that patients who examined 12 or more regional lymph nodes had better OS and CSS comparing those with RNE <12 (Fleischmann et al. Citation2017). The result displayed the important significance of removing a sufficient number of lymph nodes during surgery for appendiceal cancer.
More importantly, there are some interesting and meaningful findings in this study. Some researches revealed that multidisciplinary therapies, especially adjuvant chemotherapy and radiotherapy after surgical resection, have been increasingly applied to treat patients with resectable gastrointestinal cancer (Ragnhammar et al. Citation2001; Blum et al. Citation2016; Wu et al. Citation2020). However, it is still uncertain whether comprehensive therapy can improve the survival rate of patients with appendiceal cancer. Asare et al. announced that chemoradiotherapy cannot improve the survival for patients with appendiceal cancer (Asare et al. Citation2016), which were consistent with the results of this study. Moreover, the nomogram predicting postoperative CSS indicated that radiotherapy and chemotherapy may play as risk factors for patients with resectable appendiceal cancer. Which may be because of the toxic side effects of chemoradiation. Therefore, oncologist needs to further explore the specific chemotherapy regimen for appendiceal cancer rather than utilize the current chemotherapeutic strategy, which mainly learned from the experience of colorectal cancer (Tejani et al. Citation2014). Previous studies confirmed that tumor size is adverse prognostic factor for patients with appendiceal cancer (Kyang et al. Citation2019). It was closely related to postoperative OS and CSS in patients with appendiceal cancer that patients with tumors larger than 2 cm owned a worse prognosis comparing with those with tumors smaller than 2 cm. Thus we suggested that it is necessary to learn some experience regarding the staging system from some other tumors, such as Gastrointestinal Stromal Tumors (GIST) and pancreatic cancer, which incorporated the tumor size into the tumor staging system.
At present, the tumor stage of appendiceal cancer mainly depends on the AJCC TNM System. However, the results of previous studies indicated that the TNM system is not very ideal to evaluate the prognosis for appendiceal cancer (Xie et al. Citation2016). Our nomograms showed a clear advantage over the AJCC TNM 8th Edition Staging System. The time-dependent ROC curves showed that the nomograms provided a higher sensitivity and specificity comparing the AJCC staging system. The DCA curve showed that the nomograms possessed superior clinical value with the superior net benefits and net reduction in interventions per 100 patients.
Our study owned several advantages as well as limitations. The limitation was that some clinical factors, which may affect the prognosis of appendiceal cancer, were not included in the SEER database, such as intraoperative intraperitoneal chemotherapy (IPC) and cancerous emboli in the lymphatic vessels and blood vessels. In addition, this study was a retrospective study and needs to be further verified by a prospective study. Despite some limitations, our study, based on a large sample of 5945 patients, greatly reduced potential bias in the analysis. In addition, we successfully constructed the novel nomograms that could be considered as useful prognostic models with excellent predictive function to assess the OS and CSS for postoperative appendiceal cancer.
Conclusion
We constructed new nomograms based on a large database that can accurately predict the OS and CSS of patients with appendiceal cancer after surgery. The new nomograms call into question the current treatment strategies for appendiceal cancer, which primarily is based on chemoradiotherapy of colorectal cancer. It is urgent to further explore the treatment options suiting for appendiceal cancer.
Data accessibility
The data that support the findings of this study are openly available in the Accessing the 1975-2016 SEER data at https://seer.cancer.gov/data/access.html. The URL of the database is http://seer.cancer.gov/ and the RRID of the database is nif-0000-21366.
Acknowledgments
We thank all participants who contributed to the research. We would also like to thank the surveillance for free data, the Epidemiology and End Results Project (SEER) database, and the website (http://www.r-project.org) for free R software.
The first author, Yuan Zhou, and corresponding author, Dan Wang, gratefully acknowledge financial support from China Scholarship Council.
Disclosure statement
No potential conflict of interest was reported by the author(s).
References
- Alexandraki KI, Kaltsas GA, Grozinsky-Glasberg S, Chatzellis E, Grossman AB. 2016. Appendiceal neuroendocrine neoplasms: diagnosis and management. Endocr Relat Cancer. 23:R27–R41.
- Asare EA, Compton CC, Hanna NN, Kosinski LA, Washington MK, Kakar S, Weiser MR, Overman MJ. 2016. The impact of stage, grade, and mucinous histology on the efficacy of systemic chemotherapy in adenocarcinomas of the appendix: analysis of the national cancer data base. Cancer. 122:213–221.
- Balachandran VP, Gonen M, Smith JJ, DeMatteo RP. 2015. Nomograms in oncology: more than meets the eye. Lancet Oncol. 16:e173–e180.
- Benson AR, Venook AP, Cederquist L, Chan E, Chen YJ, Cooper HS, Deming D, Engstrom PF, Enzinger PC, Fichera A, et al. 2017. Colon cancer, version 1.2017, NCCN clinical practice guidelines in oncology. J Natl Compr Canc Netw. 15:370–398.
- Blum MM, Elimova E, Ajani JA. 2016. Current concepts and future potential in neoadjuvant chemotherapy for esophageal cancer. Expert Rev Gastroenterol Hepatol. 10:383–392.
- Ciarrocchi A, Pietroletti R, Carlei F, Amicucci G. 2016. Clinical significance of metastatic lymph nodes in the gut of patients with pure and mixed primary appendiceal carcinoids. Dis Colon Rectum. 59(6):508–512.
- Ciarrocchi A, Pietroletti R, Carlei F, Necozione S, Amicucci G. 2015. Propensity adjusted appraisal of the surgical strategy for appendiceal carcinoids. Tech Coloproctol. 19(1):35–41.
- Enblad M, Graf W, Birgisson H. 2018. Risk factors for appendiceal and colorectal peritoneal metastases. Eur J Surg Oncol. 44:997–1005.
- Fleischmann I, Warschkow R, Beutner U, Marti L, Schmied BM, Steffen T. 2017. Improved survival after retrieval of 12 or more regional lymph nodes in appendiceal cancer. Eur J Surg Oncol. 43:1876–1885.
- Iasonos A, Schrag D, Raj GV, Panageas KS. 2008. How to build and interpret a nomogram for cancer prognosis. J Clin Oncol. 26:1364–1370.
- Ihemelandu C, Fernandez S, Sugarbaker PH. 2017. A prognostic model for predicting overall survival in patients with peritoneal surface malignancy of an appendiceal origin treated with cytoreductive surgery and hyperthermic intraperitoneal chemotherapy. Ann Surg Oncol. 24:2266–2272.
- Kyang LS, Alzahrani NA, Alshahrani MS, Rahman MK, Liauw W, Morris DL. 2019. Early recurrence in peritoneal metastasis of appendiceal neoplasm: survival and prognostic factors. Eur J Surg Oncol. 45:2392–2397.
- Li Y, Zhao L, Gungor C, Tan F, Zhou Z, Li C, Song X, Wang D, Pei Q, Liu W. 2019. The main contributor to the upswing of survival in locally advanced colorectal cancer: an analysis of the SEER database. Therap Adv Gastroenterol. 12:1756284819862154.
- Lydiatt WM, Patel SG, O'Sullivan B, Brandwein MS, Ridge JA, Migliacci JC, Loomis AM, Shah JP. 2017. Head and neck cancers-major changes in the American Joint Committee on cancer eighth edition cancer staging manual. CA Cancer J Clin. 67:122–137.
- Marmor S, Portschy PR, Tuttle TM, Virnig BA. 2015. The rise in appendiceal cancer incidence: 2000-2009. J Gastrointest Surg. 19:743–750.
- McCusker ME, Cote TR, Clegg LX, Sobin LH. 2002. Primary malignant neoplasms of the appendix: a population-based study from the surveillance, epidemiology and end-results program, 1973–1998. Cancer. 94:3307–3312.
- Nash GM, Smith JD, Tang L, Weiser MR, Temple LK, O'Reilly E, Saltz LB, Guillem JG, Paty PB. 2015. Lymph Node Metastasis Predicts Disease Recurrence in a Single-Center Experience of 70 Stages 1-3 Appendix Cancers: A Retrospective Review. Ann Surg Oncol. 22:3613–3617.
- Overman MJ, Fournier K, Hu CY, Eng C, Taggart M, Royal R, Mansfield P, Chang GJ. 2013. Improving the AJCC/TNM staging for adenocarcinomas of the appendix: the prognostic impact of histological grade. Ann Surg. 257:1072–1078.
- Ragnhammar P, Hafstrom L, Nygren P, Glimelius B. 2001. A systematic overview of chemotherapy effects in colorectal cancer. Acta Oncol. 40:282–308.
- Shaib WL, Goodman M, Chen Z, Kim S, Brutcher E, Bekaii-Saab T, El-Rayes BF. 2017. Incidence and survival of appendiceal mucinous neoplasms: A SEER analysis. Am J Clin Oncol. 40:569–573.
- Siddharthan RV, Byrne RM, Dewey E, Martindale RG, Gilbert EW, Tsikitis VL. 2019. Appendiceal cancer masked as inflammatory appendicitis in the elderly, not an uncommon presentation (Surveillance Epidemiology and End Results (SEER)-medicare analysis). J Surg Oncol. 120:736–739.
- Siegel RL, Miller KD, Jemal A. 2019. Cancer statistics, 2019. CA Cancer J Clin. 69:7–34.
- Son IT, Ahn S, Park KJ, Oh JH, Jeong SY, Park HC, Heo SC, Youk EG, Park JT, Ihn MH, et al. 2016. Comparison of long-term oncological outcomes of appendiceal cancer and colon cancer: A multicenter retrospective study. Surg Oncol. 25:37–43.
- Tejani MA, ter Veer A, Milne D, Ottesen R, Bekaii-Saab T, Benson AR, Schrag D, Shibata S, Skibber J, Weiser M, et al. 2014. Systemic therapy for advanced appendiceal adenocarcinoma: an analysis from the NCCN Oncology outcomes database for colorectal cancer. J Natl Compr Canc Netw. 12:1123–1130.
- Turaga KK, Pappas S, Gamblin TC. 2013. Right hemicolectomy for mucinous adenocarcinoma of the appendix: just right or too much? Ann Surg Oncol. 20:1063–1067.
- Turaga KK, Pappas SG, Gamblin T. 2012. Importance of histologic subtype in the staging of appendiceal tumors. Ann Surg Oncol. 19:1379–1385.
- Wang D, Liu C, Yan T, Li C, Gungor C, Yang Q, Xu Y, Zhao L, Pei Q, Tan F, Li Y. 2020. A nomogram for predicting lymph nodal metastases in patients with appendiceal cancers: An analysis of SEER database. J Invest Surg. 2020 Jan 14; 1–7.
- Wu SG, Xie WH, Zhang ZQ, Sun JY, Li FY, Lin HX, Yong B, He ZY. 2016. Surgery combined with radiotherapy improved survival in Metastatic esophageal cancer in a surveillance epidemiology and end results population-based study. Sci Rep. 6:28280.
- Xie X, Zhou Z, Song Y, Li W, Diao D, Dang C, Zhang H. 2016. The management and prognostic prediction of adenocarcinoma of appendix. Sci Rep. 6:39027.
- Yan Q, Zheng WJ, Chen QL, Wang BQ, Luo HY, Xue J, Wang XW. 2019. Nomogram to predict overall survival and disease-specific survival with appendiceal mucinous adenocarcinoma. Medicine (Baltimore). 98:e17332.