
Abstract
The present study investigated the effect of Trigonella foenum-graecum extract (TFGE) on GH3 and HEK293 pituitary adenoma cell growth in vitro in mice model in vivo and evaluated the underlying mechanism. TFGE exposure in dose-dependent manner suppressed the viability of GH3 and HP75 cells at 5–30 µM concentrations. Treatment of GH3 and HP75 cells with 30 µM TFGE inhibited colony formation significantly (P < .05) compared to the un-exposed cells. In GH3 and HP75 cells, TFGE exposure suppressed invasion potential significantly (P < .05) at 5 and 30 µM concentrations. TFGE treatment at 5 and 30 µM for 72 h significantly (P < .05) elevated induction of apoptosis. The H19 expression was significantly (P < .05) inhibited by TFGE-treatment in GH3 and HEK293 cells. TFGE treatment at 2.5 and 10 mg/kg doses led to a significantly (P < .05) suppression in the tumor growth in HP75 cell-implanted mice. TFGE treatment of GH3 and HP75 cells at 5 and 30 µM down-regulated 4E-BP1 activation. TFGE treatment inhibits GH3 and HEK293 cell viability and inhibits tumor development. It suppresses H19 expression and upregulates 4E-BP1 phosphorylation in GH3 and HEK293 cells. Therefore, TFGE may be used for the treatment of pituitary adenoma.
Introduction
Pituitary adenoma, one of the commonly diagnosed intracranial tumor alone accounts for around 25% of the total cases of intracranial tumors (Taniguchi et al. Citation2020; Gupta et al. Citation2020; Gillam et al. Citation2006). It has been demonstrated that ∼40% of the pituitary adenoma patients have prolactinomas (Taniguchi et al. Citation2020; Gupta et al. Citation2020; Gillam et al. Citation2006). Clinically pituitary adenoma is associated with impaired vision, infertility problems and various metabolic syndromes because of aberrant hormone secretion or oncothlipsis (Chen et al. Citation2017). Non-availability of effective therapeutic strategies and complicated pathogenesis are the challenging hurdles for the treatment of pituitary tumors, especially for prolactinomas resistant to drugs and refractory pituitary tumors (Melmed Citation2011).
Mammalian target of rapamycin (mTOR) pathway plays an important role in pituitary tumorigenesis and has been identified as a treatment target (Gillam et al. Citation2006; Lee et al. Citation2015). The precise mechanism of mTOR association with the pituitary tumorigenesis is yet to be elucidated completely (Gillam et al. Citation2006; Lee et al. Citation2015). It has been found that mTOR nucleates two different protein complexes, one known as the mTOR complex 1 (mTORC1) and second mTOR complex 2 (mTORC2) (Laplante and Sabatini Citation2012). Many processes such as the proliferation of cells, growth and metabolism are regulated by mTOR (Saxton and Sabatini Citation2017). Multiple pathophysiological disorders including, cancer is implicated with the mTORC1 dysregulation (Hausch et al. Citation2013). Three core subunits of mTORC1 include mTOR, mLST8 and Raptor. The role of Raptor is to provide substrates for mTORC1. Anabolic processes in cells such as the synthesis of proteins and lipids as well as promotion of cell growth are regulated by mTORC1. Two main substrates of mTORC1 are S6K1 and 4E-BP1 and it is established that S6K1 is activated by mTORC1 through phosphorylation (Saxton and Sabatini Citation2017). Phosphorylated S6K1 promotes mRNA translation by activation of many translational regulators including, RPS6, eIF4B and PDCD4 (Choo et al. Citation2008). Inhibition of translation initiation of cap-dependent proteins is induced by mTORC1 through 4E-BP1 phosphorylation and subsequent increase in eIF4F complex binding to 5′ cap-dependent mRNA translation (Dunlop et al. Citation2014).
A multifunctional long noncoding RNA, H19 is involved in the regulation of metabolism of glucose, tumor growth as well as embryo development (Gao et al. Citation2014). Previous studies have demonstrated oncogenic as well as tumor-inhibitory properties of H19 (Zhou et al., Citation2015; Yan et al. Citation2015). In pituitary tumors, H19 expression is generally down-regulated and has been found to be associated with the tumor progression (Ze et al. Citation2018).
Trigonella foenum-graecum plant has variety of applications in traditional medicine which include anti-diabetes, wound healing, anti-inflammatory, as cholesterol-lowering agent and for treatment of gastrointestinal ailments. The plant extract has shown several properties such as anticancer (Alizadeh et al. Citation2009), anti-hyperglycemic (Kulkarni et al. Citation2012), oxidant quencher (Subhashini et al. Citation2011), anti-inflammatory (Pandian et al. Citation2002) and anti-rheumatic potential. The present study investigated Trigonella foenum-graecum extract (TFGE) against pituitary cancer progression and elucidated the underlying mechanism.
Materials and methods
Cell culture
GH3 and HP75 cell lines were provided by the American Type Culture Collection. The cell lines were cultured for 24 h in Dulbecco’s modified Eagle’s medium (DMEM) (Gibco™) containing fetal bovine serum (FBS) (10%; v/v) and antibiotics (penicillin, 100 U/mL and streptomycin, 100 μg/mL; Gibco™) under a humid atmosphere with 5% CO2.
Analysis of cell proliferation
Cell at 5 × 10⁵ cells/ per density in 96-well plates were cultured for overnight in an incubator at 37°C under 5% CO2. Then DMEM medium mixed with 5, 10, 15, 20, 25 and 30 µM TFGE was added to the plates and cells were incubated for 72 h. Afterwards, Maze Test Solution (MTS) was added and incubation was carried out for 4 h more at 37°C. The plate reader (TECAN, Switzerland) was used for absorbance measurements at 490 nm and viable cells were counted using CellTiter-Glo luminescent assay (Promega, G3588).
Colony formation assay
GH3 and HP75 cells were distributed at 2 × 10⁵ cells/well density in six-well plates and allowed to grow for 2 weeks. The cells were fixed on treatment with 4% paraformaldehyde, followed by staining with crystal violet solution (1%; Sangon Biotech) for 20 min. The plates after washing and air drying were photographed to examine the colony formation in each well.
Transwell assay
Invasion of GH3 and HP75 cells was examined using a Transwell assay with Matrigel (BD Biosciences). Chambers of Transwell were coated with Matrigel (30 μL) and incubated for 45 min at 37°C. In the upper chambers, cells at 5 × 10⁵ cells/well density were distributed in DMEM mixed with 2% FBS. Lower chamber contained DMEM (480 μL) mixed 10% FBS.Following incubation for 24 h, 4% paraformaldehyde was used to fix the invaded cells for 15 min at 37°C, while as a cotton swab was used for cleaning of the non-invaded cells. Crystal violet solution (1 mg/mL) was used for staining of the invaded cells for 10 min and then invasion was examined using Leica microscope (Leica DMR 3000; Leica Microsystems GmbH).
Analysis for apoptosis
GH3 and HP75 cells were grown in six-well plates on the coverslips and treated with TFGE for 72 h in an incubator. The coverslips were then washed three times in phosphate-buffered saline and subsequently treated with 1× binding buffer. Staining of the cells was performed under darkness with annexin-V/FITC antibody for 40 min followed by washing of the cells with 1× binding buffer. Afterwards, the cells were subjected to fixing with formaldehyde (2%) and fluorescence was recorded using Olympus-IX71 inverted microscope connected to FITC and rhodamine filters.
Western blot
The cells exposed to 5 and 30 µM doses of TFGE for 72 h were treated for 45 min at 4°C with RIPA buffer (150 Mm sodium chloride, 0.5% sodium deoxycholate, 1% NP-40, 0.1% SDS, 50 mM Tris-HCl pH 8.0, 10 mM EDTA and 1 mM PMSF; Sigma). The lysate was centrifuged for 25 min at 14,000g and protein concentration was estimated using the BCA Kit (Pierce,Rockford, IL). The 25 µg samples were loaded on 10% SDS-PAGE and subsequently transferred to nitrocellulose membranes which were blocked by incubation with blocking buffer. Incubation of the membranes with primary antibodies including anti-Akt (cat. no. sc-135829; 1:1200), anti-p-S473-Akt (cat. no. sc-7985-R, 1:1000) and anti-β-actin (cat. no. sc-8432/sc-130656, 1:1000; Santa Cruz Biotechnology, Inc. Dallas, TX, USA) at were performed for overnight at 4°C. Probing of the protein bands was made by 2 h of incubation with secondary antibody (cat. no. sc-358 914, 1:10,000) at 37°C. Enhanced chemiluminescence detection kits (GE Healthcare Life Sciences) were used for the detection of the bands and Scion Image software (version 4.0) for quantification of the protein expression.
Establishment of mice xenograft model
A total of 50 female nu/nu athymic mice (6-week old) were obtained from the Experimental Animal Center, Chinese Medical University (Shenyang, China). The mice were housed individually in cages under pathogen-free conditions in the animal experiment room and given free access to water and food. The temperature in the room was controlled at 23 ± 2°C, humidity 55% and mice were exposed to 12h light and dark cycles. Approval for the study was obtained from the Animal Ethics Committee, Shandong Provincial Third Hospital, Cheeloo College of Medicine, Shandong University, China. Experimental procedures were conducted in accordance with the guidelines issued by the National Institutes of Health, USA. Mice were randomly separated into six groups of 5-each: Normal, model, TFGE and two TFGE treatment (at 2.5 and 10 mg/kg doses) treatment groups. HP75 cells (2 × 10⁴) in physiological saline were subcutaneously injected into the mice to induce tumor. TFGE was intra-gastrically given to mice at 2.5 and 10 mg/kg doses in physiological saline alternately for 20 days after HP75 cell administration. Volume of xenografts was measured using the caliper and calculated by the formula: V = length × breadth2/2. Tumor dimensions and weight of mice was measured alternately during the study. On day 21, the mice were sacrificed, tumors were extracted for measurement of volume and other assays.
RNA extraction and qRT-PCR
Total RNA from TFGE-treated/untreated cells was isolated using TRIzol reagent (Invitrogen) in accordance with the instructions from the manufacturer. Concentration of RNA was assessed using NanoDrop 1000 spectrophotometer and then equal amounts were reverse-transcribed to complementary DNA (cDNA) using the commercially available kits (Takara). The conditions used for reverse transcription were: initial 58 min at 37°C, 5 min at 84°C, 5 min at 4°C. The qPCR analysis of synthesized cDNAs was performed using the SYBR Green Supermix reagent (Invitrogen). Procedure for PCR consisted of: 10 min at 94°C, 15 s for 93°C, 40 cycles for 45 s at 58°C, for 15 s at 94°C, for 1 min at 58°C, for 15 s at 94°C and for 15 s at 58°C. Expression of the genes was calculated using the formula 2-DDCT.
Statistical analysis
Data were analyzed statistically using the GraphPad Prism software, version 6 (La Jolla, CA, USA). The presented data are the mean ± SEM of triplicate measurements. Differences between groups were determined using a one-way analysis of variance. At P < .05 differences were considered significant statistically.
Results
TFGE inhibits GH3 and HP75 cell growth
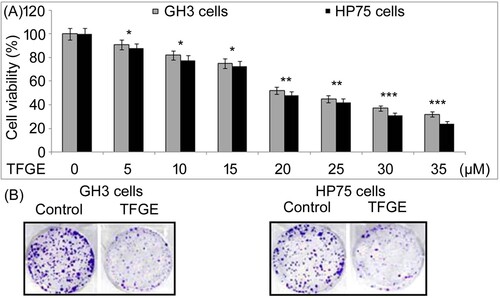
TFGE exposure in dose-dependent manner suppressed viability of GH3 and HP75 cells at 5–30 µM concentrations (Figure (A)). Viability of GH3 cells decreased on treatment with 30 µM TFGE to 32% compared to 91% in 5 µM treated cells. Treatment with 5 and 30 µM TFGE reduced HP75 cell viability to 88% and 24%, respectively at 72 h. TFGE exposure of GH3 and HP75 cells at 30 µM inhibited colony formation significantly (P < .05) compared to the un-exposed cells (Figure (B)).
Figure 1. Effect of TFGE on GH3 and HP75 cell growth. (A) TFGE-treated cells at 5–30 µM for 72 h or without TFGE-treatment were analyzed for changes in viability by MTS assay at 72 h. (B) Treatment with TFGE at 5 and 30 µM for 10-days was followed counting of colony formation after crystal violet staining. *P < .05 and **P < .02 vs. unexposed cells.
TFGE inhibits GH3 and HP75 cell invasion in vitro
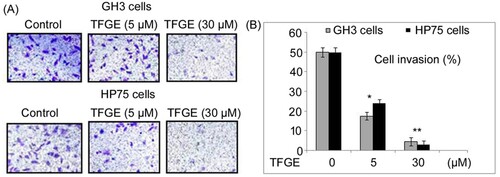
In GH3 and HP75 cells, TFGE exposure suppressed invasion potential significantly (P < .05) at 5 and 30 µM concentrations (Figure ). Invasion of GH3 cells was repressed to 53% and 09%, respectively, on treatment with TFGE at 5 and 30 µM doses. Similarly, TFGE treatment for 72 h at 5 and 30 µM doses reduced HP75 cell invasion to 48% and 06%, respectively.
Figure 2. Effect of TFGE on invasion of GH3 and HP75 cells. (A, B) The cells exposed to TFGE at 5 and 30 µM for 72 h or without exposure to TFGE were analyzed by Transwell assay for invasion ability. *P < .05 and **P < .02 vs. unexposed cells.
TFGE activated GH3 and HP75 cell apoptosis
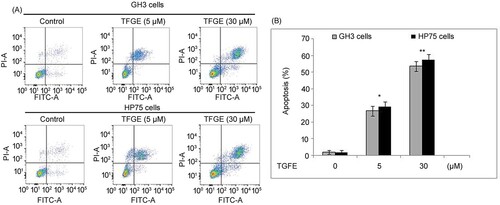
TFGE treatment of GH3 and HP75 cells at 5 and 30 µM for 72 h significantly (P < .05) elevated induction of apoptosis (Figure ). In GH3 cells apoptosis raised to 26.79 and 53.62%, respectively, at 72 h on treatment with 5 and 3 µM TFGE. Apoptotic count in 5 and 30 µM TFGE treated HP75 cells reached to 29.41% and 57.86%, respectively, at 72 h.
Figure 3. Effect of TFGE on apoptosis induction. (A, B) The cells exposed to TFGE at 5 and 30 µM for 72 h or without exposure to TFGE were analyzed for apoptosis by flow Cytometry. *P < .05 and **P < .02 vs. unexposed cells.
TFGE inhibits H19 expression
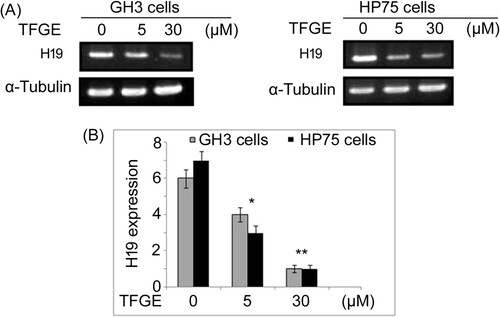
Changes in H19 expression by TFGE-treatment was analyzed in GH3 and HEK293 cells using RT–PCR assay (Figure ). The H19 expression was significantly (P < .05) inhibited by TFGE-treatment in GH3 and HEK293 cells in dose-dependent manner. Decrease in H19 expression by TFGE-treatment was more on exposure to 30 µM doses compared to 5 µM treated cells.
Figure 4. Effect of TFGE on H19 expression. The cells exposed to TFGE at 5 and 30 µM for 72 h or without exposure to TFGE were analyzed for H19 expression by RT-PCR assay. *P < .05 and **P < .02 vs. unexposed cells.
TFGE targets p-AKT expression
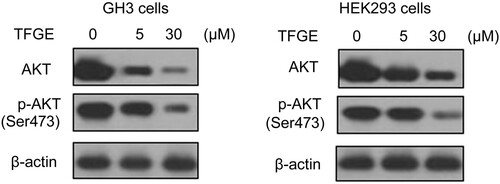
Alteration in AKT phosphorylation in GH3 and HEK293 cells following 72 h of TFGE-treatment was assessed by western blot assay (Figure ). In GH3 and HEK293 cells, TFGE treatment at 5 and 30 μM doses effectively reduced AKT and p-Ser473-AKT expression compared to the control cells. Decrease in AKT phosphorylation by TFGE treatment in GH3 and HEK293 cells was higher at 30 μM concentration compared to the 5 μM treated cells.
Figure 5. Effect of TFGE on AKT phosphorylation. GH3 and HEK293 cells were treated with TFGE at 5 and 30 μM doses for 72 h. Western blotting was used to determination of AKT, and p-Ser473-AKT expression.
TFGE targets 4E-BP1 activation
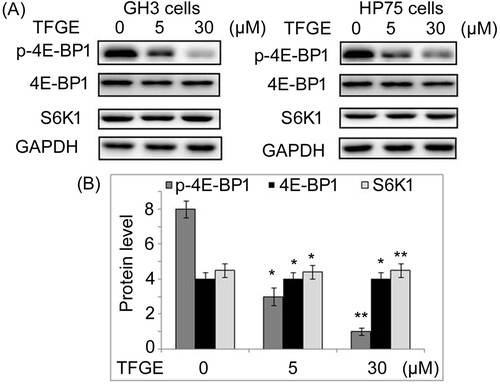
TFGE treatment of GH3 and HP75 cells at 5 and 30 µM down-regulated 4E-BP1 activation prominently at 72 h (Figure ). Activation of S6K1 was not affected by TFGE treatment in GH3 and HP75 cells at 5 and 30 µM. Suppression of p-4E-BP1 expression by TFGE treatment was also observed to minimum level on treatment with 30 µM TFGE.
Figure 6. Effect of TFGE on 4E-BP1 phosphorylation. GH3 and HP75 cells exposed to TFGE at 5 and 30 µM for 72 h were subjected to western blotting for assessment of 4E-BP1 and S6K1 activation. *P < .05 and **P < .02 vs. unexposed cells.
TFGE targets mTORC1–4E-BP1 axis to inhibit tumor growth
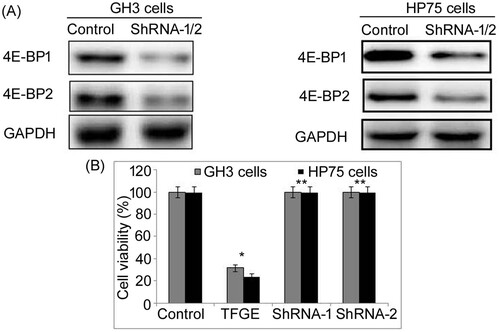
To examine whether TFGE exhibits its effect directly through 4E-BP1 activation inhibition, both 4E-BP1 and 4E-BP2 were knocked down in GH3 and HP75 cells (Figure ). The 4E-BP1 as well as 4E-BP2 knockdown reversed inhibitory effect of TFGE on growth of GH3 and HP75 cells. There was no significant decrease in GH3 and HP75 cells viability following 4E-BP1 and 4E-BP2 knockdown on treatment with TFGE at 5–30 µM doses.
Figure 7. Effect of 4E-BP1 and 4E-BP2 knockdown on TFGE induced 4E-BP1 activation inhibition. GH3 and HP75 cells transfected with shRNA-2 were exposed to TFGE at 5 and 30 µM for 72 h followed by viability measurement using MTS assay. *P < .05 and **P < .02 vs. unexposed cells.
TFGE inhibits pituitary tumor in vivo
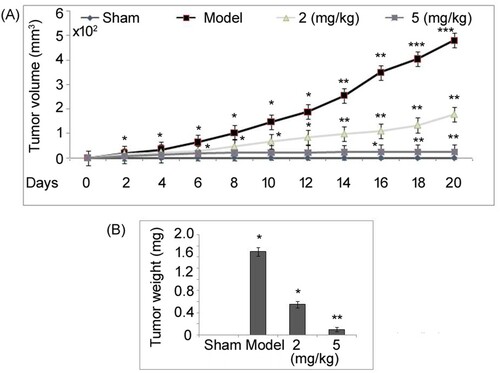
Mice were given 2, 5 and 10 mg/kg doses of TFGE and examined for 45 days to record survival rate and examine if any toxicity developed. It was observed that none of the mice in the three TFGE administered groups (2, 5 and 10 mg/kg doses) died during the 45 days of study. Moreover, no toxicity symptoms were seen in the mice after administration of 2, 5 and 10 mg/kg doses TFGE. Tumor growth suppression by TFGE was evaluated in vivo in a mice model established by grafting subcutaneously HP75 cells into the nude mice (Figure ). Tumors in untreated mice were significantly (P < .05) larger in size at day 21 of HP75 cell implantation than those of the sham group. TFGE treatment at 2.5 and 5 mg/kg doses led to a significantly (P < .05) suppression in tumor growth in HP75 cell implanted mice. However, in 5 mg/kg TFGE treated mice suppression of tumor formation was more prominent compared to 2 mg/kg treatment group.
Figure 8. Effect of TFGE on in vivo tumor growth. (A) HP75 cell (1 × 10⁶) were grafted into nude mice subcutaneously and on day 21 the mice were sacrificed to extract the tumors which were weighed. (B) For measurement of tumor volume, xenograft growth was recorded on alternate days using calipers. *P < .05 and **P < .02 vs. unexposed cells.
Discussion
TFGE has been found to possess several promising activities including, anti-hyperglycaemic (Kulkarni et al. Citation2012), anti-carcinoma (Alizadeh et al. Citation2009), antioxidant (Subhashini et al. Citation2011) and anti-inflammatory potential (Pandian et al. Citation2002). In the present study, TFGE suppressed viability of GH3 and HP75 cells in dose-dependent manner. Moreover, TFGE exposure suppressed GH3 and HP75 cell invasion potential significantly (P < .05) at 5 and 30 µM concentrations. Apoptosis induction in GH3 and HP75 cells was also elevated significantly (P < .05) by TFGE treatment at 72 h. Phosphatidylinositol 3-kinase (PI3K)/AKT signaling activation has been reported to play the main role in cancer cell proliferation by promoting the cell proliferation (Zhang et al. Citation2014; Popova and Jücker Citation2021; Ong et al. Citation2016). Moreover, survival pathways are regulated by AKT activation through apoptosis inhibition and it has been found that Ser473 phosphorylation leads to activation of its kinase. Elevated expression of various proteins associated with PI3 K/AKT pathway are involved in poor clinical prognosis of different cancers (Lin et al. Citation2013; Liu et al. Citation2013). The multi–functional proto–oncogene, C-myc is a main transcription regulator and nuclear phosphoprotein that elevates proliferation, induces apoptosis and arrests cell cycle (Kokontis et al. Citation1994). Expression of c-myc in abnormal manner promotes invasive ability of osteosarcoma cells leading to cancer development (Han et al. Citation2012). Cell proliferation is diminished and tumor growth controlled on attenuation of c-myc protein expression (Liu et al. Citation2014). In multiple cancers such as gastric, colon, pulmonary and breast cancer cells, the c-myc expression is elevated abnormally indicating its significant therapeutic target (Field and Spandidos Citation1990). Trisubstituted-imidazoles have been demonstrated to induce apoptosis in human breast cancer cells through targeting the oncogenic PI3K/Akt/mTOR signaling pathway (Mohan et al. Citation2016). In the present study, TFGE treatment reduced AKT and p-Ser473-AKT expression remarkably in GH3 and HP75 cells. Therefore, TFGE inhibits the growth of GH3 and HP75 cells by targeting the activation of AKT.
In vivo data showed tumor growth suppression by TFGE in mice model established by grafting subcutaneously HP75 cells into the nude mice. TFGE treatment at 2.5 and 10 mg/kg doses led to a significantly (P < .05) suppression in tumor growth in HP75 cell implanted mice. Activation of 4E-BP1 leads to its separation from eIF4E and subsequent coupling with mRNA 7-methylguanosine cap thereby starting the process of translation (Holz et al. Citation2005). The 4E-BP1 has a critical role in the regulation of cell proliferation, growth, differentiation and death by properly controlling the translation initiation (Moerke et al. Citation2007; Dowling et al. Citation2010). Inhibition of 4E-BP1 separation from eIF4E in AKT/Ras tumor mice has been demonstrated to induce proliferation defects (Magnuson et al. Citation2012). These findings indicate that 4E-BP1 has tumor suppressor potential and thus can be explored as molecular chemotherapeutic target (Li et al. Citation2017; Bevan et al. Citation1992). Recently Clinicians have observed that elevated p-4E-BP1 expression is related with poor prognosis of various types of cancers such as ovarian, breast and prostate carcinoma (Armengol et al. Citation2007). In vivo studies have found that targeting 4E-BP1 phosphorylation leads to a prominent suppression on tumor development (She et al. Citation2010; Ni et al. Citation2016). In the present study, TFGE exposure of GH3 and HP75 cells significantly down-regulated 4E-BP1 phosphorylation and thereby prevented its separation from eIF4E. Moreover, TFGE treatment at the same concentrations could not influence activation of S6K1 in GH3 and HP75 cells. In vivo data were inconsistent with the observations from in vitro studies and showed a prominent suppression in p-4E-BP1 expression in adenoma mice model treated with TFGE.
There is enough evidence that 4E-BPs hyperphosphorylation-induced promotion of eIF4E activation is associated with malignant progression of several cancers like prostate, ovary, breast and colon tumor (Rojo et al. Citation2007; Armengol et al. Citation2007). Substrates of the mTORC1 including 4E-BP1, S6K1 and PRAS40 undergo competition for binding to Raptor that impairs mTORC1 activation. It has been demonstrated that mTORC1 activity is inhibited on the binding of 4E-BP1 with the Raptor instead to mTORC1 (Wang et al. Citation2007). Two most familiar downstream effectors of the mTORC1 identified include, 4E-BP1 and S6K1 proteins (Rodrik-Outmezguine et al. Citation2011). It has been demonstrated that Raptor which is the core subunit of mTORC1 is mainly associated with binding of 4E-BP1 to mTORC1 through TOS motif on its C-terminus (Hara et al. Citation2002; Schalm et al. Citation2003). In the present study, adenoma cell growth inhibition via 4E-BP1 activation inhibition by TFGE treatment was confirmed by knockdown of both 4E-BP1 and 4E-BP2 in GH3 and HP75 cells. It was observed that 4E-BP1 as well as 4E-BP2 knockdown reversed the inhibitory effect of TFGE on growth of GH3 and HP75 cells. Therefore, TFGE treatment inhibited pituitary adenoma growth by targeting 4E-BPs phosphorylation and thereby preventing its binding to eIF4E.
Conclusion
The present study demonstrated that TFGE inhibits the growth and progression of pituitary adenoma both in vitro as well as in vivo. The mechanism unraveled showed that TFGE inhibited the binding of 4E-BP1 with the Raptor which consequently targeted mTORC1 activation. Thus, TFGE may be developed as a therapeutic agent for the treatment of pituitary adenoma; however, further studies are required to explore the mechanism in detail.
Data availability statement
Data sharing is not applicable to this article as no new data were created or analyzed in this study.
Disclosure statement
No potential conflict of interest was reported by the author(s).
References
- Alizadeh S, Jahanmehr SA, Ardjmand AR, Rezian M, Dargahi H, Einolahi N, Sadrossadat, M. 2009. Antineoplastic effect of fenugreek (Trigonella foenum graecum) seed extract against acute myeloblastic leukemia cell line (KG-1) Iran. J Blood Cancer. 1:139–146.
- Armengol G, et al. 2007. 4E-binding protein 1: A key molecular “funnel factor” in human cancer with clinical implications. Cancer Res 67:7551–7555.
- Bevan JS, Webster J, Burke CW, Scanlon MF. 1992. Dopamine agonists and pituitary tumor shrinkage. Endocr Rev 13:220–240.
- Chen R, et al. 2017. mTOR promotes pituitary tumor development through activation of PTTG1. Oncogene. 36:979–988.
- Choo AY, Yoon SO, Kim SG, Roux PP, Blenis J. 2008. Rapamycin differentially inhibits S6Ks and 4E-BP1 to mediate cell-type-specific repression of mRNA translation. Proc Natl Acad Sci USA. 105:17414–17419.
- Dowling RJ, et al. 2010. mTORC1-mediated cell proliferation, but not cell growth, controlled by the 4E-BPs. Science. 328:1172–1176.
- Dunlop EA, Hunt DK, Acosta-Jaquez HA, Fingar DC, Tee AR. 2014. ULK1 inhibits mTORC1 signaling, promotes multisite Raptor phosphorylation and hinders substrate binding. Autophagy. 7:737–747.
- Field JK, Spandidos DA. 1990. The role of ras and myc oncogenes in human solid tumours and their relevance in diagnosis and prognosis (review). Anticancer Res. 10:1–22.
- Gao Y, et al. 2014. The H19/let-7 double-negative feedback loop contributes to glucose metabolism in muscle cells. Nucleic Acids Res 42:13799–13811.
- Gillam MP, Molitch ME, Lombardi G, Colao A. 2006. Advances in the treatment of prolactinomas. Endocr Rev 27:485–534.
- Gupta P, Tripathi M, Dhandapani S, Dutta P. 2020. India’s march towards development of treatment for pituitary tumors. Neurol India. 68:1183–1187.
- Han G, Wang Y, Bi W. 2012. C–Myc overexpression promotes osteosarcoma cell invasion via activation of MEK–ERK pathway. Oncol Res. 20:149–156.
- Hara K, et al. 2002. Raptor, a binding partner of target of rapamycin (TOR), mediates TOR action. Cell. 110:177–189.
- Hausch F, Kozany C, Theodoropoulou M, Fabian AK. 2013. FKBPs and the Akt/mTOR pathway. Cell Cycle. 12:2366–2370.
- Holz MK, Ballif BA, Gygi SP, Blenis J. 2005. mTOR and S6K1 mediate assembly of the translation preinitiation complex through dynamic protein interchange and ordered phosphorylation events. Cell. 123:569–580.
- Kokontis J, Takakura K, Hay N, Liao S. 1994. Increased androgen receptor activity and altered c–myc expression in prostate cancer cells after long–term androgen deprivation. Cancer Res. 54:1566–1573.
- Kulkarni CP, Bodhankar SL, Ghule AK, Mohan V, Thakurdeai PA. 2012. Antidiabetic activity of Trigonella foenum graecum L. seeds extract in neonatal streptocotocin-induced (N-STZ) rats. Diabetol Croat. 41:29–40.
- Laplante M, Sabatini DM. 2012. mTOR signaling in growth control and disease. Cell. 149:274–293.
- Lee M, et al. 2015. Targeting PI3 K/mTOR signaling displays potent antitumor efficacy against nonfunctioning pituitary adenomas. Clin Cancer Res 21:3204–3215.
- Li N, et al. 2017. AKT-mediated stabilization of histone methyltransferase WHSC1 promotes prostate cancer metastasis.J Clin Invest. 127:1284–1302.
- Lin HP, Lin CY, Liu CC, Su LC, Huo C, Kuo YY, Tseng JC, Hsu JM, Chen CK, Chuu CP. 2013. Caffeic acid phenethyl ester as a potential treatment for advanced prostate cancer targeting akt signaling. Int J Mol Sci. 14:5264–5283.
- Liu CC, Hsu JM, Kuo LK, Chuu CP. 2013. Caffeic acid phenethyl ester as an adjuvant therapy for advanced prostate cancer. Med Hypotheses. 80:617–619.
- Liu Z, Zhang G, Li J, Liu J, Lv P. 2014. The tumor–suppressive microRNA–135b targets c–myc in osteoscarcoma. PLoS One. 9:e102621.
- Magnuson B, Ekim B, Fingar DC. 2012. Regulation and function of ribosomal protein S6 kinase (S6 K) within mTOR signalling networks. Biochem J. 441:1–21.
- Melmed S. 2011. Pathogenesis of pituitary tumors. Nat Rev Endocrinol 7:257–266.
- Moerke NJ, et al. 2007. Small-molecule inhibition of the interaction between the translation initiation factors eIF4E and eIF4G. Cell. 128:257–267.
- Mohan CD, Srinivasa V, Rangappa S, Mervin L, Mohan S, Paricharak S, Baday S, Li F, Shanmugam MK, Chinnathambi A, et al. 2016. Trisubstituted-imidazoles induce apoptosis in human breast cancer cells by targeting the oncogenic PI3 K/Akt/mTOR signaling pathway. PLoS One. 11(4):e0153155.
- Ni J, et al. 2016. Combination inhibition of PI3 K and mTORC1 yields durable remissions in mice bearing orthotopic patient-derived xenografts of HER2- positive breast cancer brain metastases. Nat Med 22:723–726.
- Ong PS, Wang LZ, Dai X, Tseng SH, Loo SJ, Sethi G. 2016. Judicious toggling of mTOR activity to combat Insulin resistance and cancer: current evidence and perspectives. Front Pharmacol. 7(25):395.
- Pandian RS, Anuradha CV, Viswanathan P. 2002. Gastroprotective effect of fenugreek seeds (Trigonella foenum graecum) on experimental gastric ulcer in rats. J Ethnopharmacol. 81:393–397.
- Popova NV, Jücker M. 2021. The role of mTOR signaling as a therapeutic target in cancer. Int J Mol Sci. 22(4):1743.
- Rodrik-Outmezguine VS, et al. 2011. mTOR kinase inhibition causes feedbackdependent biphasic regulation of AKT signaling. Cancer Discov. 1:248–259.
- Rojo F, et al. 2007. 4E-binding protein 1, a cell signaling hallmark in breast cancer that correlates with pathologic grade and prognosis. Clin Cancer Res 13:81–89.
- Saxton RA, Sabatini DM. 2017. mTOR signaling in growth, metabolism, and disease. Cell. 168:960–976.
- Schalm SS, Fingar DC, Sabatini DM, Blenis J. 2003. TOS motif-mediated Raptor binding regulates 4E-BP1 multisite phosphorylation and function. Curr Biol. 13:797–806.
- She QB, et al. 2010. 4E-BP1 is a key effector of the oncogenic activation of the AKT and ERK signaling pathways that integrates their function in tumors. Cancer Cell. 18:39–51.
- Subhashini N, Thangathirupathi A, Lavanya N. 2011. Antioxidant activity of Trigonella foenum greacum using various in vitro and ex vivo models. Int J Pharm Pharm Sci. 3:96–102.
- Taniguchi PK, Andonegui ES, Peña ME, et al. 2020. Transcriptome and methylome analysis reveals three cellular origins of pituitary tumors. Sci Rep. 10:19373.
- Wang L, Harris TE, Roth RA, Jr LJ. 2007. PRAS40 regulates mTORC1 kinase activity by functioning as a direct inhibitor of substrate binding. J Biol Chem. 282:20036–20044.
- Yan L, et al. 2015. Regulation of tumor cell migration and invasion by the H19/let-7axis is antagonized by metformin-induced DNA methylation. Oncogene. 34:3076–3084.
- Ze RW, Lichong Y, Yan TL, Lei C, Yu HG, Yong Z, Hong Y, Lin C, Han BS, Wei WR, et al. 2018. Inhibition of mTORC1 by lncRNA H19 via disrupting 4E-BP1/raptor interaction in pituitary tumours. Nat Commun. 9:4624.
- Zhang A, He S, Sun X, Ding L, Bao X, Wang N. 2014. Wnt5a promotes migration of human osteosarcoma cells by triggering a phosphatidylinositol–3 kinase/Akt signals. Cancer Cell Int. 14:15.
- Zhou J, et al. 2015. H19 lncRNA alters DNA methylation genome wide by regulating S-adenosylhomocysteine hydrolase. Nat Commun 6:10221.