
Abstract
Cirrhosis is the primary driver of hepatocellular carcinoma (HCC). Blocking the deterioration of cirrhosis into HCC would be of benefit for long–term survival. We applied a series of bioinformatic online databases to select and analyze the hub genes concerning cirrhosis and HCC, and identified UBE2T and CYP3A4 as hub genes for cirrhosis-HCC transformation. An elevated UBE2T and a decreased CYP3A4 were expressed in HCC compared with cirrhosis, which have been confirmed by real-time polymerase chain reaction (RT–PCR), Western Blotting (WB) and immunohistochemistry (IHC). The specificity (89.9%) and sensitivity (74.1%) on the combination of UBE2T and CYP3A4 for predicting HCC development in cirrhosis patients were better than that of UBE2T or CYP3A4 alone, or alpha-fetoprotein. The effectiveness of the combination of UBE2T and CYP3A4 was further verified by 15 paired HCC and paracancerous cirrhosis samples using RT–PCR, with a specificity of 100% and a sensitivity of 80%. HCC patients with elevated UBE2T and decreased CYP3A4 expression demonstrated a poorer overall survival rate (P = 0.0016, 0.019) and disease-free survival rate (P = 0.0013, 0.041). In conclusion, UBE2T and CYP3A4 could be a new combination of biomarkers for the carcinogenesis and progression of cirrhosis into HCC.
Introduction
As the fourth main cause of tumor-related deaths, liver tumors are a major threat to human health (Villanueva Citation2019). Hepatocellular carcinoma (HCC) encompasses 85–90% of all primary hepatic malignant tumors (Sartorius et al. Citation2015), the majority of which are caused by hepatitis-associated or alcohol-associated cirrhosis. It is therefore of great importance to understand the genetic processes by which cirrhosis develops into HCC.
Bioinformatics utilizes computers as tools to store, retrieve and analyze biological information; such ‘in silico’ systems are now frequently used to provide insight into the molecular mechanisms of disease. Most bioinformatic analyses of HCC have focused on comparing gene expression profiles between HCC biopsies and adjacent normal tissue samples (Li et al. Citation2017; Wang et al. Citation2017; Zhang et al. Citation2019), rather than comparisons between HCC and cirrhosis specimens, with few recent studies to further validate (Li et al. Citation2016; Xie et al. Citation2016; He et al. Citation2017; Chen et al. Citation2018; Fan and Ye Citation2018; Wu et al. Citation2019; Jiang et al. Citation2020).
For this study, we attempted to identify the gene expression discrepancies between HCC samples and cirrhosis samples; single out differentially expressed genes (DEGs); discover the hub genes; and build protein to protein interaction (PPI) networks of hub genes combined with their correlated genes by analyzing various bioinformatic online datasets to reveal the possible mechanism of cirrhosis developing into HCC, and further verify it by real-time polymerase chain reaction (RT–PCR), Western Blotting (WB) and immunohistochemistry (IHC).
Materials and methods
GEO datasets and GSE series
Gene Expression Omnibus (GEO) (http://www.ncbi.nlm.nih.gov/geo) is an open format genomic database that contains array- and sequence-based data submissions (Edgar et al. Citation2002). GEO (https://www.ncbi.nlm.nih.gov/gds) contains multiple curated gene expression sets, as well as platform records and original series, in the GEO repository. We searched these datasets using the keywords ‘cirrhosis’ and ‘hepatocellular carcinoma’ and selected the study type as ‘Expression profiling by array’ and setting the organisms to ‘Homo sapiens’. This strategy identified eleven valid GSE Series: GSE63898 (Villanueva et al. Citation2015), GSE128726, GSE98383/107170 (Giacomo et al. Citation2018), GSE45050 (Darpolor et al. Citation2014), GSE89377, GSE17548 (Yildiz et al. Citation2013), GSE102451 (Torrecilla et al. Citation2017), GSE14323 (Mas et al. Citation2009), GSE3632, GSE10459 (Sakai et al. Citation2008) and GSE17967 (Archer et al. Citation2009) after eliminating duplicated data. The gene symbols were converted by the probes, as per the platform annotation information.
DEG screening
By using GEO2R (http://www.ncbi.nlm.nih.gov/geo/geo2r), the DEGs between cirrhosis and HCC were identified. These DEGs were chosen based on their p-values being significant after adjusting for multiple testing (adj. P-value) ∣logFC (fold change)∣ > 1 and adj. P-value < 0.05, and their having a log2-fold difference in expression between the two clinical conditions. DEGs with less than 10 samples in each group were excluded. Using GEO2R we selected the GSE groups which ranked in the top five in terms of unique element numbers as the final research objects.
DEGs’ GO and KEGG enrichment pathway research
We used the Database for Annotation, Visualization and Integrated Discovery (DAVID) bioinformatics resources version 6.8 (http://david.ncifcrf.gov) to analyze the DEGs’ biological features and functions (Huang et al. Citation2009a, Citation2009b). We used Gene Ontology (GO) for annotating genes and analyzing biological process (BP), cell component (CC), molecular function (MF) of these genes (Ashburner et al. Citation2000). We used the Kyoto Encyclopedia of Genes and Genomes (KEGG) database (http://www.genome.jp/kegg/) for pathway analyses (Kanehisa et al. Citation2016). A P-value < 0.05 was considered statistically significant.
DEGs’ PPI network diagram and modularization research
We used the Search Tool for the Retrieval of Interacting Genes (STRING) (http://string-db.org) (Szklarczyk et al. Citation2019) version 11.0, to predict the DEGs’ PPI network. The biological interactions among proteins were analyzed to predict disease pathogenesis. A communication with a combined score > 0.4 was considered statistically significant. Subsequently, the PPI network diagrams were visualized via Cytoscape (version 3.6.0) (Shannon et al. Citation2003) and the key aspects were analyzed with MCODE (Molecular Complex Detection) (version 1.5.1) (Bader and Hogue Citation2003). We found clusters throughout the network based on the following filter criteria in MCODE: the cut-off of degree = 2, the cut-off of node score = 0.2, max depth = 100 and k-core = 2.
Hub genes’ screening and analysis
Through cBioPortal (http://www.cbioportal.org) (Cerami et al. Citation2012; Gao et al. Citation2013), we set the seed genes identified from MCODE as hub genes, and analyzed their expressions in HCC. We used Biological Networks Gene Oncology (BiNGO) (version 3.0.3) (Maere et al. Citation2005) to examine the hub genes’ BP, CC and MF annotations. We used the cancer genomics browser from UCSC (University of California, Santa Cruz) (http://genome-cancer.ucsc.edu) (Goldman et al. Citation2018), for multi-omic and clinical/phenotype data to build a hub genes-ordered cluster.
The expressions of hub genes related to hepatitis C virus (HCV) infection status, cancer type, HCC grade, vascular invasion and satellites, were examined with Oncomine (http://www.oncomine.com). Heat maps associated with the hub genes’ expressions in normal tissues versus those in HCC were also analyzed using Oncomine. Subsequently, the disease-free survival (DFS) and overall survival (OS) estimates of hub gene contributions were carried out through GEPIA (Gene Expression Profiling Interactive Analysis) (http://gepia.cancer-pku.cn/detail.php) (Tang et al. Citation2017).
Histological samples
The samples of HCC, paracancerous cirrhosis and distant cirrhosis tissues from 15 patients, and 15 normal liver tissues from liver transplant donors were retrieved from the biobank of Changzheng Hospital, Navy Medical University. All clinical samples used have obtained the informed consent of patients and donors. This study was approved by the Ethics Committee of Navy Medical University, and in line with the guidelines outlined in the Declaration of Helsinki.
Real-time polymerase chain reaction (RT–PCR) analysis
RT–PCR analysis was further used to perform validation of hub genes. Total cellular RNA was extracted from fresh tissue using TRIzol reagent (Invitrogen, 15596018). A spectrophotometer (NanoDrop 2000) was used to measure the quality and quantity of the RNA. For cDNA synthesis, 1 µg of total RNA was used as a template in a 20 µl reaction system using a reverse transcription kit (Takara, RR047A), and the cDNA was subjected to quantitative RT–PCR carried out with the TB Green qPCR kit (Takara, RR420A) via Real-Time System (Roche, LightCycler® 480II). Primer sequences were as follows (Table ).
Table 1. The primer used in the real-time polymerase chain reaction (RT–PCR) analysis.
Western blotting (WB) analysis
WB combined with RT–PCR will assist in validating hub genes more effectively. The total protein from each fresh sample was extracted with RIPA lysis buffer (Siwuwu Bio, SD0006) and centrifuged at 12,000 rpm for 10 min to remove debris, and protein concentration was measured using a BCA protein assay kit (Siwuwu Bio, SD0012). Equal amounts of each protein extract were electrophoretically separated on 10% SDS polyacrylamide gels. Following transfer to polyvinylidene fluoride (PVDF) membranes (Siwuwu Bio, SD0043), membranes were incubated with 5% skimmed milk powder in Tris-buffered saline containing 0.1% Tween-20 (TBST) for 1 h at room temperature to block non-specific binding, then incubated with the primary antibody against the hub genes (dilution 1:1000, abcam154022; abcam124921) overnight at 4°C. Anti-rabbit (dilution 1:20000, SD0039) secondary antibody was used. Finally, protein expression was determined using an enhanced chemiluminescence detection system (ECL Hypersensitive Chemiluminescence Kit, SD0032) in strict accordance with the manufacturer's protocols. Anti-β-Actin antibody (dilution, SD0034) served as a loading control. Image quantitation of band intensity was performed using the Image J software.
Immunohistochemistry (IHC) analysis
We selected oncogenes in hub genes for IHC to further verify the difference in the expression of these genes between liver cirrhosis and HCC.
Hub genes’ sensitivity and specificity analysis
We extracted the expression of UBE2T and CYP3A4 from patients with liver cirrhosis and liver cancer in GSE datasets, and calculated the cut-off value, sensitivity and specificity of UBE2T and CYP3A4 by the receiver operating characteristics (ROC) curve, and compared with that of AFP. According to the cut-off value, UBE2T and CYP3A4 were divided into UBE2T positive group and UBE2T negative group, CYP3A4 positive group and CYP3A4 negative group. In order to improve the sensitivity, the combined diagnosis of UBE2T and CYP3A4 was defined as satisfying either UBE2T positive or CYP3A4 positive. Then, we used the RT–PCR data of 15 pairs of samples to further verify the sensitivity and specificity of UBE2T, CYP3A4 and the combination of UBE2T and CYP3A4.
Statistical analysis
The box diagrams for comparison between groups were drawn by GraphPad Prism 7 (GraphPad Software Inc., La Jolla, CA, USA). SPSS 24.0 software (IBM, Armonk, NY, USA) was applied for statistical analyses. The Kruskal–Wallis one-way ANOVA and paired t test were used for comparison between groups. The ROC curve was used to analyze the sensitivity and specificity of hub gene. A P-value < 0.05 indicated a statistically significant difference.
Results
DEGs’ identification in HCC
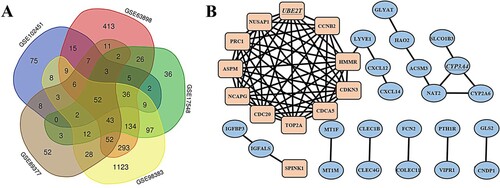
After screening, five datasets were identified for further analyses: GSE98383, GSE63898, GSE17548, GSE89377 and GSE102451. The GSE98383 dataset contained 11 HCC tissue samples, 29 cirrhosis tissues samples and 1907 DEGs. The GSE63898 contained 228 HCC samples, 168 cirrhosis samples and 1107 DEGs. The GSE17548 contained 17 HCC samples, 20 cirrhosis samples and 462 DEGs. The GSE89377 contained 35 HCC samples, 12 cirrhosis samples and 284 DEGs. GSE102451 contained 27 HCC samples, 30 cirrhosis samples and 240 DEGs. The overlap among these five datasets identified 52 genes that are presented as a Venn diagram (Figure (A)) in which it can be seen that there are 13 up-regulated and 39 down-regulated genes, between cirrhosis and HCC tissues.
Figure 1. Venn diagram, PPI network and the significant modules of the differentially expressed genes (DEGs). (A) DEGs were selected with ∣logFC (fold change)∣ > 1 and adj. P-value < 0.05 among the mRNA expression profiling sets GSE98383, GSE63898, GSE17548, GSE89377 and GSE102451. The 5 datasets showed an overlap of 52 genes. (B) The PPI network of DEGs was constructed using Cytoscape. Up-regulated and down-regulated genes were marked in rectangle and oval, respectively. The hub genes UBE2T and CYP3A4 were marked with underline.
DEGs’ GO and KEGG enrichment pathway research
To analyze the DEGs’ biological classifications, GO and KEGG enrichment pathways research was performed using DAVID. The GO enrichment showed that the DEGs’ BP were associated with mitotic chromosome condensation, cell surface receptor signaling pathways, xenobiotic metabolic processes, exogenous drug catabolic processes, mitotic nuclear division and hyaluronan catabolic process. The DEGs’ CC were associated with the insulin-like growth factor ternary complex, the extracellular region, collagen trimers extracellular exosomes and spindle. The DEGs’ MF were associated with enzyme binding and oxidoreductase activity. KEGG enrichment pathway analyses identified the DEGs as being largely involved in chemical carcinogenesis, drug metabolism via cytochrome P450 (CYP450) and other enzymes, caffeine metabolism, retinol metabolism, and metabolism of xenobiotics by CYP450 (Table ).
Table 2. GO and KEGG pathway enrichment analysis of DEGs in HCC samples.
DEGs’ PPI network diagram and modularization research
By using Cytoscape, the DEGs’ PPI network diagram was constructed. Two significant modules in the PPI networks were identified using MCODE. UBE2T had the highest MCODE score in one significant module with 11 nodes and 55 edges, while CYP3A4 had the highest MCODE score in the other significant module with 3 nodes and 3 edges (Figure (B)).
Hub genes’ screening and analysis
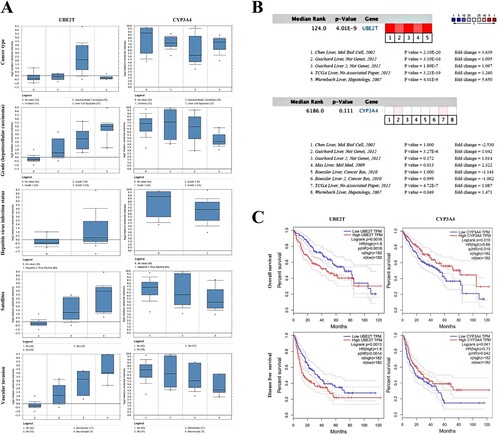
UBE2T and CYP3A4 were recognized as hub genes. The full name, alternative name, location, chromosome and function of hub genes are shown in Figure . By applying the cBioPortal platform, a system of the hub genes combined with their correlated genes was examined (Figure (A)). The hub genes’ GOBP and GOMF analyses are presented in Figure (B). Ordered cluster analysis showed that the expression of the hub genes distinguished between HCC samples and cirrhosis samples (Figure (C)). In the Wurmbach Liver dataset, an elevated expression of UBE2T and a decreased expression of CYP3A4 were observed in HCC compared to cirrhosis. These same expression patterns were also found to be related to HCV infection status, tumor grade, vascular invasion and satellites compared to controls (Figure (A)). Oncomine analysis of normal tissue versus cancer showed that UBE2T was significantly over-expressed in diverse datasets in HCC (Chen et al. Citation2002; Wurmbach et al. Citation2007; Guichard et al. Citation2012), but the relative expression levels of the CYP3A4 gene varied among the datasets (Figure (B)) (Chen et al. Citation2002; Wurmbach et al. Citation2007; Mas et al. Citation2009; Roessler et al. Citation2010; Guichard et al. Citation2012). Finally, the OS and DFS attributable to the hub genes were calculated through GEPIA. HCC patients with elevated expression of UBE2T had worse OS (P = 0.0016) and DFS (P = 0.0013), and HCC patients with decreased CYP3A4 expression also had worse OS (P = 0.019) and DFS (P = 0.041) (Figure (C)).
Figure 2. Functional characteristics of hub genes in homo sapiens.
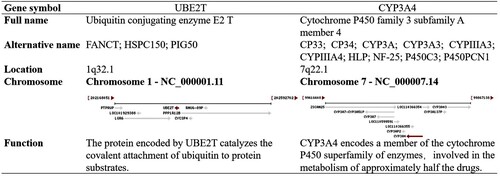
Figure 3. Interaction network, biological process and molecular function analysis of the hub genes. (A) Hub genes and their co-expression genes were analyzed using cBioPortal. Nodes with bold and thin outline respectively represent hub genes and the co-expression genes. (B) The biological process and molecular function analysis of hub genes were constructed using BiNGO. The filled nodes refers to the corrected P-value of ontologies. The size of nodes refers to the numbers of genes that are involved in the ontologies. A P-value < 0.05 was considered statistically significant. (C) Hierarchical clustering of hub genes was constructed using UCSC. Solid tissue normal samples, recurrent hepatocellular carcinoma (HCC) samples and primary HCC samples were involved. Upregulation of genes is marked in dark; downregulation of genes is marked in light.
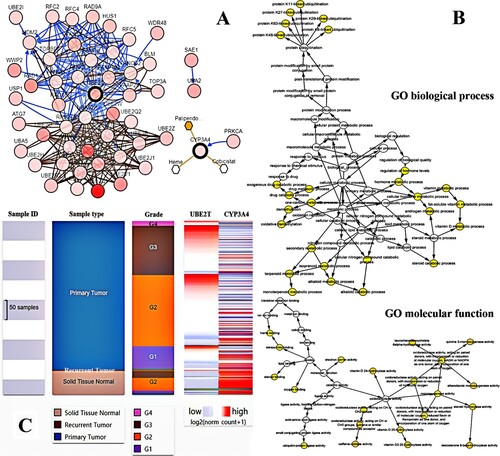
Figure 4. The gene expression, overall survival and disease/progress-free survival analysis of UBE2T and CYP3A4 in hepatocellular carcinoma (HCC). (A) The expression of UBE2T and CYP3A4 associated with cancer type, HCC grade, hepatitis virus infection status, satellites and vascular invasion in the Wurmbach Liver dataset. (B) Heat maps of UBE2T and CYP3A4 gene expression in HCC vs. normal tissues were analyzed using Oncomine. (C) Overall survival and disease-free survival analysis of UBE2T and CYP3A4 were performed using GEPIA. A P-value < 0.05 was considered statistically significant.
Expression of UBE2T and CYP3A4 in human liver tissue
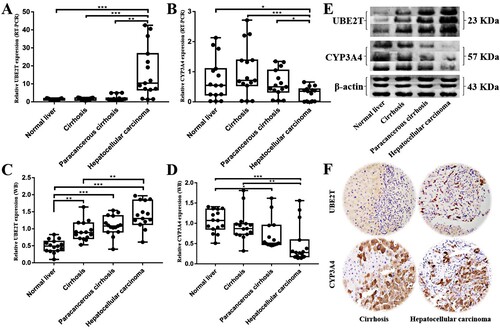
In order to further confirm the research results mentioned above, RT–PCR, WB and IHC analysis were used to examine levels of UBE2T and CYP3A4 expression in human tissues. We obtained 15 paired HCC tissue samples and their corresponding paracancerous cirrhosis tissues, cirrhosis tissues, and normal liver tissues to confirm UBE2T and CYP3A4 expression by RT–PCR and WB analysis. The results in RT–PCR analysis showed that levels of UBE2T mRNA expression in HCC tissues were significantly higher than that in paracancerous cirrhosis tissues and cirrhosis tissues (P = 0.001, <0.001) (Figure (A)), and CYP3A4 were significantly lower in HCC tissues (P = 0.020, < 0.001) (Figure (B)). However, there was no significant difference between cirrhosis tissues and paracancerous cirrhosis tissues in the expression of UBE2T and CYP3A4 (P > 0.05). The WB analysis results indicated that protein expression levels of UBE2T and CYP3A4 are increased and decreased during the carcinogenesis and progression of cirrhosis into HCC respectively (Figure (C)). The IHC results showed that the expression of UBE2T in HCC tissues was higher than that in cirrhotic tissues, while the result of CYP3A4 was just the opposite (Figure (D)).
Figure 5. The expression of UBE2T and CYP3A4 in samples of normal liver (n = 15), cirrhosis (n = 15), paracancerous cirrhosis (n = 15) and HCC (n = 15). (A–B) The different expressions of UBE2T and CYP3A4 were verified by RT–PCR. (C–D) The different expressions of UBE2T and CYP3A4 were verified by WB. (E) Representative grayscales of UBE2T and CYP3A4 expressions (n = 3 in each group). (F) The results of immunohistochemistry showed that the expression of UBE2T was higher in HCC tissues than that in cirrhotic tissues, and the expression of CYP3A4 was lower in HCC tissues than that in cirrhotic tissues. Notes: * P < 0.05, ** P < 0.01, *** P < 0.001.
The sensitivity and specificity of hub genes
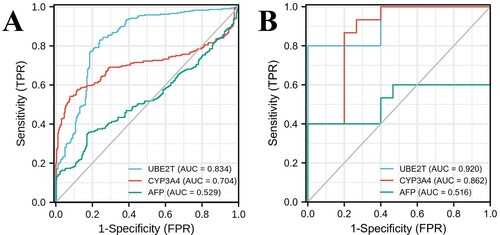
ROC curves were used to analyze the sensitivity and specificity of hub genes. The sample data were collected from 259 patients with liver cirrhosis and 288 patients with liver cancer in the GSE98383, GSE63898, GSE17548, GSE89377 and GSE102451 datasets, and the expressions of UBE2T and CYP3A4 were determined by whole genome shotgun sequencing. The area under curve (AUC) of UBE2T was 0.834 (95%CI: 0.799∼0.869), with a specificity of 83.0% and a sensitivity of 76.1% at the cut-off value of 4.975. The AUC of CYP3A4 was 0.704 (95%CI: 0.657∼0.750), with a sensitivity of 54.2% and a specificity of 92.3% at the cut-off value of 11.204. The AUC of AFP was 0.529 (95%CI: 0.480∼0.577), with a sensitivity of 35.8% and a specificity of 82.2% at its cut-off value (Figure (A)). Then according to the cut-off values, we divided them into UBE2T positive group (UBE2T ≥ 4.975), UBE2T negative group (UBE2T < 4.975), CYP3A4 positive group (CYP3A4 < 11.204) and CYP3A4 negative group (CYP3A4 ≥ 11.204). The sensitivity and specificity on the combination of UBE2T and CYP3A4 was 89.9% and 74.1%, respectively. In order to further verify the prediction values of hub genes, 15 paired HCC tissues and cirrhosis tissues were used as validation cohort. The expressions of UBE2T and CYP3A4 in validation cohort were determined by RT–PCR. The AUC of UBE2T in validation cohort was 0.920 (95%CI: 0.822∼1.000) with a specificity of 100% and a sensitivity of 80% at the cut-off value of 4.580. The AUC of CYP3A4 was 0.862 (95%CI: 0.725∼0.999), with a sensitivity of 86.7% and a specificity of 80% at the cut-off value of 0.533. The AUC of AFP was 0.516 (95%CI: 0.282∼0.749), with a sensitivity of 40% and a specificity of 100% at its cut-off value (Figure (B)). The sensitivity and specificity on the combination of UBE2T and CYP3A4 were 100.0% and 80.0%, respectively.
Figure 6. ROC curves of UBE2T, CYP3A4 and AFP for predicting the development trend of hepatocellular carcinoma in patients with cirrhosis. (A) Through the datasets collected from GSE98383, GSE63898, GSE17548, GSE89377 and GSE102451, 259 samples with liver cirrhosis and 288 samples with liver cancer were involved. The areas under ROC curve of UBE2T, CYP3A4 and AFP were 0.834, 0.704, and 0.529, respectively. (B) For the validation cohort of 15 paired HCC tissues and cirrhosis tissues, the areas under ROC curve of UBE2T, CYP3A4 and AFP were 0.920, 0.862, and 0.516, respectively.
Discussion
Cirrhosis, can lead to a series of fatal complications, which include HCC, infection, upper gastrointestinal hemorrhage, hepatic encephalopathy (HE), hepatorenal syndrome (HRS), hepatopulmonary syndrome (HPS), electrolyte disorder and portal vein thrombosis (PVT) (Schuppan and Afdhal Citation2008). Cirrhosis and HCC place huge physical, psychological and financial burdens on patients and their families (Bajaj et al. Citation2011; Tapper et al. Citation2015; Patel et al. Citation2017). In the United States, the annual cirrhosis death rate increased by 65% to 34,174 between 1999 and 2016 and is expected to triple again by 2030. Moreover, the annual HCC death rate doubled to 11,073 between 1999 and 2016 and is expected to double again by 2030 (Estes et al. Citation2018; Tapper and Parikh Citation2018). Thus, the pathogenesis of cirrhosis progressing to HCC is of great interest.
The comprehensive genomic, proteomic and phosphoproteomic analyses of HCC using bioinformatic tools and online datasets have given us a deeper comprehension concerning the molecular mechanisms driving HCC (Cancer Genome Atlas Research Network Citation2017; Gao et al. Citation2019). If it was possible to identify and modify the expression of the hub genes which cause the deterioration of cirrhosis into HCC, the prevalence of HCC could be significantly reduced. In this study, we identified five GSE series using preset conditions, and found 52 DEGs using a Venn graphing program that included 13 up-regulated genes and 39 down-regulated genes. We then applied a module analysis and PPI network construction in order to obtain the hub genes UBE2T and CYP3A4.
UBE2T receives ubiquitin from an E1 complex and catalyzes its covalent binding to other proteins; it also functions as an explicit E2 ubiquitin binding enzyme by connecting with the E3 ubiquitin-protein ligase FA Complementation Group L (FANCL) of Fanconi anemia complex and catalyzing the monoubiquitination of FA Complementation Group D2 (FANCD2), which plays a pivotal role in the DNA damage pathway (Machida et al. Citation2006; Alpi et al. Citation2007, Citation2009; Longerich et al. Citation2009; Morreale et al. Citation2017). Additionally, UBE2T is involved in mitomycin-C (MMC)-induced DNA repair, catalyzing monoubiquitination, mediating monoubiquitination of FA Complementation Group I (FANCI) and FANCL (Machida et al. Citation2006; Alpi et al. Citation2007, Citation2009; Longerich et al. Citation2009), possibly contributing to BRCA1 degradation and ubiquitination (Ueki et al. Citation2009), and the promotion of polyubiquitination in vitro, particularly ‘Lys-63’, ‘Lys-48’, ‘Lys-27’ and ‘Lys-11’, and -linked polyubiquitination (David et al. Citation2010).
As an up-regulated gene in the pathophysiological process of HCC, UBE2T promotes the deprivation of the P53 protein by improving its ubiquitination and activating the carcinogenic process. A higher UBE2T expression level is related to a poor prognosis, tumor vascular invasion, late TNM stages, and higher pathological grades in HCC patients, which is consistent with the results from other studies. A multivariate analysis showed that UBE2T is an independent risk factor for OS in HCC patients (Liu et al. Citation2017). It has also been shown that over-expressed UBE2T accelerates tumorigenesis, migration, proliferation, colony formation, and HCC invasion, while the knockout of UBE2T suppresses HCC growth with a G2/M phase arrest in the cell cycle (Liu et al. Citation2019). In one study, the ectopic expression of UBE2T led to decreased expressions of P53, P21 and NOXA. The newly discovered miR-543/UBE2T/P53 axis could be a likely new target for the treatment of HCC (Liu et al. Citation2017). Furthermore, through the activation of the AKT/glycogen synthase kinase-3β (GSK3β)/β-catenin signaling pathway and cell proliferation, UBE2T promotes invasion, and metastasis (Hu et al. Citation2016). MicroRNA-1305 could act as an effective target for UBE2T to inhibit the AKT/GSK3β/β-catenin signaling pathway, thereby inhibiting the propagation and tumorogenicity of liver cancer stem cells (LCSCs) (Wei et al. Citation2019).
As a member of the CYP450 family, CYP3A4 is located in the endoplasmic reticulum and participates in drug metabolism and lipid synthesis. Its expression can be enhanced by steroid hormones and certain medicines (El-Merhibi et al. Citation2012). This enzyme helps in the metabolism of > 60% of clinical drugs, including erythromycin, diazepam, cyclosporin A, codeine, and acetaminophen (Fujimura et al. Citation2012; Zanger and Schwab Citation2013). It also acts on some carcinogens and steroids. It was previously believed to be down-regulated after birth, and has been found to be highly expressed in the fetal liver (Fanni et al. Citation2015). The CYP3A3 gene, which was previously believed to be an independent gene, has been shown to be a transcriptional variant of CYP3A4. CYP3A4 expression is reduced in hepatocellular adenomas (HCA) and HCC, and has been correlated with type 2 diabetes mellitus (T2DM) (Haas et al. Citation2009). CYP3A4 expression is stimulated by the hepatitis B virus X protein (HBX) through co-activating a pregnane X receptor (PXR), which affects hepatic carcinogen aflatoxin B1 (AFB1) bioactivation (Ayed-Boussema et al. Citation2012). The expression of CYP3A4 and PXR was high in stage I of HCC, but reduced in stages II and III (Niu et al. Citation2013). This indicates that down-regulated expressions of PXR and CYP3A4 are potential biomarkers for HBV-related HCC, particularly in advanced HCC. This is consistent with the image which can be seen in Figure (A).
Sorafenib, as a first-line drug for HCC; it is metabolized by CYP450, in particular by CYP3A4 isoforms, creating two main metabolites: N-hydroxymethyl metabolite and N-oxide. The overexpression of CYP3A4 could lead to enhanced drug degradation and thus resulting in clinical ineffectiveness. Therefore, CYP3A4-up-regualted HCC samples could indicate low responses to sorafenib (Fanni et al. Citation2016; Guo et al. Citation2018). It was discovered that rutin significantly reduced the protein and mRNA expression of the CYP3A4 gene in HepG2 cells by 75.3% and 73.2%, respectively. Such reduced levels of CY3A4 following rutin treatment could improve the action of sorafenib (Karakurt Citation2016). C-1311 is an operative regulator of CYP3A4 enzymatic activity, and is an inhibitor in Hep3A4 cells of its isoenzyme. C-1311 inhibits the overexpression of CYP3A4 in HepG2 cells, and HepG2 cells stalled in the G2 phase of the cell cycle (Augustin et al. Citation2013).
At present, there are few bioinformatics articles concerning hub genes for the transformation of cirrhosis into HCC (Li et al. Citation2016; Xie et al. Citation2016; He et al. Citation2017; Chen et al. Citation2018; Fan and Ye Citation2018; Wu et al. Citation2019; Jiang et al. Citation2020). Most of them are limited to the screening process and have not been further verified and analyzed. This is the first article that hub genes transformed from cirrhosis to HCC has been verified by RT–PCR, WB and IHC after bioinformatics analysis, which is a major advantage of this paper. In addition, combined diagnosis of UBE2T and CYP3A4 is superior to AFP in predicting the development of HCC in patients with cirrhosis, especially in patients with AFP-negative HCC, which is another advantage of this study.
This study had certain limitations. The origins of cirrhosis were not classified by this study with a finite number of online datasets. In addition, most databases were only used for the comparison of HCC with normal liver tissue, but there was a lack of comparison between HCC and cirrhosis. Although the difference between the expression of UBE2T and CYP3A4 in HCC group and cirrhosis group has been confirmed by bioinformatics analysis and a variety of molecular and histiocytic studies, it remains to be further verified by animal models. Furthermore, we will research their upstream and downstream genes and related signaling pathways to find a way to block the development of cirrhosis into HCC by inhibiting targets.
In conclusion, UBE2T and CYP3A4 were screened as tumor-promoting and tumor-suppressing hub genes, for cirrhosis-HCC transformation by a series of bioinformatics analysis and were verified by RT–PCR, WB and IHC. These genes may be applied as combined biological markers to diagnose and predict the HCC tendency in cirrhosis patients, which is beneficial to the early detection, diagnosis and treatment of HCC.
Supplemental Material
Download Zip (157.2 KB)Disclosure statement
No potential conflict of interest was reported by the author(s).
Data availability statement
Due to the nature of this research, participants of this study did not agree for their data to be shared publicly, so supporting data is not available.
Additional information
Funding
Related Research Data
References
- Alpi A, Langevin F, Mosedale G, Machida YJ, Dutta A, Patel KJ. 2007. UBE2T, the Fanconi anemia core complex, and FANCD2 are recruited independently to chromatin: a basis for the regulation of FANCD2 monoubiquitination. Mol Cell Biol. 27(24):8421–8430.
- Alpi AF, Pace PE, Babu MM, Patel KJ. 2009. Mechanistic insight into site-restricted monoubiquitination of FANCD2 by UBE2T, FANCL, and FANCI. Mol Cell. 32(6):767–777.
- Archer KJ, Mas VR, David K, Maluf DG, Bornstein K, Fisher RA. 2009. Identifying genes for establishing a multigenic test for hepatocellular carcinoma surveillance in hepatitis C virus-positive cirrhotic patients. Cancer Epidemiol Biomarkers Prev. 18(11):2929–2932.
- Ashburner M, Ball CA, Blake JA, Botstein D, Butler H, Cherry JM, Davis AP, Dolinski K, Dwight SS, Eppig JT, et al. 2000. Gene ontology: tool for the unification of biology. Nat Genet. 25(1):25–29.
- Augustin E, Pawłowska M, Polewska J, Potega A, Mazerska Z. 2013. Modulation of CYP3A4 activity and induction of apoptosis, necrosis and senescence by the anti-tumour imidazoacridinone C-1311 in human hepatoma cells. Cell Biol Int. 37(2):109–120.
- Ayed-Boussema I, Pascussi JM, Maurel P, Bacha H, Hassen W. 2012. Effect of aflatoxin B1 on nuclear receptors PXR, CAR, and AhR and their target cytochromes P450 mRNA expression in primary cultures of human hepatocytes. Int J Toxicol. 31(1):86–93.
- Bader GD, Hogue CW. 2003. An automated method for finding molecular complexes in large protein interaction networks. BMC Bioinformatics. 4:2.
- Bajaj JS, Wade JB, Gibson DP, Heuman DM, Thacker LR, Sterling RK, Stravitz RT, Luketic V, Fuchs M, White MB, et al. 2011. The multi-dimensional burden of cirrhosis and hepatic encephalopathy on patients and caregivers. Am J Gastroenterol. 106(9):1646–1653.
- Cancer Genome Atlas Research Network. 2017. Comprehensive and integrative genomic characterization of hepatocellular carcinoma. Cell. 169(7):1327–1341.
- Cerami E, Gao J, Dogrusoz U, Gross BE, Sumer SO, Aksoy BA, Jacobsen A, Byrne CJ, Heuer ML, Larsson E, et al. 2012. The cBio cancer genomics portal: an open platform for exploring multidimensional cancer genomics data. Cancer Discov. 2:401–404.
- Chen X, Cheung ST, So S, Fan ST, Barry C, Higgins J, Lai KM, Ji J, Dudoit S, Ng IO, et al. 2002. Gene expression patterns in human liver cancers. Mol Biol Cell. 13(6):1929–1939.
- Chen QF, Xia JG, Li W, Shen LJ, Huang T, Wu P. 2018. Examining the key genes and pathways in hepatocellular carcinoma development from hepatitis B virus-positive cirrhosis. Mol Med Rep. 18(6):4940–4950.
- Darpolor MM, Basu SS, Worth A, Nelson DS, Clarke-Katzenberg RH, Glickson JD, Kaplan DE, Blair IA. 2014. The aspartate metabolism pathway is differentiable in human hepatocellular carcinoma: transcriptomics and 13C-isotope based metabolomics. NMR Biomed. 27(4):381–389.
- David Y, Ziv T, Admon A, Navon A. 2010. The E2 ubiquitin-conjugating enzymes direct polyubiquitination to preferred lysines. J Biol Chem. 285(12):8595–8604.
- Edgar R, Domrachev M, Lash AE. 2002. Gene Expression Omnibus: NCBI gene expression and hybridization array data repository. Nucleic Acids Res. 30(1):207–210.
- El-Merhibi A, Ngo SN, Marchant CL, Height TA, Stupans I, McKinnon RA. 2012. Cytochrome P450 CYP3A in marsupials: cloning and identification of the first CYP3A subfamily member, isoform 3A70 from Eastern gray kangaroo (Macropus giganteus). Gene. 506(2):423–428.
- Estes C, Razavi H, Loomba R, Younossi Z, Sanyal AJ. 2018. Modeling the epidemic of nonalcoholic fatty liver disease demonstrates an exponential increase in burden of disease. Hepatology. 67(1):123–133.
- Fanni D, Fanos V, Ambu R, Lai F, Gerosa C, Pampaloni P, Van Eyken P, Senes G, Castagnola M, Faa G. 2015. Overlapping between CYP3A4 and CYP3A7 expression in the fetal human liver during development. J Matern Fetal Neonatal Med. 28(11):1291–1295.
- Fan W, Ye G. 2018. Microarray analysis for the identification of specific proteins and functional modules involved in the process of hepatocellular carcinoma originating from cirrhotic liver. Mol Med Rep. 17(4):5619–5626.
- Fanni D, Manchia M, Lai F, Gerosa C, Ambu R, Faa G. 2016. Immunohistochemical markers of CYP3A4 and CYP3A7: a new tool towards personalized pharmacotherapy of hepatocellular carcinoma. Eur J Histochem. 60(2):81–85.
- Fujimura T, Takahashi S, Urano T, Tanaka T, Zhang W, Azuma K, Takayama K, Obinata D, Murata T, Horie-Inoue K, et al. 2012. Clinical significance of steroid and xenobiotic receptor and its targeted gene CYP3A4 in human prostate cancer. Cancer Sci. 103(2):176–180.
- Gao J, Aksoy BA, Dogrusoz U, Dresdner G, Gross B, Sumer SO, Sun Y, Jacobsen A, Sinha R, Larsson E, et al. 2013. Integrative analysis of complex cancer genomics and clinical profiles using the cBioPortal. Sci Signal. 6(269):pl1.
- Gao Q, Zhu H, Dong L, Shi W, Chen R, Song Z, Huang C, Li J, Dong X, Zhou Y, et al. 2019. Integrated proteogenomic characterization of HBV-related hepatocellular carcinoma. Cell. 179(5):561–577.
- Giacomo D, Engle RE, Ashley T, Melis M, Montenegro S, Rodriguez-Canales J, Hanson J, Emmert-Buck MR, Bock KW, Moore IN, et al. 2018. Molecular signature and mechanisms of hepatitis D virus–associated hepatocellular carcinoma. Mol Cancer Res. 16(9):1406–1419.
- Goldman M, Craft B, Brooks A, Mcdade F, Kamath A, Banerjee A, Luo Y, Rogers D, Brooks AN, Zhu J. 2018. The UCSC Xena platform for public and private cancer genomics data visualization and interpretation. bioRxiv.
- Guichard C, Amaddeo G, Imbeaud S, Ladeiro Y, Pelletier L, Maad IB, Calderaro J, Bioulac-Sage P, Letexier M, Degos F, et al. 2012. Integrated analysis of somatic mutations and focal copy-number changes identifies key genes and pathways in hepatocellular carcinoma. Nat Genet. 44(6):694–698.
- Guo XG, Wang ZH, Dong W, He XD, Liu FC, Liu H. 2018. Specific CYP450 genotypes in the Chinese population affect sorafenib toxicity in HBV/HCV-associated hepatocellular carcinoma patients. Biomed Environ Sci. 31(8):586–595.
- Haas S, Merkelbach-Bruse S, Justenhoven C, Brauch H, Fischer HP. 2009. Expression of xenobiotic and steroid hormone metabolizing enzymes in hepatocellular tumors of the non-cirrhotic liver. Pathol Res Pract. 205(10):716–725.
- He B, Yin J, Gong S, Gu J, Xiao J, Shi W, Ding W, He Y. 2017. Bioinformatics analysis of key genes and pathways for hepatocellular carcinoma transformed from cirrhosis. Medicine (Baltimore). 96(25):e6938.
- Hu W, Xiao L, Cao C, Hua S, Wu D. 2016. UBE2T promotes nasopharyngeal carcinoma cell proliferation, invasion, and metastasis by activating the AKT/GSK3β/β-catenin pathway. Oncotarget. 7(12):15161–15172.
- Huang DW, Sherman BT, Lempicki RA. 2009a. Bioinformatics enrichment tools: paths toward the comprehensive functional analysis of large gene lists. Nucleic Acids Res. 37(1):1–13.
- Huang DW, Sherman BT, Lempicki RA. 2009b. Systematic and integrative analysis of large gene lists using DAVID bioinformatics resources. Nat Protoc. 4(1):44–57.
- Jiang CH, Yuan X, Li JF, Xie YF, Zhang AZ, Wang XL, Yang L, Liu CX, Liang WH, Pang LJ, et al. 2020. Bioinformatics–based screening of key genes for transformation of liver cirrhosis to hepatocellular carcinoma. J Transl Med. 18(1):40.
- Kanehisa M, Sato Y, Kawashima M, Furumichi M, Tanabe M. 2016. KEGG as a reference resource for gene and protein annotation. Nucleic Acids Res. 44:457–462.
- Karakurt S. 2016. Modulatory effects of rutin on the expression of cytochrome P450s and antioxidant enzymes in human hepatoma cells. Acta Pharm. 66(4):491–502.
- Li L, Lei Q, Zhang S, Kong L, Qin B. 2017. Screening and identification of key biomarkers in hepatocellular carcinoma: evidence from bioinformatic analysis. Oncol Rep. 38(5):2607–2618.
- Li YL, Zheng MX, Wang G. 2016. A personalized approach identifies disturbed pathways and key genes in hepatitis C virus–cirrhosis with hepatocellular carcinoma. Eur Rev Med Pharmacol Sci. 20(20):4266–4273.
- Liu LP, Yang M, Peng QZ, Li MY, Zhang YS, Guo YH, Chen Y, Bao SY. 2017. UBE2T promotes hepatocellular carcinoma cell growth via ubiquitination of p53. Biochem Biophys Res Commun. 493(1):20–27.
- Liu LL, Zhu JM, Yu XN, Zhu HR, Shi X, Bilegsaikhan E, Guo HY, Wu J, Shen XZ. 2019. UBE2T promotes proliferation via G2/M checkpoint in hepatocellular carcinoma. Cancer Manag Res. 11:8359–8370.
- Longerich S, San Filippo J, Liu D, Sung P. 2009. FANCI binds branched DNA and is monoubiquitinated by UBE2T-FANCL. J Biol Chem. 284(35):23182–23186.
- Machida YJ, Machida Y, Chen Y, Gurtan AM, Kupfer GM, D'Andrea AD, Dutta A. 2006. UBE2T is the E2 in the Fanconi anemia pathway and undergoes negative autoregulation. Mol Cell. 23(4):589–596.
- Maere S, Heymans K, Kuiper M. 2005. BiNGO: a Cytoscape plugin to assess overrepresentation of gene ontology categories in biological networks. Bioinformatics. 21(16):3448–3449.
- Mas VR, Maluf DG, Archer KJ, Yanek K, Kong X, Kulik L, Freise CE, Olthoff KM, Ghobrial RM, McIver P, Fisher R. 2009. Genes involved in viral carcinogenesis and tumor initiation in hepatitis C virus-induced hepatocellular carcinoma. Mol Med. 15:85–94.
- Morreale FE, Bortoluzzi A, Chaugule VK, Arkinson C, Walden H, Ciulli A. 2017. Allosteric targeting of the Fanconi anemia ubiquitin-conjugating enzyme UBE2T by fragment screening. J Med Chem. 60(9):4093–4098.
- Niu Y, Wu Z, Shen Q, Song J, Luo Q, You H, Shi G, Qin W. 2013. Hepatitis B virus X protein co-activates pregnane X receptor to induce the cytochrome P450 3A4 enzyme, a potential implication in hepatocarcinogenesis. Dig Liver Dis. 45(12):1041–1048.
- Patel AA, Walling AM, Ricks-Oddie J, May FP, Saab S, Wenger N. 2017. Palliative care and health care utilization for patients with end-stage liver disease at the end of life. Clin Gastroenterol Hepatol. 15(10):1612–1619.
- Roessler S, Jia HL, Budhu A, Forgues M, Ye QH, Lee JS, Thorgeirsson SS, Sun Z, Tang ZY, Qin LX, Wang XW. 2010. A unique metastasis gene signature enables prediction of tumor relapse in early-stage hepatocellular carcinoma patients. Cancer Res. 70(24):10202–10212.
- Sakai Y, Honda M, Fujinaga H, Tatsumi I, Mizukoshi E, Nakamoto Y, Kaneko S. 2008. Common transcriptional signature of tumor-infiltrating mononuclear inflammatory cells and peripheral blood mononuclear cells in hepatocellular carcinoma patients. Cancer Res. 68(24):10267–10279.
- Sartorius K, Sartorius B, Aldous C, Govender PS, Madiba TE. 2015. Global and country underestimation of hepatocellular carcinoma (HCC) in 2012 and its implications. Cancer Epidemiol. 39(3):284–290.
- Schuppan D, Afdhal NH. 2008. Liver cirrhosis. Lancet. 371(9615):838–851.
- Shannon P, Markiel A, Ozier O, Baliga NS, Wang JT, Ramage D, Amin N, Schwikowski B, Ideker T. 2003. Cytoscape: a software environment for integrated models of biomolecular interaction networks. Genome Res. 13(11):2498–2504.
- Szklarczyk D, Gable AL, Lyon D, Junge A, Wyder S, Huerta-Cepas J, Simonovic M, Doncheva NT, Morris JH, Bork P, et al. 2019. STRING v11: protein-protein association networks with increased coverage, supporting functional discovery in genome-wide experimental datasets. Nucleic Acids Res. 47:607–613.
- Tang Z, Li C, Kang B, Gao G, Li C, Zhang Z. 2017. GEPIA: a web server for cancer and normal gene expression profiling and interactive analyses. Nucleic Acids Res. 45:98–102.
- Tapper EB, Finkelstein D, Mittleman MA, Piatkowski G, Lai M. 2015. Standard assessments of frailty are validated predictors of mortality in hospitalized patients with cirrhosis. Hepatology. 62(2):584–590.
- Tapper EB, Parikh ND. 2018. Mortality due to cirrhosis and liver cancer in the United States, 1999–2016: observational study. Br Med J. 362:k2817.
- Torrecilla S, Sia D, Harrington AN, Zhang Z, Cabellos L, Cornella H, Moeini A, Camprecios G, Leow WQ, Fiel MI, et al. 2017. Trunk mutational events present minimal intra- and inter-tumoral heterogeneity in hepatocellular carcinoma. J Hepatol. 67(6):1222–1231.
- Ueki T, Park JH, Nishidate T, Kijima K, Hirata K, Nakamura Y, Katagiri T. 2009. Ubiquitination and downregulation of BRCA1 by ubiquitin-conjugating enzyme E2T overexpression in human breast cancer cells. Cancer Res. 69(22):8752–8760.
- Villanueva A. 2019. Hepatocellular carcinoma. N Engl J Med. 380(15):1450–1462.
- Villanueva A, Portela A, Sayols S, Battiston C, Hoshida Y, Méndez-González J, Imbeaud S, Letouzé E, Hernandez-Gea V, Cornella H, et al. 2015. DNA methylation-based prognosis and epidrivers in hepatocellular carcinoma. Hepatology. 61(6):1945–1956.
- Wang Y, Jiang T, Li Z, Lu L, Zhang R, Zhang D, Wang X, Tan J. 2017. Analysis of differentially co-expressed genes based on microarray data of hepatocellular carcinoma. Neoplasma. 64(2):216–221.
- Wei X, You X, Zhang J, Zhou C. 2019. MicroRNA-1305 inhibits the stemness of LCSCs and tumorigenesis by repressing the UBE2T-dependent Akt-signaling pathway. Mol Ther Nucleic Acids. 16:721–732.
- Wu M, Liu Z, Li X, Zhang A, Lin D, Li N. 2019. Analysis of potential key genes in very early hepatocellular carcinoma. World J Surg Oncol. 17(1):77.
- Wurmbach E, Chen YB, Khitrov G, Zhang W, Roayaie S, Schwartz M, Fiel I, Thung S, Mazzaferro V, Bruix J, et al. 2007. Genome-wide molecular profiles of HCV-induced dysplasia and hepatocellular carcinoma. Hepatology. 45(4):938–947.
- Xie F, Zhu F, Lu Z, Liu Z, Wang H. 2016. Investigation of potential molecular biomarkers and small molecule drugs for hepatocellular carcinoma transformed from cirrhosis. Oncol Lett. 12(1):495–503.
- Yildiz G, Arslan-Ergul A, Bagislar S, Konu O, Yuzugullu H, Gursoy-Yuzugullu O, Ozturk N, Ozen C, Ozdag H, Erdal E, et al. 2013. Genome-wide transcriptional reorganization associated with senescence-to-immortality switch during human hepatocellular carcinogenesis. PLoS One. 8(5):e64016.
- Zanger UM, Schwab M. 2013. Cytochrome P450 enzymes in drug metabolism: regulation of gene expression, enzyme activities, and impact of genetic variation. Pharmacol Ther. 138(1):103–141.
- Zhang H, Zhuo C, Zhou D, Zhang F, Chen M, Xu S, Chen Z. 2019. Association between the expression of carbonic anhydrase II and clinicopathological features of hepatocellular carcinoma. Oncol Lett. 17(6):5721–5728.