
Abstract
Ovarian cancer (OC) is a common gynecologic malignancy worldwide. Several members of the tripartite motif (TRIM) family are of great importance in various human malignancies. In this study, we aimed to figure out the function and mechanism of TRIM52 in OC. Western blot and RT–PCR were used to examine the expression level of TRIM52. Cell counting kit-8 (CCK-8) assay was used to measure cell proliferation. Annexin V/ PI kit and TUNEL assay were carried out to test cell apoptosis. Knockdown of TRIM52 significantly inhibited cell proliferation and induced cell apoptosis. Glucose uptake, lactate, and ATP production were depressed after TRIM52 silencing. Furthermore, loss of TRIM52 decreased the levels of pyruvate kinase isozyme M2, glucose transporter protein 1, and p-STAT3. Overexpression of TRIM52 showed effects that were opposite as those of TRIM52 knockdown; these effects were alleviated by AG490, which is an inhibitor of STAT3. In addition, TRIM52 knockdown inhibited tumorigenesis in a xenograft mouse model. Finally, we found that high level of TRIM52 expression predicted poor prognosis. In conclusion, TRIM52 knockdown inhibited cell proliferation and induced apoptosis through the activation of STAT3 signaling.
KEYWORDS:
Introduction
Ovarian cancer (OC) is a highly fatal gynecologic malignancy in women worldwide. As reported, there had been over 21,000 new ovarian cancer cases and over 14,000 deaths in the USA each year (Hollis and Gourley Citation2016). Currently, the standard therapy for OC is a combination of debulking surgery and systemic chemotherapy (Coleman et al. Citation2013). However, relapse is common after the first chemotherapy. Even with the administration of some chemotherapeutic regimens, the current five-year overall survival rate is only 45% (Huang et al. Citation2008). Therefore, there is an urgent need to explore the underlying mechanisms and novel biomarkers to treat OC.
The tripartite motif (TRIM) family members have been reported to be involved in cancer development (Cambiaghi et al. Citation2012). TRIM52, which is a novel member of the TRIM family, has not been well studied. A previous study indicated that TRIM52 plays an essential role in the survival or proliferation of certain genetic cancer cells (Benke et al. Citation2018). Overexpression of TRIM52 was found to enhance cell proliferation through ubiquitination of PPM1A in HCC cells (Zhang et al. Citation2018). In addition, TRIM52 was reported to serve as a positive regulator of the NF-κB pathway (Fan et al. Citation2017). Recently, TRIM52 was found to play an oncogenic role by activating the NF-κB pathway in OC (Yang et al. Citation2018). However, the function of TRIM52 remains largely unknown.
As a transcription factor, signal transducer and activator of transcription 3 (STAT3) have been reported to play a crucial role in numerous malignancies (Song et al. Citation2003; Sano et al. Citation2005; Furtek et al. Citation2016). Phosphorylation of STAT3 at Tyr-705 marks the activation of the STAT3 pathway. In such case, STAT3 is allowed to translocate to the nucleus and regulate the transcription of downstream genes(Yu et al. Citation2009). Cytokines and growth factors can stimulate STAT3, whereas the Janus family kinases (JAK) can execute the phosphorylation of STAT3 (Garcia et al. Citation2001; Song et al. Citation2003).
In the current study, we determined the function of TRIM52 in OC and evaluated the association of STAT3 with the regulation of TRIM52 in OC tumorigenesis.
Materials and methods
Immunohistochemistry (IHC)
A human ovarian cancer tissue chip was purchased from SHANGHAI OUTDO BIOTECH CO., LTD. The paraffin-embedded tissue array was subjected to IHC staining with anti-TRIM52 antibody (1:150 dilution). The expression level of TRIM52 was scored based on visual grading of the staining intensity. A scale of 0–4 was used for the grading, with <5% staining scored as 0, 5–25% staining scored as 1, 25–50% staining scored as 2, 50–75% staining scored as 3, and >75% staining scored as 4. Hscore ≤ 2 was sorted as a low protein level, and Hscore >2 was sorted as a high protein level.
Cell culture
CAOV3, SKOV3, A2780, OVCAR3, HO8910, and IOSE80 cell lines were purchased from the Cell Bank of Type Culture Collection of the Chinese Academy of Sciences (Shanghai, China). CAOV3 and SKOV3 cell lines were cultured with DMEM medium (Invitrogen, Grand Island, NY, USA); A2780, OVCAR3, and HO8910 were cultured with RPMI1640 medium (Invitrogen, Grand Island, NY, USA); IOSE80 was cultured in 199/MCDB 105 (1:1) medium (Sigma, St. Louis, MO). 10% FBS (Hyclone, Logan, Utah, USA) was added to the culture medium, and 10 µM of the JAK/STAT3 inhibitor AG490 (Selleck, USA) was used to treat the cells.
RNA isolation and qRT-PCR
Total cell RNA was isolated using TRIzol Reagent (Invitrogen, Carlsbad, CA, USA). After measuring RNA concentration, 2 µg of RNA was reverse transcribed into cDNA using cDNA synthesis kit (Invitrogen). FastStart Universal SYBR Green Master (Roche) was used to measure mRNA expression level. The relative expression level of mRNA was normalized to GAPDH. The primers were as follows:
TRIM52 Forward 5′ GCCATCTGCTTGGATTACTTC 3′
Reverse 5′ TTCATCTTCCTCCTCGTTCTG 3′
GAPDH Forward 5′ AATCCCATCACCATCTTC 3′
Reverse 5′ AGGCTGTTGTCATACTTC 3′
Western blot
Upon harvest, the cells were suspended with RIPA buffer containing protease and phosphatase inhibitors (Invitrogen, Carlsbad, CA, USA). Then, protein concentration was measured by a Protein Assay Dye Reagent (Bio-Rad Laboratories, Inc., Hercules, CA, USA). A total of 20 µg of protein lysates from each sample were mixed with SDS loading buffer, resolved by SDS-PAGE, transferred to PVDF membranes, and incubated with primary and secondary antibodies. All primary antibodies were purchased from Abcam (St. Louis, MO, USA).
Lentivirus
All the lentiviruses, including TRIM52 knockdown (shTRIM52-1: CCATCTGCTTGGATTACTT, shTRIM52-2: GCTTTACACGTCGCAGCTT, and shTRIM52-3: GCATGTGCTTTAAACACCA); TRIM52 overexpression; shNC; and vector, were purchased from Genechem company (Shanghai, China). At 48 h after lentivirus infection, the cells were used for the other experiments.
Cell proliferation assay
A total of 5000 treated cells were seeded into 96-well plates. At each time point, the cells were incubated with the cell counting kit-8 (CCK-8) working solution (CCK-8: medium was 1:10) for one hour. Thereafter, absorbance was measured at 450 nm using a plate reader.
Cell apoptosis assay
Annexin V and propidium iodide (PI) staining kit were used to perform cell apoptosis in the CAOV3 and OVCAR3 cells. Briefly, the cells were harvested and resuspended in the working buffer that was offered by the kit. Then, the cells were stained with Annexin V for 20 min in the dark, followed by staining with PI for five minutes. The fluorescence intensities were collected by flow cytometer (BD Biosciences, San Jose, CA, USA).
Glucose metabolism
A total of 2 × 10⁵ CAOV3 and OVCAR3 cells were seeded into a six-well plate. After six hours of culture, the medium was harvested to measure protein concentration using BCA assay. Lactic acid assay kit (Biovision, Mountain View, CA) and ATP Assay Kit (Jiancheng Bioengineering Institute, Nanjing, China) were used to measure the production of lactate and cellular ATP, respectively. A 2-NBDG Glucose Uptake Assay Kit (Cell-Based, AmyJet Scientific, Inc.) was used to measure glucose uptake.
Xenograft mouse model
All the animal experiments in this study were approved by the Fudan University Animal Care and Use Committee. CAOV3-shNC and CAOV3-shTRIM52 cells (2.5 × 10⁵ per mouse) were subcutaneously injected into each flank of six-week-old nude mice (Shanghai SLAC Laboratory Animal Co., Ltd., Shanghai, China). Two groups of mice (n = 6 per group) were maintained under pathogen-free conditions. Tumor volumes were calculated twice each week.
Histology and TUNEL assay
Xenograft tumors were fixed in 10% formalin for 16 h. Thereafter, the tumors were paraffin-embedded and cut into 5-µm sections, followed by conventional hematoxylin and eosin staining (Solarbio, Beijing, China). TUNEL (Bio-Rad Laboratories, Inc., Hercules, CA, USA) kit was used to measure apoptosis of xenograft tumors samples, according to the manufacturer’s instructions.
Statistical analysis
All data were presented as mean ± SD. The statistical significance of the results was analyzed using unpaired two-tailed Student’s t-test. P-values of <0.05 indicated statistical significance.
Results
High level of TRIM52 expression predicted poor prognosis
In order to investigate the relationship between TRIM52 and OC, we first analyzed the multivariate survival from the online database. Kaplan–Meier analysis demonstrated that TRIM52 expression was dramatically associated with shortened overall survival (HR 1.28, P = 0.027) of patients with OC (Figure (A)). Furthermore, an OC tissue array was used to measure the protein level of TRIM52. As shown in Figure (B), TRIM52 was highly upregulated in OC samples compared to that in normal tissues. Moreover, we divided OC tissues into high- and low-TRIM52 protein expression groups by IHC staining (Figure (C)). In addition, TRIM52 protein expression was significantly correlated with tumor size and FIGO stage (Table ).
Figure 1. High level of TRIM52 expression predicts poor prognosis. (A) KM-plot database was used for multivariate analysis of the survival of patients with OC. (B) Hscore of tissues. (C) The expression level of TRIM52 was measured in normal and OC tissues by IHC staining. (100 µm scale bar).
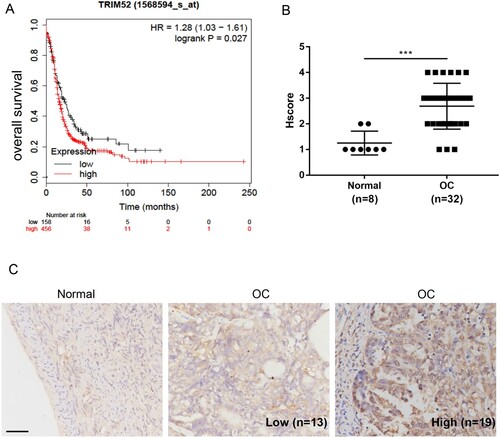
Table 1. Correlation between the TRIM52 expression and clinicopathological characteristics in 32 patients with HGSOC.
TRIM52 knockdown inhibited cell proliferation and induced apoptosis of OC cells in vitro and in vivo
To explore the role of TRIM52 in OC, we evaluated the expression level of TRIM52 in several OC cell lines (CAOV3, SKOV3, A2780, OVCAR3, and HO8910) and the ovarian epithelial cell line IOSE80. As shown in Figure (A), TRIM52 was expressed in all these cell lines, but the expression level was significantly higher in the OC cell lines than in the ovarian epithelial cell line (P < 0.05).
Figure 2. TRIM52 knockdown inhibits cell proliferation and induces apoptosis. (A) TRIM52 expression was detected in the OC cell and ovarian epithelial cell lines. *P < 0.05, **P < 0.01, ***P < 0.001 vs. HO8910. #P < 0.05, ##P < 0.01, ###P < 0.001 vs. IOSE80. (B) qRT-PCR and Western blot were used to evaluate TRIM52 knockdown efficiency. (C) Cell proliferation was measured by the CCK-8 assay. (D) Cell apoptosis was measured by the Annexin-V/ PI assay. (E) Statistic analysis results of cell apoptosis in the different groups. ***P < 0.001 vs. shNC.
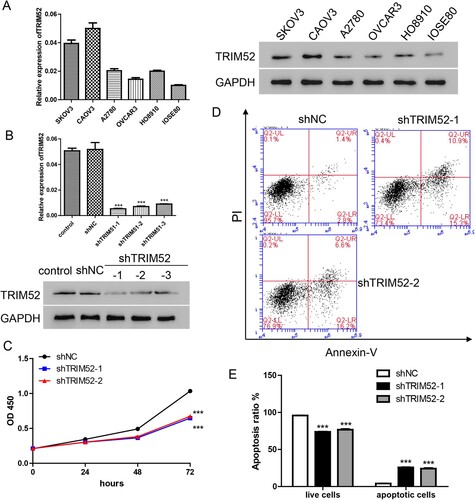
We attempted TRIM52 knockdown using lentivirus (shTRIM52) in the CAOV3 cells, which had the highest level of TRIM52. We found that all three lentiviruses significantly inhibited TRIM52 in both the mRNA and protein levels (Figure (B)). Because of their superior knockdown efficiency, shTRIM52-1 and shTRIM52-2 were used for subsequent experiments. Interestingly, knockdown of TRIM52, compared with shNC, markedly inhibited cell proliferation (Figure (C)). In addition, cell apoptosis was highly increased after treatment with TRIM52 knockdown lentivirus (Figure (D,E)).
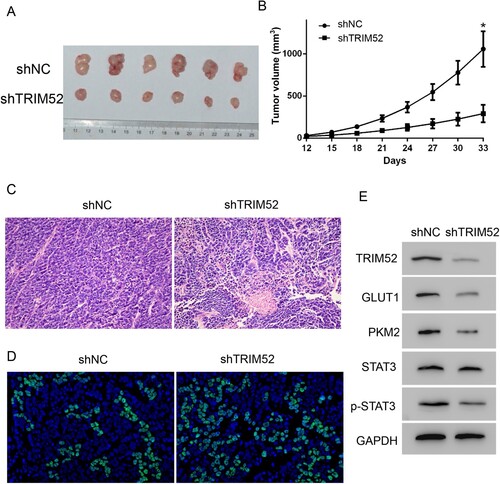
A xenograft mouse model was established to determine the effects of TRIM52 in vivo. Cell transduction with shTRIM52 or shNC lentivirus was performed by injection into different sites of the flank of nude mouse. As shown in Figure (A,B), the tumor volume was much smaller in the shTRIM52 group than in the shNC group; this meant that knockdown of TRIM52 markedly decreased tumor growth. Moreover, histologic analyses of these tumors showed that TRIM52 knockdown tumors exhibited some apoptotic bodies and morphologic changes (Figure (C)). Moreover, TUNEL assay showed that TRIM52 knockdown tumors, compared with the shNC group, exhibited more apoptosis cells (Figure (D)). These in vivo results were consistent with the in vitro results.
Figure 3. TRIM52 knockdown inhibits tumor growth in vivo. (A) Images of the CAOV3-derived xenograft tumors at the end of study. (B) Tumor growth curves of the CAOV3-derived mouse xenografts. (C) Representative images of H&E staining of the CAOV3-derived tumor sections (magnification ×200). (D) Representative images of TUNEL staining of the tumor sections (magnification ×200). (E) Western blot was used to quantify the protein levels of TRIM52, GLUT1, PKM2, p-STAT3, and STAT3. *P < 0.05 vs. shNC.
TRIM52 knockdown depressed glucose metabolism in CAOV3 cells
In hypoxic conditions, cancer cells adapt to glycolysis for energy production (Ganapathy-Kanniappan and Geschwind Citation2013). In this study, we evaluated glucose metabolism using the glucose analog 2-NBDG. As shown in Figure (A), TRIM52 knockdown significantly decreased the level of 2-NBDG in the CAOV3 cells. Furthermore, we found that TRIM52 knockdown suppressed the production of lactate and ATP (Figures (B,C)). These results indicated that silencing of TRIM52 might inhibit cell proliferation by regulating glucose metabolism.
Figure 4. TRIM52 knockdown depresses glucose metabolism in CAOV3 cells. (A) Glucose uptake was analyzed by measuring the level of 2-NBDG. (B–C) Lactate and ATP production were measured after treatment with shTRIM52 lentivirus. (D) Western blot was used to quantify the protein levels of TRIM52, GLUT1, PKM2, p-STAT3, and STAT3.
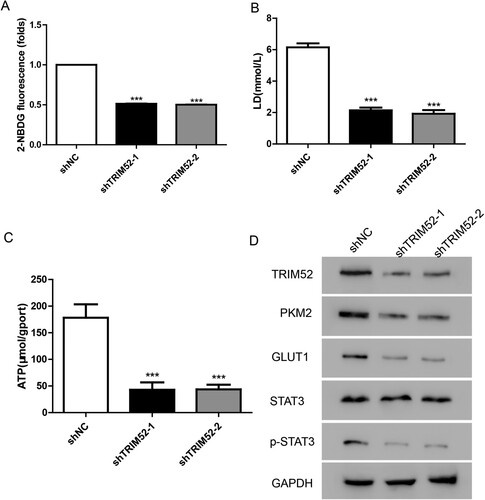
As reported, glucose transporter proteins (GLUT) 1 and pyruvate kinase isozymes M2 (PKM2) play key roles in regulating glycolysis (Yang et al. Citation2014; Lu et al. Citation2018). To further explore the mechanism of TRIM52 in glycolysis, we measured the protein levels of GLUT1 and PKM2. Our data showed that GLUT1 and PKM2 were downregulated in the TRIM52 knockdown cells (Figure (D)). Moreover, the phosphorylation of STAT3 (p-STAT3) was highly decreased in the TRIM52 knockdown cells (Figure (D)). In addition, we quantified the protein levels of TRIM52, GLUT1, PKM2, p-STAT3, and STAT3 in the tumor samples from the xenograft mouse model and found that knockdown of TRIM52 significantly decreased GLUT1, PKM2, and p-STAT3 (Figure (E)).
The JAK/STAT3 inhibitor AG490 abolished the effects induced by TRIM52
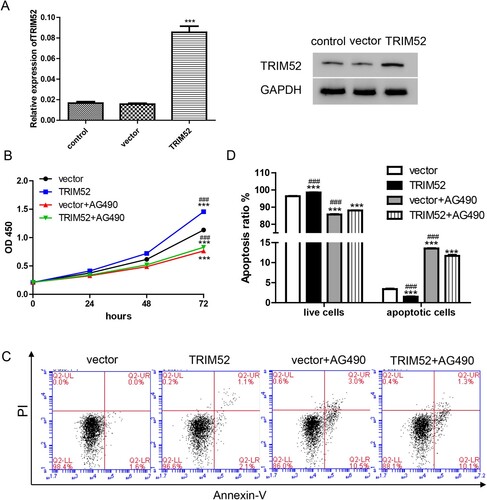
Based on previous results, we assumed that there should be a correlation between STAT3 and TRIM52. Therefore, the JAK/ STAT3 inhibitor AG490 was involved to treat the cells. First, TRIM52 overexpression lentivirus (TRIM52) was used to overexpress TRIM52 in the OVCAR3 cells, which had the lowest level of TRIM52 (Figure (A)). We found that compared with vector group, TRIM52 markedly promoted cell proliferation and inhibited apoptosis. On the other hand, these effects were alleviated by AG490 (Figure ).
Figure 5. AG490 abolishes the increased cell growth induced by TRIM52. (A) qRT-PCR and Western blot were used to evaluate the level of TRIM52 in the OVCAR3 cells. (B) Cell proliferation was measured by the CCK-8 assay. (C) Cell apoptosis was measured by the Annexin-V/PI assay. (D) Statistic analysis results of cell apoptosis in the different groups. ***P < 0.001 vs. vector, ###P < 0.001 vs. TRIM52 + AG490.
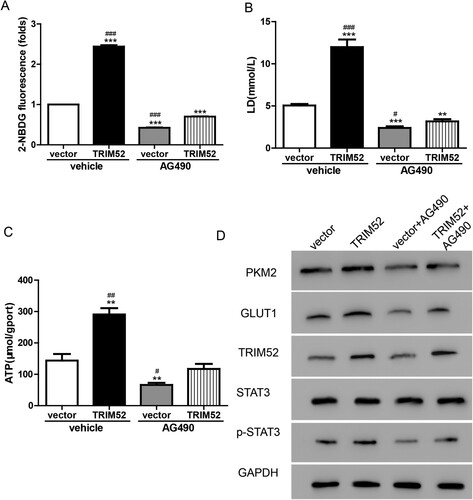
In addition, we evaluated glucose metabolism and found that AG490 blocked the TRIM52-induced increase in 2-NBDG (Figure (A)). As shown in Figure (B,C), the production of lactate and ATP was increased by TRIM52 but was decreased by AG490 in the cells transduced with TRIM52 lentivirus. Furthermore, the TRIM52-induced upregulated protein levels of GLUT1, PKM2, and p-STAT3, were alleviated by AG490 in the OVCAR3 cells (Figure (D)). Taken together, the effects of TRIM52 were abolished by the JAK/ STAT3 inhibitor AG490 in the OVCAR3 cells. This involvement of the STAT3 signaling pathway in the function of TRIM52 in OC.was a novel finding.
Figure 6. AG490 plays a role opposite to that of TRIM52 in regulating glucose metabolism in OVCAR3 cells. (A) Glucose uptake was analyzed by measuring the level of 2-NBDG. (B–C) Lactate and ATP production were measured. (D) Western blot was used to quantify the protein levels of TRIM52, GLUT1, PKM2, p-STAT3, and STAT3. **P < 0.01 vs. vector, ***P < 0.001 vs. vector, #P < 0.05 vs. TRIM52+AG490, ##P < 0.01 vs. TRIM52+AG490, ###P < 0.001 vs. TRIM52 + AG490.
Discussion
TRIM family members may play an oncogenic role in many different types of malignant tumors. For instance, TRIM8, TRIM6, and TRIM14 are involved in STAT3 signaling (Zhang et al. Citation2017; Jin et al. Citation2018; Zeng et al. Citation2019). In the current study, we found that knockdown of TRIM52 inhibited cell proliferation in vitro and tumor growth in vivo. Elevated TRIM52 expression was associated with poor prognosis in patients with OC. These results suggested that TRIM52 may play an oncogenic role, consistent with previous reports (Yang et al. Citation2018;; Zhang et al. Citation2018 Pan et al. Citation2019).
TRIM52 has been demonstrated to play an oncogenic role through a different mechanism. Y. Zhang et al reported that TRIM52 overexpression promoted cell proliferation in hepatocellular carcinoma cells through the ubiquitination of PPM1A (Zhang et al. Citation2018). Moreover, S. Pan et al reported that TRIM52 increased cell proliferation in colorectal cancer through the STAT3 signaling pathway (Pan et al. Citation2019). Activated STAT3 was found to be associated with growth and metastasis of OC (Chaluvally-Raghavan et al. Citation2016; Saini et al. Citation2017), whereas inhibition of STAT3 by AG490 suppressed OC cell growth (Zhong et al. Citation2015). Inhibition of JAK1/ STAT3 signaling was reported to decrease tumor progression and metastasis in OC (Wen et al. Citation2014). In this study, downregulated p-STAT3 was observed in both the CAOV3 cells and xenograft tumors samples after TRIM52 knockdown. Furthermore, overexpression of TRIM52 increased the p-STAT3 level in the OVCAR3 cells, but AG490 was able to block these effects. These results suggested that STAT3 signaling was involved in the function of TRIM52 in OC. W. Yang et al found that knockdown of TRIM52 suppressed cell proliferation, migration, and invasion; induced apoptosis in CAOV3 cells; and blocked tumor growth in vivo (Yang et al. Citation2014). Furthermore, the NF-κB signaling pathway had been known to be involved in the function of TRIM52 in OC. In this study, we also found that silencing of TRIM52 inhibited cell proliferation and induced apoptosis in the CAOV3 cells and inhibited tumor growth in xenograft mice. Notably, we discovered that STAT3 signaling was involved in this process. Moreover, we found that TRIM52 could regulate glucose metabolism in OC cell lines. In addition, high level of TRIM52 expression was found to be associated with poor prognosis. Our new findings suggested that TRIM52 serves as an oncogene by regulating STAT3 signaling and may be a novel therapy target in OC.
Aberrant metabolism is a common feature of cancer cells (Vander Heiden et al. Citation2009). In hypoxic conditions, cancer cells switch to the glycolysis pathway to obtain ATP (i.e. Warburg effect); this plays a crucial role in maintaining cancer cell proliferation (Hanahan and Weinberg Citation2011). GLUT1 facilitates the transport of glucose and was reported to be associated with poor prognosis in OC (Cho et al. Citation2013). In this study, we demonstrated that knockdown of TRIM52 inhibited glucose uptake and the production of lactate and ATP and decreased the levels of PKM2 and GLUT1. PKM2, which is a member of the pyruvate kinase family, catalyzes the final and rate-limiting reaction in the glycolytic pathway(Wong et al. Citation2013). There are two forms of PKM2; one is an enzymatic active tetramer that drives glucose towards oxidative metabolism, whereas the other is a protein kinase active dimeric that regulates cell metabolism by promoting the expression of glycolysis genes, including GLUT1, PDK1, and LDHA (Wang et al. Citation2018). In addition, PKM2 has been reported to promote cell proliferation by phosphorylation of the STAT3 signaling pathway (Gao et al. Citation2013). Taken together, we supposed that TRIM52 knockdown regulated glucose metabolism through the PKM2/ STAT3 axis. On the contrary, S. Pan et al reported that TRIM52 promoted colorectal cancer cell proliferation through the STAT3 signaling by promoting the ubiquitination of SHP2, which is a negative regulator of STAT3 phosphorylation (Pan et al. Citation2019).
In conclusion, the current study demonstrated that TRIM52 knockdown inhibited cell proliferation and induced apoptosis by regulating glucose metabolism through activation of the STAT3 signaling pathway.
Data availability statement
The data that support the findings of this study are available in ‘figshare’ [https://figshare.com/] at
http://doi.org/10.6084/m9.figshare.14702145
http://doi.org/10.6084/m9.figshare.14702148
http://doi.org/10.6084/m9.figshare.14702160
http://doi.org/10.6084/m9.figshare.14702169
http://doi.org/10.6084/m9.figshare.14702175
Disclosure statement
No potential conflict of interest was reported by the author(s).
Additional information
Funding
References
- Benke S, et al. 2018. Human tripartite motif protein 52 is required for cell context-dependent proliferation. Oncotarget. Mar. 2(9):13565–13581.
- Cambiaghi V, et al. 2012. TRIM proteins in cancer. Adv Exp Med Biol. 770:77–91.
- Chaluvally-Raghavan P, et al. 2016. Direct upregulation of STAT3 by MicroRNA-551b-3p deregulates growth and metastasis of ovarian cancer. Cell Rep. May. 17(15):1493–1504.
- Cho H, et al. 2013. Overexpression of glucose transporter-1 (GLUT-1) predicts poor prognosis in epithelial ovarian cancer. Cancer Investig. Nov. 31:607–615.
- Coleman RL, et al. 2013. Latest research and treatment of advanced-stage epithelial ovarian cancer. Nat Rev Clin Oncol. Apr. 10:211–224.
- Fan W, et al. 2017. TRIM52: a nuclear TRIM protein that positively regulates the nuclear factor-kappa B signaling pathway. Mol Immunol. Feb. 82:114–122.
- Furtek SL, et al. 2016. Strategies and approaches of Targeting STAT3 for cancer treatment. ACS Chem Biol. Feb. 19(11):308–318.
- Ganapathy-Kanniappan S, Geschwind JF. 2013. Tumor glycolysis as a target for cancer therapy: progress and prospects. Mol Cancer. Dec. 3(12):152.
- Gao X, et al. 2013. Reciprocal regulation of protein kinase and pyruvate kinase activities of pyruvate kinase M2 by growth signals. J Biol Chem. May 31;288:15971–15979.
- Garcia R, et al. 2001. Constitutive activation of Stat3 by the Src and JAK tyrosine kinases participates in growth regulation of human breast carcinoma cells. Oncogene. May. 3(20):2499–2513.
- Hanahan D, Weinberg RA. 2011. Hallmarks of cancer: the next generation. Cell. Mar. 4(144):646–674.
- Hollis RL, Gourley C. 2016. Genetic and molecular changes in ovarian cancer. Cancer Biol Med. Jun;13:236–247.
- Huang L, et al. 2008. Improved survival time: what can survival cure models tell us about population-based survival improvements in late-stage colorectal, ovarian, and testicular cancer? Cancer. May 15;112:2289–2300.
- Jin Z, et al. 2018. TRIM14 promotes colorectal cancer cell migration and invasion through the SPHK1/STAT3 pathway. Cancer Cell Int. 18:202. Epub 2018/12/18.
- Lu YX, et al. 2018. Pharmacological Ascorbate suppresses growth of Gastric Cancer Cells with GLUT1 overexpression and enhances the efficacy of Oxaliplatin through redox modulation. Theranostics. 8:1312–1326.
- Pan S, et al. 2019. TRIM52 promotes colorectal cancer cell proliferation through the STAT3 signaling. Cancer Cell Int. 19:57.
- Saini U, et al. 2017. Elevated STAT3 expression in ovarian cancer ascites promotes invasion and metastasis: a potential therapeutic target. Oncogene. Jan 12;36:168–181.
- Sano S, et al. 2005. Stat3 links activated keratinocytes and immunocytes required for development of psoriasis in a novel transgenic mouse model. Nat Med. Jan;11:43–49.
- Song L, et al. 2003. Activation of Stat3 by receptor tyrosine kinases and cytokines regulates survival in human non-small cell carcinoma cells. Oncogene. Jul 3;22:4150–4165.
- Vander Heiden MG, et al. 2009. Understanding the Warburg effect: the metabolic requirements of cell proliferation. Science. May 22;324:1029–1033.
- Wang B, et al. 2018. PKM2 is involved in neuropathic pain by regulating ERK and STAT3 activation in rat spinal cord. J Headache Pain. Jan 18;19:7.
- Wen W, et al. 2014. Targeting JAK1/STAT3 signaling suppresses tumor progression and metastasis in a peritoneal model of human ovarian cancer. Mol Cancer Ther. Dec;13:3037–3048.
- Wong N, et al. 2013. PKM2, a central point of regulation in cancer metabolism. Int J Cell Biol. 2013:242513.
- Yang L, et al. 2014. PKM2 regulates the Warburg effect and promotes HMGB1 release in sepsis. Nat Commun. Jul 14;5:4436.
- Yang W, et al. 2018. TRIM52 plays an oncogenic role in ovarian cancer associated with NF-kB pathway. Cell Death Dis. Sep 5;9:908.
- Yu H, et al. 2009. STATs in cancer inflammation and immunity: a leading role for STAT3. Nat Rev Cancer. Nov. 9:798–809.
- Zeng G, et al. 2019. E3-ubiquitin ligase TRIM6 aggravates myocardial ischemia/reperfusion injury via promoting STAT1-dependent cardiomyocyte apoptosis. Aging (Albany NY). 11:3536–3550. Epub 2019/06/07.
- Zhang C, et al. 2017. TRIM8 regulates stemness in glioblastoma through PIAS3-STAT3. Mol Oncol. Mar;11:280–294. Epub 2017/01/19.
- Zhang Y, et al. 2018. TRIM52 up-regulation in hepatocellular carcinoma cells promotes proliferation, migration and invasion through the ubiquitination of PPM1A. Journal of Experimental & Clinical Cancer Research: CR. Jun 13;37:116.
- Zhong LX, et al. 2015. Inhibition of STAT3 signaling as critical molecular event in resveratrol-suppressed ovarian cancer cells. J Ovarian Res. Apr 22;8:25.