
Abstract
Folic acid and methylenetetrahydrofolate reductase enzyme (MTHFR) gene C677T (rs1801133) SNP have been proofed to influence the spermatogenesis. This study aimed to investigate the biochemical, histological, and immunohistochemical (IHC) of adult male rabbits after induction of infertility by adenine, and the role of MTHFR C677T genotypes with or without folic acid therapy. Thirty adult male rabbits were divided into three groups: control (G1), adenine-induced infertility (G2), and adenine-induced infertility with folic acid therapy (G3). The PCR-RFLP was applied to detect the MTHFR C677T genotypes. Biochemical analyses of seminal fluid, homocysteine, and sex hormones were determined with histological and IHC examination of testicular tissue. Morphometric measurements and a TUNEL assay of seminiferous tubules were also performed. The results revealed a significant increase in homocysteine and sperm abnormalities, while sex hormones, sperm count and motility decreased significantly in the TT genotype compared with the CC genotype. Also, G2 displayed a significant increase in homocysteine and sperm abnormalities, with a significant decrease in sex hormones, sperm count and motility as compared to the G1 and G3. In conclusion, MTHFR 677C > T polymorphism is a genetic risk factor for male infertility and folic acid has a potential role in the treatment of male infertility.
Introduction
Male infertility is a significant problem facing married couples worldwide; the percentage of infertile husbands is progressively increasing (Dhillon et al. Citation2007; Anawalt et al. Citation2019). Several genetic factors may have impacts on male infertility which play a role in idiopathic male infertility (Wernimont et al. Citation2011; Skakkebaek et al. Citation2016). DNA methylation is one of the crucial epigenetic modifications that have a vital effect in regulating gene expression in spermatogenesis, such as autosomal and Y-sex chromosomes. Therefore, defective expression of those genes that are implicated in spermatogenesis may lead to male infertility (Rahiminia et al. Citation2019).
Folic acid is made up of pteroic acid and L-glutamic acid, while the functional form of folate is tetrahydro-folic acid. MTHFR is an enzyme that converts homocysteine (Hcy) to methionine using methylene-tetrahydrofolate to be converted into tetrahydrofolate (Kumar et al. Citation2005). This process maintains folic acid in a free active form; otherwise, it will be trapped in the methylene-tetrahydrofolate form (Kim et al. Citation1997). The presence of folic acid in the methylene tetrahydrofolate form suppresses folic acid polyglutamization and prevent it from binding to cells, leading to a useless compound (Bailey and Ayling Citation2009). MTHFR is one of the crucial enzymes in the folic acid metabolic pathway and in methionine production. It is responsible for the conversion of 5,10-methylenetetrahydrofolate to 5-methyl tetrahydrofolate (Friso et al. Citation2002). A healthy fertility process is associated with a normal folic acid metabolic pathway; the genetic polymorphism of key enzymes in the folic acid cycle has been implicated in idiopathic male infertility (Friso et al. Citation2002). Defects in the metabolism of folic acid participate in wide metabolic functions, while MTHFR gene C677T (rs1801133) SNP is implicated in the disturbance of folic acid metabolism that elevates blood Hcy (Lunenfeld and Van Steirteghem Citation2004). Moreover, mutation of MTHFR C677T (rs1801133) was shown with possible contribution to abnormalities of spermatogenesis through the lack of a DNA methylation process (Poduri et al. Citation2008).
Thus far, the role of SNPs in male infertility have not been fully examined. Therefore, this experimental animal model study of male infertility was designed to investigate the biochemical, the histological, and the IHC alterations in the testicular structure of adult male rabbits after experimental induction of infertility by adenine, as well as the effect of MTHFR C677T genotypes on male infertility. Moreover, the current study investigated the effect of folic acid intake in restoring normal spermatogenesis among those with adenine-induced infertility who have the MTHFR C677T (rs1801133) SNP with CC and TT genotype carriers in an attempt to determine a simple therapeutic line for the treatment of male infertility.
Methods
This experimental study (in vivo study) was conducted in the central research laboratory of the Department of Medical Laboratories, College of Applied Medical Sciences, Qassim University, Saudi Arabia.
Drugs and chemicals
Adenine and folic acid powders were purchased from Research Products International (RPI) (Mt. Prospect, IL, USA). Reagent kits of ELISA techniques were purchased from R&D Systems Inc. (Minneapolis, USA). A TUNEL assay kit was purchased from abcam (Cambridge, UK).
Study animals and grouping
Thirty adult sexually mature New Zealand white male rabbits (aged six months and weighing 2–3 kg) were used in this study (Dutta and Sengupta Citation2018). They were acclimated for one week and trained to give semen for one month. The rabbits were housed under hygienic conditions in the animal house of the College of Applied Medical Sciences, Qassim University, Saudi Arabia at 21–24°C in A 12 h/12 h light/dark cycle and freely fed food and water during the experimental period. The rabbits were equally divided into three groups (N = 10) and received 5 mL of IS/kg through an intragastric tube to deliver the drugs for 30 days as follows: G1 rabbits received only 5 mL of IS/kg; G2 rabbits received 300 mg of adenine/kg dissolved in IS to induce infertility (Huang et al. Citation2014); G3 rabbits were given 40 mg of folic acid and 300 mg of adenine/kg dissolved in IS (Naughton et al. Citation2003).
Ethical approval
This study was approved by the Ethics Committee of Qassim University according to the institutional and national guidelines for animal use and care, ethical approval number [3439-cams1-2018-1-14-S]; date: 07/10/2018.
Collection and analysis of semen
At the end of the experiment, semen was obtained from all rabbits with different MTHFR genotypes to perform seminal fluid analysis. Semen was collected from two successive ejaculates of each male rabbit by a sterile artificial vagina using a female teaser rabbit. The semen was collected in a plastic syringe of 3 mL capacity at an interval of 15 min, as described previously by Naughton et al. (Citation2003), to measure the following parameters of the spermatozoa in fresh semen that predict the fertilizing ability of the experimental rabbits:
The total ejaculate volume of both ejaculates at an interval of 15 min/mL was measured in a graduated conical tube of 3 mL capacity and maintained at 37°C.
The sperm motility percent was measured in a diluted sample of semen (1:20 within 10 min from collection with a Tris-buffer medium) by using the CASA system (Hobson Tracker Limited, Sheffield, UK) for the evaluation of the motility pattern. Two drops of diluted semen were placed on a slide and covered with a cover slip, then examined under a phase-contrast microscope at 100×, equipped with a heating stage at 37°C, connected by a video camera to a monitor and recorded. The total number of sperms and immotile sperms was counted in five visual fields per sample (% motile spermatozoa = Number of motile sperms/total number of sperms×100) (Boiti et al. Citation2005).
The sperm cell concentration (million/mL) was estimated by dilution of the total volume of semen ejaculate (1:100 in a fixative solution of PBS and glutaraldehyde solution 2%) through use of a hemocytometer method and count two Neubauer chambers per sample (Habeeb et al. Citation2008).
The total sperm count (the total number of sperms/ejaculate) equals the sperm concentration × the volume of ejaculate.
The percentage of sperm abnormalities was estimated through dilution of the total volume of semen ejaculate (1:100 in a fixative solution of PBS and glutaraldehyde solution 2%). Then 20 μL of the solution was smeared on a clean slide. The smears were air-dried at 37°C and the sperms were stained in a single step with trypan blue, naphthol yellow, and eosin-Y solution, respectively, in 1% acetic acid. The percentage of abnormal spermatozoa was measured under a phase-contrast microscope (Nomarski contrast) in 200 spermatozoa from each rabbit and classified as normal or abnormal spermatozoa (Safaa et al. Citation2008).
Blood sample collection and analysis
After the semen had been obtained from all rabbits at the end of the experiment, all the rabbits were generally anesthetized by intramuscular injection of 35 mg pentobarbital sodium/kg in the gluteus muscle to obtain blood samples for the determination of MTHFR gene C677T SNP and the measurement of plasma Hcy and sex hormones (LH and testosterone). 2 mL of blood were withdrawn from the ears of each rabbit on the anticoagulant EDTA, then divided into two blood samples (1 mL each).
Determination of MTHFR gene C677T (rs1801133) SNP
Genomic DNA was extracted from the leucocytes of 1 mL peripheral blood using the Biospin Blood Genomic DNA Mini-Prep Kit (BioFlux, Iran) (Buffone and Darlington Citation1985; Boiti et al. Citation2005) and PCR-RFLP was used to detect the MTHFR C677T genotypes (Angeline et al. Citation2007; Habeeb et al. Citation2008). PCR amplification and PCR restricted segment detection (198 base pairs of the MTHFR gene) were carried out through the following procedure:
120 ng of the genomic DNA was incubated in 50 μL of both forward and backward primers of the MTHFR C677T SNP as follows: 5’-TGAAGGAGAAGGTGTCTGCGGGA-3’ and 5’-AGGACGGTGCGGTGAGAGTG-3’, respectively.
Restriction enzyme HinfI at 37°C for 3–4 h in the buffer was used to restrict the 198 bp product of the MTHFR DNA segment, yielding to CC, CT, and TT genotype fragment length as (198, 198, 175,23, and 175, 23), respectively.
The resulting PCR fragments were separated through the application of agarose gel (3%) including 5 mg/mL ethidium bromide and measured by 100 Base-Pair Ladder (Bioron).
Measurement of sex hormones
The remaining 1 mL of blood was centrifuged at 4000 rpm for 10 min to collect plasma samples for the measurement of Hcy, LH, and testosterone levels through use of the ELISA technique. The minimal detectable concentration of LH was estimated to be 3 mIU/mL. To convert the results of testosterone from ng/mL to nmol/L, the following equation was applied: 1 ng/mL = 3.47 nmol/L. The minimal level of testosterone ranged from 0.012 to 0.041 ng/mL (Naughton et al. Citation2003; Sanati and Nikmanesh Citation2008; Jones and Lopez Citation2013; Huang et al. Citation2014).
Light microscope (LM) histological and IHC studies
At the end of the experiment, all rabbits with different genotypes were sacrificed and processed to examine the testes histologically and IHC by the LM to record any pathological disorders in the testis.
Histological study
The excised specimens from both testes were processed (fixed in 10% formalin, dehydrated in ascending series of ethanol, cleared in xylene, and embedded in paraffin wax to obtain 5 μm sections). Then slides were deparaffinized with xylene and stained with the H&E, MT, and PAS techniques to examine the general histological structure of the testis (Suvana and Layton Citation2019).
IHC study
The TUNEL assay HRP-DAB method was used in the current study to localize apoptotic cells in the testis according to the protocol provided by the manufacturer (abcam). In brief, the slides were deparaffinized, rehydrated, and rinsed with TBS for 5 min (rinse with TBS after each of the following steps). The specimen was covered with 100 μL of Proteinase K solution for 20 min and 100 μL of 3% H2O2 for 5 min. 100 μL of TdT Equilibration buffer was added for 30 min, followed by the addition of 40 μL of TdT labeling reaction mix to each sample. Then, a cover slip was placed over the top and the sample was incubated at 37°C for 90 min. Slides were immersed in TBS to remove the cover slip, and then the specimen was covered with 100 μL of stop buffer and incubated at room temperature for 5 min. 100 μL of blocking buffer was added to the specimen and incubated at RT for 10 min. 100 μL of conjugate was immediately added to the specimen after careful blotting of the blocking buffer from the specimen, which was then incubated for 30 min. Next, the specimen was covered with 100 μL of DAB working solution and incubated for 15 min; it was then rinsed with dH2O. The specimen was covered with 100 μL Methyl green for 3 min. Slides were dehydrated by repeated immersion in 100% ethanol followed by xylene. DPX mounting media was added and, finally, the slide was covered with a glass cover slip. The reaction was observed as being dark brown in color in the nuclei of testicular cells compared to the negative control without use of the TdT labeling reaction mix.
Morphometric study
Image analysis of data from all groups was carried out on stored pictures acquired by a Leica LM digital camera; then data were analyzed by the Image J program (Media Cybernetics Inc., USA). Five fields from sections stained with H&E from all rabbits were examined and the selected areas of testicular tissue on the picture were divided into six regions to measure the mean of ST transverse diameter, ST epithelial height, and area% of collagen fibres between the ST and apoptotic testicular cells in the ST of 10 non-overlapping fields from each animal with magnification ×1000.
Statistical analysis
The data were collected and analyzed using the SPSS software version 16. Data were expressed as mean ± SD. A comparison of variables among male rabbit groups was performed with an unpaired t-test and a chi-square test for continuous and categorical variables, respectively. The association of the MTHFR C677T SNP alleles and genotypes with male infertility and relative risk estimation was tested by the odds ratio (OR). The correlation between Hcy levels and other parameters was tested through use of the correlation coefficient (r2). One-way ANOVA followed by a post-hoc Tukey’s test for intergroup comparisons were used for the following parameters: The diameter of ST/μm, the epithelial height of ST/μm, the area percentage of collagen fibres in the testis, the percentage of apoptotic cells (TUNEL assay) in ST of the testis, p-values of less than 0.05 were considered significant. The Pearson correlation was used to examine the relation between selected variables (Mousa et al. Citation2018).
Results
MTHFR C677T (rs1801133) SNP genotypes and alleles distribution
The allele and genotype frequency and alleles distribution among all groups is illustrated in Table , and the agarose gel electrophoresis findings of the MTHFR C677T SNP in different studied groups are shown in Figure (A, B, C) and Figure . The results of the current study revealed significant differences between all groups regarding the genotype and allele distributions of the MTHFR C677T SNP. The CC genotype was significantly more frequent in all groups while the TT genotype had the least frequency (X2 = 8.99, p = 0.01). The C allele frequency was greater in all studied groups than the T allele frequency. We estimated the risk ratio (X2 = 0.574, p = 0. 573, OR = 1.55 95%, CI = 0.494–4.896) but it showed a non-significant statistical result that may have been due to the small size of the studied sample (Table ). Otherwise, when we compared the genotype and allele distribution in G2 and G3 with that of G1, we could not detect any significant association between G2/G3 and G1 (X2 = 1.94, p = 0.746, X2 = 0.57, p = 0.75, respectively).
Figure 1. Findings of agarose gel electrophoresis of MTHFR CT SNP in the studied rabbits, marker (100 bp). Figure A: lanes 1, 2 homozygous for C (198 bp), lanes 3→10 heterozygous CT (198, 175 bp) and lanes 11→15 homozygous for T (175 bp). Figure B: lanes 1→4 homozygous for C (198 bp), lanes 5→8 heterozygous CT (198, 175 bp) and Lanes 9, 10 homozygous for T (175 bp). Figure C: lanes 1→5 homozygous for C (198 bp), lanes 6, 7 heterozygous CT (198, 175 bp) and lanes 8→10 homozygous for T (175 bp).
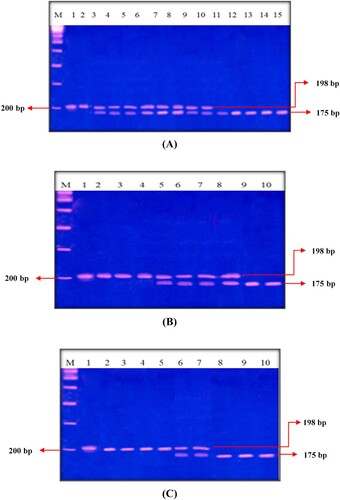
Figure 2. Allele and genotype frequencies for MTHFR C677T polymorphism in G1, G2, G3, and all groups (X2 and p-value).
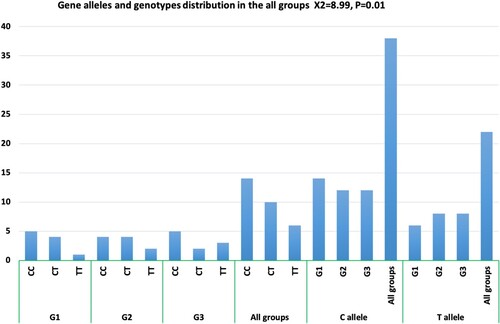
Table 1. Allele and genotype frequencies for MTHFR C677T polymorphism in all groups.
All data of plasma Hcy, LH, and testosterone levels with parameters of semen analysis in all groups are demonstrated in Table with an ANOVA (F) test. The levels of plasma Hcy displayed significant differences among all groups G1 (9.25 ± 1.17), G2 (12.04 ± 0.96), and G3 (9.93 ± 1.32) (F-value = 15.54, p ≤ 0.01). Hcy levels increased more significantly in G2 than in G1 (t = 5.27, p = 0.001), decreased more significantly in G3 than in G2 (t = −3.57, p = 0.028), and non-significantly decreased in G3 as compared to G1 (t = −1.28, p = 0.232). The plasma LH levels showed significant differences among all groups (F = 8.5, p = 0.001).
Table 2. Comparison of laboratory data of all groups (mean ± SD, ANOVA; (F) test and t-test).
The LH value was 3.54 ± 0.77 mIU/mL for G1, while it decreased to 2.1 ± 0.79 mIU/mL in G2 and increased in G3 (3.1 ± 0.85) (t = 6.72, p ≤ 0.001, t = 2.56, p = 0.03, respectively). The concentration of plasma testosterone in G1 was 4.2 ± 1.0 ng/mL, while it decreased to 2.39 ± 0.92 ng/mL in G2 and increased to 3.6 ± 0.96 ng/mL in G3, with significant differences among all groups (F-value = 9.02, p = 0.001). Moreover, the comparison of testosterone levels showed a more significant decrease in G2 as opposed to G1 and G3 (t-test value = 4.311, p = 0.002, t-test value = 2.54, p = 0.031, respectively). The comparison of the plasma content of Hcy, LH, and testosterone in G1 and G3 revealed no significant differences between the two groups (t = −1.28, p = 0.232, t = −1.37, p = 0.203, t = 1.54, p = 0.158, respectively). Moreover, the correlation co-efficient (r2) between Hcy levels and each of the LH and testosterone hormone levels appeared to be negative (r2 = 0.402, p = 0.023, r2 = −0.245, p = 0.192, respectively).
The results of the semen analysis (sperm count millions/mL), percentage of total sperm abnormality, and percentage of sperm motility revealed significant differences among all groups. The mean ± SD level of the sperm count in G1 was 187.4 ± 6.5 million/mL; it significantly decreased in G2 (85.5 ± 5.5 million/mL) as compared with G1 (t-value = −10.08, p = 0.001) and significantly increased in G3 (144.3 ± 7.4 million/mL) as compared with G2 (t = 8.211, p < 0.001). Importantly, the sperm count did not differ significantly between G1 and G3 (t = 3.047, p = 0.1) as shown in Table . There was a negative significant correlation between Hcy plasma levels and sperm count in all groups (r = −0.723, p ≤ 0.001). Concerning the percentages of sperm cell abnormality, a big increase was found in G2 and G3 as compared to G1 (t = 18.77, t = 16.627, p < 0.001, respectively), while less pronounced difference was observed between G3 and G2 (25.00 ± 1.1% versus 34.0 ± 1.7; t = −5.9, p < 0.01) as shown in Table . We also found that plasma Hcy positively correlate with the total sperm cell abnormality in all groups (r = 0.77, p ≤ 0.001). The percentage of sperm motility varied in all groups; it was 85.0 ± 5.1%, 48.0 ± 9.7%, and 53.3 ± 3.3% in G1, G2, and G3, respectively. Our data also indicated a significantly negative correlation between plasma levels of Hcy and sperm motility in all groups (r2 = −0.712, p ≤ 0.001). Excitingly, the folic acid treatment increased sperm motility in G3 as compared to G2, which did not receive folic acid (t = −3.823, p < 0.01).
In addition, MTHFR C677T genotypes were compared with the different biochemical parameters in all studied groups as shown in Table . The TT genotype carriers showed higher levels of plasma Hcy compared with the CC genotype carriers (t = 2.27, p = 0.032). To the contrary, the levels of plasma sex hormones (LH and testosterone), the total sperm count, and sperm motility were found to be bigger in CC genotype carriers as oppose to TT genotype carriers in all groups (t = 6.92, p ≤ 0.01; t = 1.84, p = 0.046; t = 18.91, p ≤ 0.001; t = 61.74, p ≤ 0.001). The percentage of sperm cell abnormalities appeared to be elevated in TT genotype carriers compared with CC genotype carriers (t = 13.87, p ≤ 0.001) (Table ).
Table 3. Comparison of laboratory data (mean ± SD, ANOVA; (F) test and t-test) with different MTHFR C677T genotypes in all groups (n = 30).
In addition, the current study examined the relationship between the estimated biochemical variables and the MTHFR C677T genotypes in G2 and G3 rabbits who had received adenine to induce infertility (Table ). The plasma levels of Hcy differed significantly among the different C677T genotypes (F value = 6.85, p = 0.007); they were greater in the TT genotype carriers compared with the CC genotype carriers (t = 2.7, p = 0.048). The plasma sex hormones (LH and testosterone), the sperm count, and sperm motility varied significantly in the different genotypes (F = 4.44, p = 0.028, F = 4.24, p = 0.032, F = 19.8, F = 39.635, p ≤ 0.001); they were bigger in the CC genotype carriers as compared with the TT genotype carriers (t-value = 2.79, p = 0.048, t = 4.929, p = 0.008, t = 15.152, t = 18.38, p ≤ 0.001, respectively). The percentage of sperm abnormality significantly decreased in the CC genotype carriers as compared with the TT genotype carriers (t = −16.081, p ≤ 0.001) (Table ).
Table 4. Comparison of laboratory data (mean ± SD, ANOVA; (F) test and t-test) with different MTHFR C677T genotypes in G2 and G3 (n = 20).
Light microscope histological and IHC results
LM examination of sections from the testes of G1 stained with HE stain in Figure showed normal testicular parenchyma of seminiferous tubules (ST) separated by a thin interstitium that had numerous Leydig cells in Figure (A). ST were lined with a stratified germinal epithelium formed of spermatogenic cells and Sertoli cells between them with acidophilic cytoplasm and large pale ovoid nuclei. Spermatogenic cells consisted of four types (spermatogonia resting on BM, large primary spermatocytes with large nuclei, a few small secondary spermatocytes, and numerous spermatids with deeply stained nuclei). Each tubule was enclosed in a single layer of flat myoid cells and had numerous sperms in its lumen. Leydig cells had acidophilic cytoplasm and ovoid nuclei, while sections stained with MT showed loose connective tissue (LCT) with small BV between the ST in Figure (A). Additionally, ST stained with PAS were surrounded by a thin, regular basement membrane (BM) in Figure (A), while the immunostained sections with TUNEL assay did not show apoptosis in spermatogenic or Sertoli cells as shown in Figure (A). Sections from the testis of G2 stained with HE stain in Figure revealed irregular ST that had irregular outlines and a thin epithelium with disorganized spermatogenic cells with few sperms in Figure (B). The disorganized epithelium showed many spermatogenic cells with darkly stained nuclei and intercellular separations with sloughed spermatogenic cells and few sperms in the lumen of ST. Some ST were lined by Sertoli cells and a few spermatogenic cells resting on BM with irregular myoid cells, while sections stained with MT showed ST enveloped by a thick, irregular BM and wide, thick interstitial tissue of LCT with congested blood vessels and numerous Leydig cells in Figure (B). Additionally, some areas of the interstitium stained with PAS were wide with acidophilic vacuolated hyaline material and multiple Leydig cells in Figure (B), while the immunostained sections with TUNEL assay showed apoptosis in spermatogenic cells as shown in Figure (B). Folic acid therapy in G3 nearly restored the normal testicular architecture that was similar to G1 rabbits with a mild improvement in the testicular structure. H&E stained sections from the testis of G3 in Figure revealed ST nearly similar to those of G1 and were lined with Sertoli cells, numerous spermatogonia resting on BM, primary spermatocytes, spermatids, and many spermatozoa in Figure (C). Numerous Leydig cells appeared in the interstitial tissue between the ST and near small blood vessels, while sections stained with MT included ST surrounded by a thin, regular BM and thin LCT with numerous Leydig cells in Figure (C). Additionally, ST stained with PAS were surrounded by a thin, regular BM; the interstitium was wide with vacuolated acidophilic hyaline material and multiple Leydig cells in Figure (C). Meanwhile, the immunostained sections with TUNEL assay in Figure (C) did not show apoptosis in spermatogenic or Sertoli cells. Furthermore, the morphometrical study and statistical analysis confirmed these results and revealed a significant decrease in the diameter and epithelial height of ST, while there was a significant increase in the area percentage of collagen fibres and the percentage of apoptotic cells in the ST of G2 compared to G1 and G3 (Table and Figures ).
Figure 3. Photomicrographs from the testes of rabbits that were stained with HE. A section from G1 in Figure A shows two seminiferous tubules (ST) lined by spermatogenic and Sertoli cells (SE). Spermatogonia (SG) and Sertoli cells (SE) rest on a thin basement membrane (BM) that is surrounded by flat myoid cells (M). Several layers of primary spermatocytes (PS), spermatids (SM) and sperms (SP) are observed. Multiple interstitial Leydig cells (L) with vesicular nuclei and acidophilic cytoplasm appear between the ST, while Figure B of G2 shows two irregular ST lined with few spermatogenic cells as SG and PS with numerous SE. Also, the lumen of ST has some SP and multiple sloughed spermatogenic cells (SL) that have dark condensed nuclei. Additionally, Figure C of G3 shows numerous SG and SE resting on the BM followed by multiple layers of PS and SP similar to those of G1. Multiple L cells appear around a small blood vessel (BV) between the ST. HE × 1000 and the bar = 50 μm.
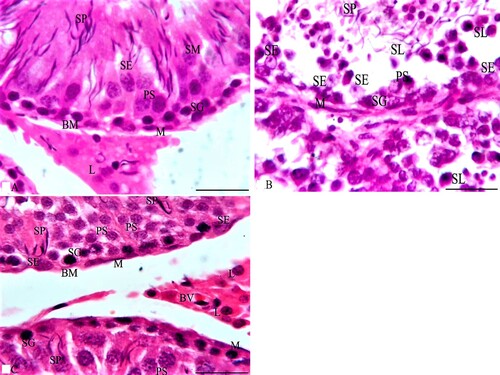
Figure 4. Photomicrographs from the testes of rabbits that were stained with MT. A section from G1 in Figure A shows boundaries between two ST that are surrounded by a thin BM and separated by a thin interstitial tissue of loose connective tissue (LCT). Each ST is lined by several layers of spermatogenic cells as SG, PS and SP with SE cells that rest on the BM. Multiple L cells appear around a small blood vessel (BV) in LCT between the ST. Additionally, sections of G2 as in Figure B reveal that ST are surrounded by a thick BM and separated by a thick, wide LCT of collagen fibres with multiple L cells around a small congested BV and the ST are lined with spermatogenic cells as SG and PS. Also, their lumen has multiple SL. A section from G3 in Figure C reveals boundaries of three ST that are surrounded by a thin BM and separated by a thin LCT with multiple L cells between the ST while each ST is lined by several layers of spermatogenic cells as SG that rest on the BM, PS and SP similar to those of G1. MT × 1000 and the bar = 50 μm.
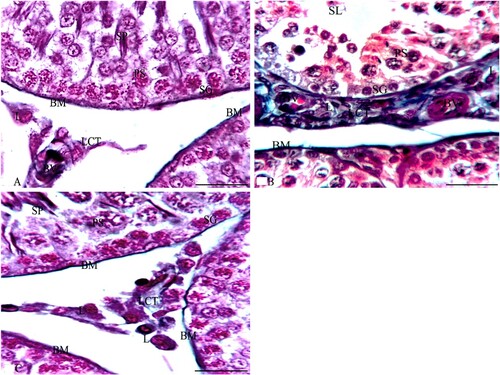
Figure 5. Photomicrographs from rabbit testes that were stained with PAS stain. A section from G1 in Figure A shows the boundaries of three ST that are surrounded by a thin BM and separated by a thin interstitium of LCT. Each ST is lined by several layers of spermatogenic cells, such as SG, PS, and SP with SE cells that rest on the BM. Multiple L cells appear in LCT between the ST. Additionally, sections of G2, as in Figure B, reveal three irregular ST that are surrounded by a thick BM and irregular flat myoid cells (M) and that are separated by a thick, wide LCT with multiple L cells. Meanwhile, the ST are lined with SE and spermatogenic cells such as SG and PS while their lumen has few SP. Furthermore, a section from G3 in Figure C reveals the boundaries of three ST that are surrounded by a thin BM and separated by a thin LCT with multiple L cells between the ST. Meanwhile, each ST is lined by SE and several layers of spermatogenic cells as SG that rest on the BM, PS, and SP that are very similar to those of G1. PAS × 1000 and the bar = 50 μm.
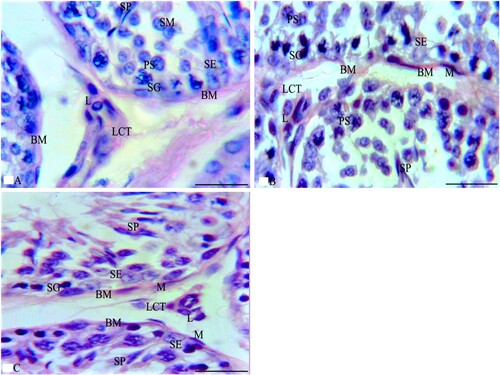
Figure 6. Photomicrographs from rabbit testes that were immunostained by TUNEL assay. A section from G1 in Figure A shows the boundaries of two ST that are separated by a thin LCT with multiple L cells between the ST. The ST rest on the BM and are lined by SE and spermatogenic cells, such as SG, PS, and SP that do not reveal apoptosis. Additionally, a section from G2 in Figure B shows the boundaries of two adjacent ST that are separated by a few L cells between the ST. The ST are lined by spermatogenic cells, such as SG (that rest on BM with M cells) and PS that reveal multiple apoptotic cells (AP). Meanwhile, the section of G3 in Figure C reveals the boundaries of four ST that are separated by a thin LCT. The ST rest on BM and are lined by spermatogenic cells such as SG, PS, and SP that reveal few AP cells. TUNEL assay × 1000 and the bar = 50 μm.
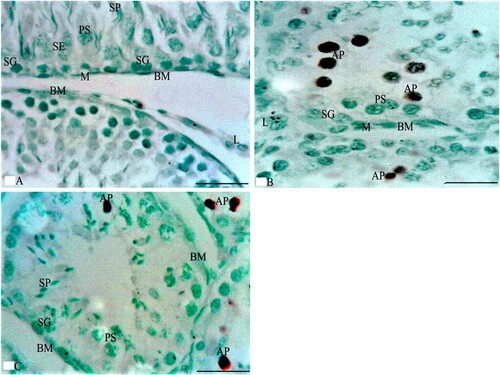
Table 5. Statistical analysis of the morphometrical study of the testes of all groups (size of ST, area % of collagen fibres, and percentage of apoptotic cells in the spermatogenic and Sertoli cells of ST).
Discussion
Male infertility is a huge dilemma that should be solved, as it has become a worldwide problem (Azizi et al. Citation2018). Therefore, increasing attention has being focused on discovering the hidden etiology of male infertility (Xu Citation2006). Recently, a great focus has been directed towards the genes and their polymorphisms that may play a vital role in the scenario of male infertility (Markandona et al. Citation2015; Anifandis et al. Citation2017; Ren et al. Citation2019).
It was noticed that a lack of DNA methylation could prevent sperm maturation in mice (Kelly et al. Citation2003). The increase of the dangerous Hcy plasma level and the decrease of methionine deregulate the expression of spermatogenesis genes due to the lack of methylation (Singh and Jaiswal Citation2013). The MTHFR 677T genotype was more associated with hypomethylation than was the 677C genotype (Stern et al. Citation2000; Friso et al. Citation2002). Our findings support the notion that MTHFR gene C677T (rs1801133) SNP is associated with male infertility and provided insights into how the SNP weakens male fertility.
Several studies have revealed the association of MTHFR polymorphisms including MTHFR C677T SNP with infertile patients (Stuppia et al. Citation2003; Park et al. Citation2005; Singh et al. Citation2005; Dhillon et al. Citation2007; Gava et al. Citation2011; Qiu Citation2011; Pei Citation2013; Kurzawski et al. Citation2015; Karimian and Colagar Citation2016; Hong et al. Citation2017). The findings of the current study are strongly consistent with other previous researches (Liu et al. Citation2015; Yang et al. Citation2016; Ren et al. Citation2017; Ren et al. Citation2019; Shi et al. Citation2019). This study accords with a previous meta-analysis study which reported that the 677C > T polymorphism was significantly associated with the risk of male infertility in Asian population (Ren et al. Citation2019). Also, our findings are consistent with other meta-analysis studies which showed that the MTHFR C677T polymorphism has been linked with increased male infertility risk in the Asian and overall populations (Ren et al. Citation2017; Shi et al. Citation2019). Moreover, the current results are consistent with the previous meta-analysis study which concluded that MTHFR C677T mutation was a risk factor for male infertility in both azoospermia and oligoasthenoteratozoospermia (OAT) patients, especially in Asian population (Liu et al. Citation2015). Our results are in agreement with those results which obtained by Park and his colleagues (Citation2005) who showed that the MTHFR 677TT genotype is a genetic risk factor for male infertility because it was present at a statistically high significance in unexplained infertile men, especially with severe OAT and non-obstructive azoospermia (Park et al. Citation2005). Moreover, this study matches with that observed in earlier study which showed that 677T is clearly a risk factor for infertility in the Indian population (Singh et al. Citation2005) and Brazilian population (Gava et al. Citation2011).
In Contrary to our findings, Ni et al. (Citation2015) reported that the MTHFR C677T SNP is not considered a risk factor for male infertility in Chinese people (Ni et al. Citation2015). Moreover, Li et al. (Citation2014) could not find any evidence of an association of the MTHFR C677T SNP with male infertility (Li et al. Citation2014). In contrast to our results, Stuppia et al. (Citation2003) have reported that MTHFR 677T allele is not associated with an increased risk of male infertility in Italy (Stuppia et al. Citation2003). However, the confliction between our findings and others may probably be due to the gene-nutrient/environmental and the gene-racial/ethnic interactions (Yang et al. Citation2016).
Furthermore, Hcy plasma level was high in the MTHFR 677TT genotype carriers compared with the 677C SNP genotype carriers. This may explain the strong association between Hcy levels and the MTHFR gene C677T SNP with male infertility. Also, the findings of the current study demonstrate a possible therapeutic effect of folic acid on infertility. It shows the capability of folic acid to restore fertility in the adenine-induced infertility of rabbits. In addition, our study showed that the treatment with folic acid reduced the plasma content of Hcy. This finding suggested that one mode of action through which folic acid restored fertility was by decreasing the concentration of plasma Hcy. Therefore, our findings support the notion that disturbance in the folic acid metabolism negatively influence the status of fertility by affecting the process of spermatogenesis (Kelly et al. Citation2005).
Defective folic acid metabolism was shown to affect spermatogenesis by decreasing the process of DNA methylation, thereby deregulating gene expression (Cisneros Citation2004; Swayne et al. Citation2012). It also aggravates chromosomal anomalies and disrupts the system of DNA repair, which permits the disincorporation of uracil during DNA replication (Crider et al. Citation2012). The results of this study could be explained by the assumption that a lack of methionine formation and an increase in Hcy levels may play a role in the formation of free radicals and an increase in Hcy-mediated DNA damage (Huang et al. Citation2000; Hamzeh et al. Citation2019). The increment of toxic reactive oxygen species accompanied by high Hcy levels may cause DNA damage (Singh and Jaiswal Citation2013). Human spermatozoa are predisposed to peroxidative damage and free radicals (Aitken Citation1995). This could be corrected with folic acid, which has anti-oxidative functions and may protect the spermatogenic cells and sperm DNA from the harmful effects of free radicals. Lack of methylation with DNA oxidative stress disruption could play a crucial role in infertility in MTHFR C677I SNP genotype male carriers (Šerý et al. Citation2012).
Conclusions
The novel results of this study support the concept that MTHFR 677 C > T SNP is a genetic risk factor for male infertility. Furthermore, results also showed the effectiveness of folic acid to restore fertility in adenine-induced infertility in male rabbits. Interestingly, the therapeutic potential of folic acid was evident even in the MTHFR 677 C > T SNP genotype carriers. Therefore, the present study gives a rational to evaluate the prognostic significance of MTHFR C677T SNP as risk factor of infertility in human males; and to investigate the potential of folic acid in the therapy of human male infertility. This study is limited by the small sample size; further researches on larger sample size should be conducted to investigate the association of the MTHFR C677T SNP with male infertility and with plasma Hcy levels. In addition, further studies on humans are needed to test the therapeutic role of the folic acid in the MTHFR C677T SNP male carriers.
Acknowledgements
The authors gratefully acknowledge Qassim University, represented by the Deanship of Scientific Research, on the material support for this research under the number [3439-cams1-2018-1-14-S] during the academic year 1440 AH/2018 AD. The authors acknowledge College of Applied Medical Sciences, Qassim University, Saudi Arabia for providing the facilities for the conduct of the study. We thank Mr. Sayed Yousif Osman for helping to conduct the histological study.
Disclosure statement
No potential conflict of interest was reported by the author(s).
Data availability statement
Sharing the data is restricted by the funder of this study, so supporting data is not available.
Additional information
Funding
References
- Aitken RJ. 1995. Free radicals, lipid peroxidation and sperm function. Reprod Fertil Develop. 7:659–668.
- Anawalt BD, Page ST, Matsumoto AM. 2019. Approach to the male with infertility.
- Angeline T, Jeyaraj N, Tsongalis GJ. 2007. MTHFR gene polymorphisms, B-vitamins and hyperhomocystinemia in young and middle-aged acute myocardial infarction patients. Exp Mol Pathol. 82:227–233.
- Anifandis G, Markandona O, Dafopoulos K, Messini C, Tsezou A, Dimitraki M, Georgoulias P, Daponte A, Messinis I. 2017. Embryological results of couples undergoing ICSI-ET treatments with males carrying the single nucleotide polymorphism rs175080 of the MLH3 gene. Int J Mol Sci. 18(2):314.
- Azizi F, Omrani MD, Sadighi Gilani MA, Hosseini J. 2018. The genetic causes of male infertility in Iranian population; a systematic review. Mens Health J. 2(1):1.
- Bailey SW, Ayling JE. 2009. The extremely slow and variable activity of dihydrofolate reductase in human liver and its implications for high folic acid intake. Proc Natl Acad Sci USA. 106:15424–15429.
- Boiti C, Castellini C, Besenfelder U. 2005. Guidelines for the handling of rabbit bucks and semen. World Rabbit Sci. 13:71–91.
- Buffone G, Darlington G. 1985. Isolation of DNA from biological specimens without extraction with phenol. Clin Chem. 31:164–165.
- Cisneros FJ. 2004. DNA methylation and male infertility. Front Biosci. 9:200.
- Crider KS, Yang TP, Berry RJ. 2012. Folate and DNA methylation: a review of molecular mechanisms and the evidence for folate’s role. Adv Nutr. 3:21–38.
- Dhillon VS, Shahid M, Husain SA. 2007. Associations of MTHFR DNMT3b 4977 bp deletion in mtDNA and GSTM1 deletion, and aberrant CpG island hypermethylation of GSTM1 in non-obstructive infertility in Indian men. Basic Sci Reprod Med. 13:213–222.
- Dutta S, Sengupta P. 2018. Rabbits and men: relating their ages. J Basic Clin Physiol Pharmacol. 29(5):427–435.
- Friso S, Choi S-W, Girelli D. 2002. A common mutation in the 5, 10-methylenetetrahydrofolate reductase gene affects genomic DNA methylation through an interaction with folate status. Proc Natl Acad Sci USA. 99:5606–5611.
- Gava MM, de Oliveira Chagas E, Bianco B. 2011. Methylenetetrahydrofolate reductase polymorphisms are related to male infertility in Brazilian men. Genet Test Mol Biomark. 15:153–157.
- Habeeb A, Teama F, Nesseim M. 2008. Evaluation of physical semen characteristics of male rabbits exposed to different climatic conditions and lighting regimes using nuclear techniques. In: Proceedings of the 9 international conference for nuclear sciences and applications, Egypt 2008, p.1239.
- Hamzeh M, Hosseinimehr SJ, Karimpour A. 2019. Cerium oxide nanoparticles protect cyclophosphamide-induced testicular toxicity in mice. Int J Prev Med. 10(1):5.
- Hong HH, Hu Y, Yu XQ, Zhou L, Lv MQ, Sun Y, Ren WJ, Zhou DX. 2017. Associations of C677T polymorphism in methylenetetrahydrofolate reductase (MTHFR) gene with male infertility risk: A meta-analysis. Eur J Obstet Gynecol Reprod Biol. 212:101–109.
- Huang C, Li J, Zheng R. 2000. Hydrogen peroxide-induced apoptosis in human hepatoma cells is mediated by CD95 (APO-1/Fas) receptor/ligand system and may involve activation of wild-type p53. Mol Biol Rep. 27:1–11.
- Huang J, Zhang Y, Zhong H. 2014. Comparison of endoscopic submuscosal implantation vs. surgical intramuscular implantation of VX2 fragments for establishing a rabbit esophageal tumor model for mimicking human esophageal squamous carcinoma. PLoS One. 9(1):e85326.
- Jones RE, Lopez KH. 2013. Human reproductive biology. London: Academic Press.
- Karimian M, Colagar AH. 2016. Association of C677T transition of the human methylenetetrahydrofolate reductase (MTHFR) gene with male infertility. Reprod Fertil Dev. 28(6):785–794.
- Kelly TL, Li E, Trasler JM. 2003. 5-Aza-2′-deoxycytidine induces alterations in murine spermatogenesis and pregnancy outcome. J Androl. 24:822–830.
- Kelly TL, Neaga OR, Schwahn BC. 2005. Infertility in 5, 10-methylenetetrahydrofolate reductase (MTHFR)-deficient male mice is partially alleviated by lifetime dietary betaine supplementation. Biol Reprod. 72:667–677.
- Kim YI, Pogribny IP, Basnakian AG. 1997. Folate deficiency in rats induces DNA strand breaks and hypomethylation within the p53 tumor suppressor gene. Am J Clin Nutr. 65:46–52.
- Kumar J, Das SK, Sharma P. 2005. Homocysteine levels are associated with MTHFR A1298C polymorphism in Indian population. J Hum Genet. 50:655–663.
- Kurzawski M, Wajda A, Malinowski D, Kazienko A, Kurzawa R, Drozdzik M. 2015. Association study of folate-related enzymes (MTHFR, MTR, MTRR) genetic variants with non-obstructive male infertility in a Polish population. Genet Mol Biol. 38(1):42–47.
- Li S, Li J, Xiao Z. 2014. Prospective study of MTHFR genetic polymorphisms as a possible etiology of male infertility. Genet Mol Res. 13:6367–6374.
- Liu K, Zhao R, Shen M. 2015. Role of genetic mutations in folate-related enzyme genes on male infertility. Sci Rep. 5:1–13.
- Lunenfeld B, Van Steirteghem A. 2004. Infertility in the third millennium: implications for the individual, family and society: condensed meeting report from the Bertarelli Foundation’s second global conference. Hum Reprod Update. 10:317–326.
- Markandona O, Dafopoulos K, Anifandis G. 2015. Single-nucleotide polymorphism rs 175080 in the MLH3 gene and its relation to male infertility. J Assist Reprod Genet. 32(12):1795–1799.
- Mousa AM, El-Mahalaway AM, El-Desoky RE. 2018. The protective effects of sodium hyaluronate on corneal injuries induced by chlorinated water in adult male rabbits: A histological and immunohistochemical study. Egypt J Histol. 41:140–149.
- Naughton CK, Nelson DR, Thomas JR AJ. 2003. Development of an inexpensive artificial vagina for semen collection from rabbits. J Androl. 24:712–715.
- Ni W, Li H, Wu A. 2015. Lack of association between genetic polymorphisms in three folate-related enzyme genes and male infertility in the Chinese population. J Assist Reprod Genet. 32:369–374.
- Park JH, Lee HC, Jeong Y-M. 2005. MTHFR c677t polymorphism associates with unexplained infertile male factors. J Assist Reprod Genet. 22:361–368.
- Pei J. 2013. Association between MTHFR C677T Polymorphism and Male Infertility in Han Population of He Nan China. China Hlth Care Nutr. 2(7):629–630.
- Poduri A, Mukherjee D, Sud K. 2008. MTHFR a1298c polymorphism is associated with cardiovascular risk in end stage renal disease in North Indians. Mol Cell Biochem. 308:43–50.
- Qiu XF. 2011. Association between methyienterahydrofolate reductase gene C677 T polymorphism and male infertility with azoospermia or severe oligozoospermia and asthenospermia in Ningxia Han population. J Ningxia Med Univ. 33(7):625–628.
- Rahiminia T, Farashahi Yazd E, Ghasemi-Esmailabad S, Talebi AR. 2019. Relation between sperm protamine transcripts with global sperm DNA methylation and sperm DNA methyltransferases mRNA in men with severe sperm abnormalities. Hum Fertil. 24(2):1–7.
- Ren Z, Ren P, Yang B, Fang K, Ren S, Liao J, Liu S, Liu L, Peng Z, Dong Q. 2017. MTHFR c677t, A1298C and MS A2756G gene polymorphisms and male infertility risk in a Chinese population: a meta-analysis. PLoS One. 12(1):e0169789.
- Ren ZJ, Zhang YP, Ren PW, Yang B, Deng S, Peng ZF, Liu LR, Wei W, Dong Q. 2019. Contribution of MTR A2756G polymorphism and MTRR A66G polymorphism to the risk of idiopathic male infertility. Medicine. 98(51):e18273.
- Safaa H, Vicente J, Lavara R. 2008. Semen evaluation of two selected lines of rabbit bucks. World Rabbit Sci. 16(3):141–148.
- Sanati E, Nikmanesh M. 2008. Comparative study of the effects of gentamicin, neomycin, streptomycin and ofloxacin antibiotics on sperm parameters and testis apoptosis in rats. Pak J Biol Sci. 11:1683–1689.
- Šerý O, Šrámková T, Klempová J. 2012. The relationship between the C677T polymorphism of the MTHFR gene and serum levels of luteinizing hormone in males with erectile dysfunction. Neuroendocrinol Lett. 33(5):499–504.
- Shi TL, Wu Y, Li Y, Chen ZF, Ma YN, Zhang ZT, Zhang YH, Zhang L. 2019. The relevance of MTHFR C677T, A1298C, and MTRR A66G polymorphisms with response to male infertility in Asians: a meta-analysis. Medicine. 98(8):e14283.
- Singh K, Jaiswal K. 2013. One-carbon metabolism, spermatogenesis, and male infertility. Reprod Sci. 20:622–630.
- Singh K, Singh S, Sah R. 2005. Mutation C677T in the methylenetetrahydrofolate reductase gene is associated with male infertility in an Indian population 1. Int J Androl. 28:115–119.
- Skakkebaek NE, Rajpert-De Meyts E, Buck Louis GM. 2016. Male reproductive disorders and fertility trends: influences of environment and genetic susceptibility. Physiol Rev. 96(1):55–97.
- Stern LL, Mason JB, Selhub J. 2000. Genomic DNA hypomethylation, a characteristic of most cancers, is present in peripheral leukocytes of individuals who are homozygous for the C677T polymorphism in the methylenetetrahydrofolate reductase gene. Cancer Epidemiol Preven Biomark. 9:849–853.
- Stuppia L, Gatta V, Scarciolla O. 2003. The methylenetethrahydrofolate reductase (MTHFR) C677T polymorphism and male infertility in Italy. J Endocrinol Invest. 26:620–622.
- Suvarna S, Layton C, Bancroft J. 2019. Bancroft’s theory and practice of histological techniques. Amsterdam: Elsevier.
- Swayne BG, Kawata A, Behan NA. 2012. Investigating the effects of dietary folic acid on sperm count, DNA damage and mutation in Balb/c mice. Mutat Res. 737:1–7.
- Wernimont SM, Clark AG, Stover PJ. 2011. Folate network genetic variation, plasma homocysteine, and global genomic methylation content: a genetic association study. BMC Med Genet. 12:150.
- Xu J. 2006. The principles of clinical cytogenetics, second edition. Edited by S.L. Gersen and M.B. Keagle. Humana Press, Totowa, NJ, 2005, 596p. Am J Med Genet Part A. 140A:797–797.
- Yang Y, Luo Y, Wu S. 2016. Association between C677T and A1298C polymorphisms of the MTHFR gene and risk of male infertility: a meta-analysis. Genet Mol Res. 10(15):4238.