
Abstract
Brucella abortus is highly contagious and can result in abortion or infertility in animals. This study investigated the mechanism of B. abortus-induced mucosal immunity at different points after infection in a mouse model. GSE125765 was obtained from the Gene Expression Omnibus database. Differentially expressed genes (DEGs) in nasal-associated lymphoid tissues at 1, 6, and 12 h after intranasal immunization, compared with control samples, were screened. Functional enrichment analysis was performed using the DAVID tool. Gene modules associated with the sample phenotype were then explored using WGCNA. Mfuzz was used to analyze the expression pattern trends of DEGs. The KEGG pathway directly related to B. abortus infection was searched based on the Comparative Toxicogenomics Database 2019 update. Three gene modules, 172, 366, and 167 DEGs aggregated into four expression patterns, were significantly positively correlated with B. abortus infection. The expression of DEGs in cluster 1 first increased and then decreased with prolonged infection. DEG expression in clusters 2–4 continued to rise with prolonged infection. Genes related to B. abortus infection were significantly enriched in ‘lysosome’ in the Comparative Toxicogenomics Database, including genes CTSL, CD68, SCARB2, and CTSS, which might be necessary for modulating host–B. abortus interactions through the ‘lysosome’ pathway.
Introduction
Brucellosis caused by the genus Brucella (the most common species being B. melitensis, B. abortus, and B. suis) is a highly contagious bacterial zoonotic disease, affecting both public health and animal production (McDermott et al. Citation2013), that can result in abortion or infertility in animals (Ducrotoy et al. Citation2014). Moreover, brucellosis can spread to humans, leading to permanent sequelae, and is fatal in 1%–5% cases. Brucella infection in humans is typically characterized by undulant fever. The chronic phase is mainly accompanied by localized hyperplasia of infectious granulomatous tissues. The granulomas can be located in the vertebral body or in the subchondral vertebral body adjacent to the intervertebral disc, which is more common in the lumbar and thoracic spine (Franco et al. Citation2007). Thus, patients often visit orthopedics for back pain. Brucella infects approximately 500,000 humans worldwide annually, and the incidence of the disease is increasing in China, especially for farmers and workers associated with the meat industry (Li et al. Citation2019; Liu et al. Citation2019). Hence, it is crucial to clarify the pathogenesis and host immunity of Brucella.
The expansion of genomics, next-generation seq-uencing, omics technologies, and bioinformatics has enabled in-depth analyses of the pathogenesis of brucellosis. High-throughput technologies have been used to determine many genes associated with Brucella virulence or host specificity. Rossetti et al. analyzed the early transcriptome of monocyte-derived macrophages infected with Brucella from cattle naturally resistant or susceptible to brucellosis using cDNA microarray technology (Rossetti et al. Citation2009). Tian et al. identified 14 genes necessary for the intracellular survival of B. abortus using microarray analysis (Tian et al. Citation2013). Many genes associated with the virulence of B. abortus have been reported, such as bab_RS22045 (Tian et al. Citation2019a), pyruvate carboxylase gene (Tian et al. Citation2019b), Omp31, and Omp22 (Vishnu et al. Citation2017). Moreover, Hisham et al. showed many potential protective antigens for vaccine design against brucellosis (Hisham and Ashhab Citation2018). Covert et al. demonstrated that after 4 h of infection, distinctive defense transcriptional responses of macrophages can be introduced by the pathogen (Covert et al. Citation2009). Shim et al. discovered that B. abortus Mdh-loaded chitosan nanoparticles activate the interleukin (IL)-6 and HMGB1 signaling pathways, leading to dendritic cell maturation in upper respiratory tract, and dramatically enhanced the production of antigen-specific IgA and IgG (Shim et al. Citation2020). Although the pathogenicity and immunity of Brucella have been widely discussed, it remains unclear whether Brucella interacts with the elements of mucosal immunity.
Bioinformatics is an important tool for constructing a network of host specificities and virulence analysis using comparative genomic analyses. Thus, we explored the mucosal immune mechanism triggered by B. abortus infection by comparing the transcriptome expression levels of mouse nasal-associated lymphoid tissue (NALT) at different times after B. abortus infection and control samples.
Material and methods
Data preprocessing and RNA annotation
The GSE125765 dataset (Shim et al. Citation2020) was downloaded from the NCBI Gene Expression Omnibus (GEO, https://www.ncbi.nlm.nih.gov/) (Barrett et al. Citation2007). Data from NALTs at 1, 6, and 12 h after intranasal immunization and normal samples were extracted. At each time point, two B. abortus infection samples and two control samples were analyzed. These data were generated on the platform of Illumina HiSeq2500 (Mus musculus) sequencing platform.
Screening and functional enrichment analysis of differentially expressed genes (DEGs)
DEGs between NALTs at 1, 6, and 12 h after intranasal immunization and normal samples were screened using the limma package version 3.34.0, (https://bioco-nductor.org/packages/release/bioc/html/limma.html) in R 3.4.1 software (Ritchie et al. Citation2015). False discovery rate (FDR) < 0.05 and |log2 fold change (FC)| > 0.5 were used as thresholds to define DEGs. Two-way hierarchical clustering based on Euclidean distance was then performed on the expression levels of DEGs using pheatmap version 1.0.8 (https://cran.r-project.org/package=pheatmap) in R 3.4.1 (Wang et al. Citation2014; Bien and Tibshirani Citation2011; Opara et al. Citation2010), and a heatmap was constructed to reveal the hierarchical cluster structure in the data matrix obtained from B. abortus infection samples and control samples.
Biological processes enriched using DEGs and Kyoto Encyclopedia of Genes and Genomes (KEGG) functional enrichment analysis were obtained with the database for annotation, visualization and integrated discovery (DAVID) tool (version 6.8, https://david-d.ncifcrf.gov/) using a hypergeometric algorithm (Huang da et al. Citation2009a, Citation2009b). An FDR < 0.05 was defined as the screening threshold.
Weighed gene co-expression network analysis
Three sets of DEGs were screened separately at three time points. The union DEGs of the three gene sets were further analyzed.
Weighed gene co-expression network analysis(WGCNA) is a bioinformatics algorithm for constructing co-expression networks and exploring gene modules related to diseases (Oldham et al. Citation2008). For DEGs obtained in the previous step, WGCNA package version 1.61 (https://cran.r-project.org/web/packages/WGCNA/index.html) in R 3.4.1 language was used to filter the related gene module associated with the sample phenotype (sample type and different time points) (Langfelder and Horvath Citation2008). First, the soft threshold of network construction was selected. Then, average link hierarchical clustering was performed on topological overlap, and the clustering tree was chopped using the dynamic hybrid tree cut algorithm. To obtain large and different modules, the minimum module size was set to 100 genes, and the Height was cut to 0.995. Finally, the correlation between the sample characterization (sample type and different time points) and each module was calculated.
Mfuzz clustering algorithm screening for DEG sets with similar expression patterns
The R package Mfuzz is a soft clustering of gene expression data stratified by time series (Kumar and Futschik Citation2007). DEGs were processed using Mfuzz version 2.42.0 (http://www.bioconductor.org/packa-ges/release/bioc/html/Mfuzz. Html) to determine the trend in the expression patterns of DEGs.
Construction of the interaction network
The STRING database is a tool for predicting functional associations between proteins (Szklarczyk et al. Citation2017), and Cytoscape is a useful bioinformatics package for visualization and data integration in biological networks (Shannon et al. Citation2003). The interaction between proteins encoded by targets was explored using the STRING database (version: 10.0, http://string-db.org/), and the interaction network was visualized using Cytoscape version 3.6.1 [14] (http://www.cytoscape.org/). Finally, KEGG pathway annotation analysis of the DEG network was performed using DAVID.
Pathway network directly related to Brucella abortus infection
The Comparative Toxicogenomics Database (CTD; http://ctdbase.org/) provides a resource for exploring the associations between chemicals, gene products, phenotypes, diseases, and environmental exposures (Davis et al. Citation2019). The KEGG pathways directly related to B. abortus infection were explored using the CTD 2019 updated (http://ctd.mdibl.org/) database with ‘Brucella’ as a keyword. Then, to obtain KEGG pathways of DEGs in humans infected with Brucella, KEGG pathways related to B. abortus infection were compared with those enriched by DEGs. Finally, a network of KEGG signaling pathways related to B. abortus infection was constructed, and important genes related to B. abortus infection were identified.
Results
Data process and functional enrichment associated with DEGs
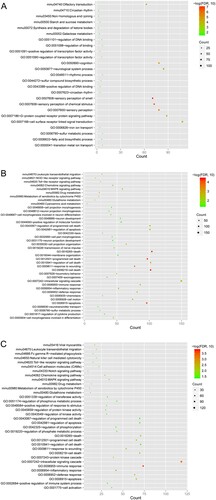
A volcano plot of DEGs between the B. abortus infection and control groups is shown in Figure . In total, 798, 2810, and 1909 DEGs were screened at 1, 6, and 12 h after B. abortus infection, respectively, and compared to the control group. DEGs screened at the three time points were further analyzed, and 4181 genes in unions were obtained (Figure ). Biological processes of GO and pathways of KEGG functional enrichment analyses were obtained for common DEGs. According to the threshold, 19, 31, and 22 biological processes were enriched by DEGs at 1, 6, and 12 h after B. abortus infection, respectively, compared with the control group, including GO:0007608, sensory perception of smell; GO:0008219, cell death; and GO:0006955, immune response. Meanwhile, DEGs at 1, 6, and 12 h after B. abortus infection were significantly enriched in 6, 9, and 12 KEGG pathways, including mmu04740, olfactory transduction; mmu04062, chemokine signaling pathway; and mmu00480, glutathione metabolism (Figure ).
Figure 1. Volcano map of the results of differentially expressed genes (DEGs). DEGs between 1 h (A), 6 h (B), and 12 h (C) after Brucella abortus infection and the control group. Blue dots represent DEGs, and black horizontal dashed lines indicate a false discovery rate <0.05, and the two black vertical dashed lines represent |log2 fold change| >0.5.
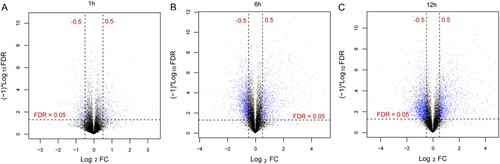
Figure 2. The Venn diagram compares differentially expressed genes at 1, 6, and 12 h after Brucella abortus infection.
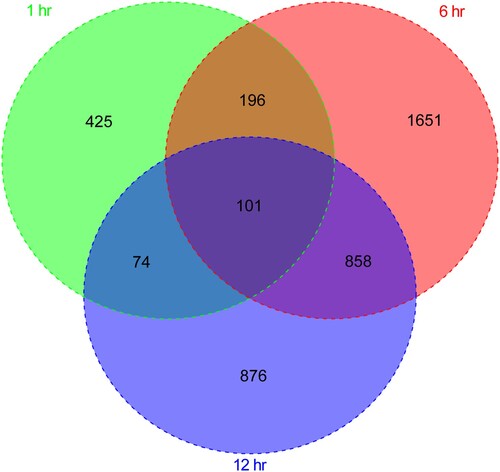
Figure 3. Biological processes and Kyoto Encyclopedia of Genes and Genomes (KEGG) pathway enrichment of DEGs at 1 h (A), 6 h (B), and 12 h (C) after Brucella abortus infection. The horizontal axis represents the number of genes; the vertical axis represents the name of the item; the size of the dot represents the number of genes; the color of the dot represents -log10 (false discovery rate). The dot with a larger size and closer to the red color suggests a greater significance of function enrichment.
Gene modules associated with disease characterization
As shown in Figure A, the value of the power equaled 22 when the squared value of the correlation coefficient reached 0.9 for the first time. The average node connectivity of the co-expression network was 1, which fully conformed to the small-world network property. Then, the coefficient of dissimilarity between gene points was calculated, and a systematic clustering tree was obtained.
Figure 4. (A) Clustering of samples and determination of soft-thresholding power. Left: Adjacency matrix weight parameter power selection graph. The horizontal axis represents the weight parameter power, and the vertical axis represents the squares of the log(k) and log(p(k)) correlation coefficients in the corresponding network. The red line indicates the standard line, where the square of the correlation coefficient reaches 0.8. Right: Schematic diagram of the average connectivity of RNA under different power parameters. The red line indicates the value of the average connectivity of the network nodes under the value of the power parameter of the adjacency matrix (McDermott et al. Citation2013). In all, 22 was the most fit power value; (B) Tree diagram of module partitioning, and each color represents a different module. Branches of the cluster dendrogram of the most connected genes gave rise to 11 gene co-expression modules. Genes that could not be clustered into one of these modules were assigned to the gray module. The distance between two genes is shown as the height on the y-axis. (C) Heat map of the correlation between modules and sample characterization. The number above each cell represents the correlation between the module and the sample characterization, and the number below each cell represents the corresponding P-value. Red represents positive correlation, and blue represents negative correlation.
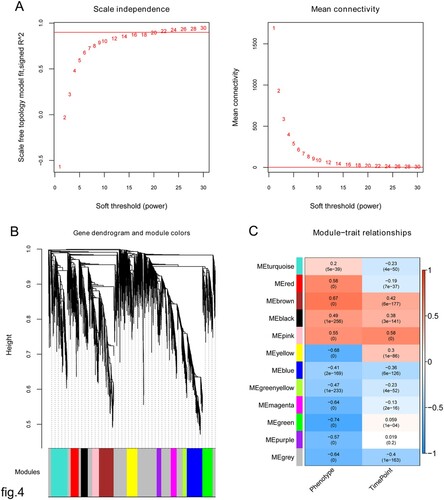
As shown in Figure B, a total of 11 modules, except gray, were obtained. Figure C shows that three gene modules were significantly positively correlated with the sample type and time point state, including black, brown, and pink modules, and these modules contained 172, 366, and 167 DEGs, respectively. Finally, 705 genes were used for further analyses.
DEGs with the same expression pattern
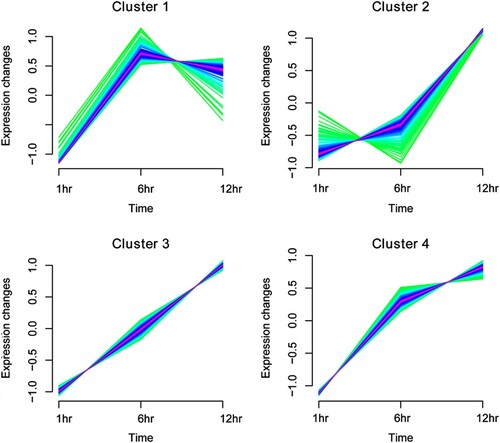
The expression pattern change trend analysis of 705 genes was performed to observe the trend of differential gene expression during the infection time (Figure ). The results showed that the target genes could be aggregated into four expression patterns, and the expression of 101 DEGs in cluster 1 first increased and then decreased with prolonged infection time. In cluster 2 (including 156 DEGs), cluster 3 (including 263 DEGs), and cluster 4 (including 185 DEGs), the expression levels of DEGs continued to increase with the prolonged infection time (Table S1).
Figure 5. Expression pattern clustering map based on Mfuzz algorithm for differentially expressed genes (DEGs). Mfuzz clustering illustrating the patterns of dynamic changes in the expression of DEGs during the infection time.
Construction of an interaction network
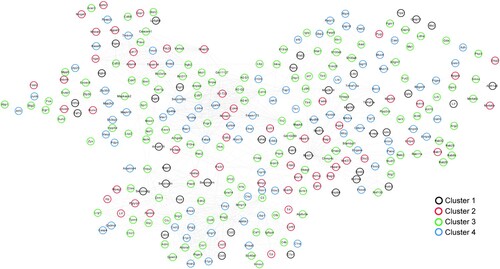
The protein–protein interaction network is shown in Figure , and 1091 pairs of protein–protein interactions were obtained. The results showed that the network contained 303 gene nodes and 1091 interaction edges.
Figure 6. Network of protein-protein interactions. Black, red, green, and blue circles represent genes in cluster 1, cluster 2, cluster 3, and cluster 4, respectively.
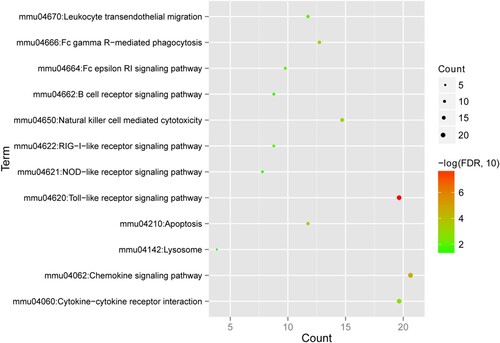
The KEGG signaling pathways were then enriched and analyzed, and 12 KEGG pathways were screened (Figure ). The results showed that the genes were significantly enriched in pathways such as the toll-like receptor signaling, chemokine signaling, and lysosome pathways.
Figure 7. Kyoto Encyclopedia of Genes and Genomes (KEGG) pathways associated with enriched differentially expressed genes. The horizontal axis represents the number of genes; the vertical axis represents the name of the item; the size of the dot indicates the number of genes; and the color of the dot indicates -log10 (false discovery rate). The dot with a larger size and closer to the red color suggests a greater significance of function enrichment.
Network of pathways directly related to B. abortus infection
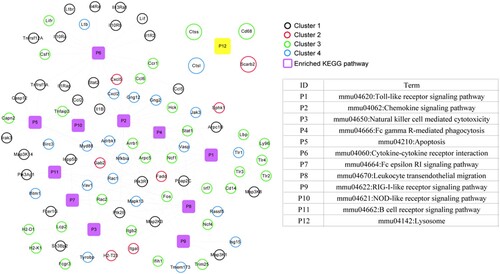
Figure shows that genes related to B. abortus infection were significantly enriched in lysosomes in the CTD database. Compared with the previously enriched KEGG signaling pathways associated with DEGs, the lysosome pathway was the only overlapping pathway. The pathway included four genes, CTSL, CD68, SCARB2, and CTSS, suggesting that these four genes are related directly to the pathways of B. abortus infection.
Figure 8. Kyoto Encyclopedia of Genes and Genomes (KEGG) pathway network of Brucella abortus infection. Black, red, green, and blue circles represent genes in cluster 1, cluster 2, cluster 3, and cluster 4, respectively. Purple squares represent significantly enriched KEGG pathways, and yellow squares are directly related KEGG pathways after B. abortus infection.
Discussion
The immunogenicity and protective efficacy of B. abortus remain unclear, and we aimed to clarify the mucosal immune mechanism triggered by B. abortus infection using bioinformatics. In total, three gene modules, 172, 366, and 167 DEGs, were significantly positively correlated with the phenotype of the sample. The target genes could be aggregated into four expression patterns, and expression of the DEGs in cluster 1 increased first and then decreased with prolonged infection time. The expression levels of DEGs continued to rise with prolonged infection time in clusters 2–4. Genes related to B. abortus infection were significantly enriched in lysosomes in the CTD database, including genes CTSL, CD68, SCARB2, and CTSS.
Our data showed that DEGs in the protein–protein interaction network were significantly enriched in pathways such as the toll-like receptor (TLR) signaling pathway and the chemokine signaling pathway. It is widely known that TLRs are essential in innate immune response activation (Kopp and Medzhitov Citation1999). Once infected, the bacterial cell wall components can be recognized by dendritic cells via TLRs, including TLR2, TLR4, and TLR9 (Medzhitov and Janeway Citation1997). Furthermore, Girish et al. demonstrated that the TIR domain-containing protein encoded by Brucella inhibits NF-κB activation via TLR2 and TLR4 (Radhakrishnan et al. Citation2009). The critical roles of various chemokines have also been revealed in protection against brucellosis, such as IFN-gamma, IL-2, IL-18, and MIP1-alpha (Paranavitana et al. Citation2005). Here, we confirmed the important roles of the TLR and chemokine signaling pathways in the protection against B. abortus infection. Moreover, in our study, DEGs at 1, 6, and 12 h after B. abortus infection were significantly enriched in biological processes such as sensory perception of smell, cell death, and immune response. Previous evidence has shown the process of cell death and immune response during Brucella infection (Gross et al. Citation2000; Baldwin and Parent Citation2002). Our data revealed that sensory perception of smell is affected during the first 1 h after B. abortus infection, and potential functions associated with sensory perception should be further researched.
Traditionally, lysosomes play a role in breaking down foreign substances and digesting the local cytoplasm. The endosomal/lysosomal compartment was the necessary transport for the replication of Brucella. To avoid fusion with late endosomes and lysosomes, Brucella localizes in early phagosomes once the pathogen breaks into cells (Gorvel and Moreno Citation2002). The lipopolysaccharide O antigen plays a role in inhibiting phagosome-lysosome fusion in murine macrophages (Starr et al. Citation2008). In this study, we demonstrated that lysosomes were the enriched pathway related to B. abortus infection and DEGs from NALTs after intranasal immunization. Although no study has been conducted on the role of lysosomes in host immunity triggered by B. abortus, we suggest that lysosomes might protect the host against direct contact with B. abortus by inhibiting pathogen replication.
Genes such as CTSL, CD68, SCARB2, and CTSS were all included in the lysosome pathway. Until now, evidence has not shown the association between these genes and Brucella infection. As a hydrolytic enzyme, CTSL is related to the inhibition of Brucella infection. Likewise, CTSS, as a type of cathepsin, interacts and contributes to killing intracellular Mycobacterium tuberculosis (Rivera-Marrero et al. Citation2004; Pires et al. Citation2016). CD68 is a lysosomal glycoprotein and a marker of macrophages (Holness and Simmons Citation1993). Among orally infected children, Brucella is mainly detected in cells expressing CD68 and low levels of CD11c (von Bargen et al. Citation2014). SCARB2 is a lysosomal membrane glycoprotein that plays an important role in the transportation of β-glucocerebrosidase to the lysosome, infection with EV71, and load-induced cardiac myocyte hypertrophy (Dang et al. Citation2014). Although no clinical data have been published on correlations between genes, including CTSL, CD68, SCARB2, and CTSS, and the immunogenicity and protective efficacy of Brucella, these genes might be essential mediators of local inflammatory responses produced by the lysosome pathway.
In conclusion, our data confirmed the crucial roles of TLRs and the chemokine signaling pathway in the protection against B. abortus infection. Co-expression associations in our study showed the protective role of lysosomes in NALTs triggered by B. abortus infection, and genes including CTSL, CD68, SCARB2, and CTSS may be important mediators of local inflammatory responses produced by the lysosome pathway. Furthermore, the potential functions of these genes should be further studied to better understand the potential functions introduced by the genes in the host.
Declaration of interest
The authors declare that they have no competing interests.
Acknowledgments
None.
Disclosure statement
No potential conflict of interest was reported by the author(s).
Data availability statement
The data that support the findings of this study are available in NCBI Gene Expression Omnibus at https://www.ncbi.nlm.nih.gov/, reference number GSE125765.
Additional information
Funding
References
- Baldwin CL, Parent M. 2002. Fundamentals of host immune response against Brucella abortus: what the mouse model has revealed about control of infection. Vet Microbiol. 90(1-4):367–382.
- Barrett T, Troup DB, Wilhite SE, Ledoux P, Rudnev D, Evangelista C, Kim IF, Soboleva A, Tomashevsky M, Edgar R. 2007. NCBI GEO: mining tens of millions of expression profiles–database and tools update. Nucleic Acids Res. 35(Database issue):D760–D765.
- Bien J, Tibshirani R. 2011. Hierarchical clustering with prototypes via minimax linkage. J Am Stat Assoc. 106(495):1075–1084.
- Covert J, Mathison AJ, Eskra L, Banai M, Splitter G. 2009. Brucella melitensis, B. neotomae and B. ovis elicit common and distinctive macrophage defense transcriptional responses. Exp Biol Med (Maywood. 234(12):1450–1467.
- Dang M, Wang X, Wang Q, Wang Y, Lin J, Sun Y, Li X, Zhang L, Lou Z, Wang J, et al. 2014. Molecular mechanism of SCARB2-mediated attachment and uncoating of EV71. Protein Cell. 5(9):692–703.
- Davis AP, Grondin CJ, Johnson RJ, Sciaky D, McMorran R, Wiegers J, Wiegers TC, Mattingly CJ. 2019. The Comparative toxicogenomics database: update 2019. Nucleic Acids Res. 47(D1):D948–DD54.
- Ducrotoy MJ, Bertu WJ, Ocholi RA, Gusi AM, Bryssinckx W, Welburn S, Moriyon I. 2014. Brucellosis as an emerging threat in developing economies: lessons from Nigeria. PLoS Negl Trop Dis. 8(7):e3008.
- Franco MP, Mulder M, Gilman RH, Smits HL. 2007. Human brucellosis. Lancet Infect Dis. 7(12):775–786.
- Gorvel JP, Moreno E. 2002. Brucella intracellular life: from invasion to intracellular replication. Vet Microbiol. 90(1-4):281–297.
- Gross A, Terraza A, Ouahrani-Bettache S, Liautard JP, Dornand J. 2000. In vitro Brucella suis infection prevents the programmed cell death of human monocytic cells. Infect Immun. 68(1):342–351.
- Hisham Y, Ashhab Y. 2018. Identification of cross-protective potential antigens against pathogenic Brucella spp. through combining pan-genome analysis with reverse vaccinology.J Immunol Res. 2018:1–15.
- Holness CL, Simmons DL. 1993. Molecular cloning of CD68, a human macrophage marker related to lysosomal glycoproteins. Blood. 81(6):1607–1613.
- Huang da W, Sherman BT, Lempicki RA. 2009a. Bioinformatics enrichment tools: paths toward the comprehensive functional analysis of large gene lists. Nucleic Acids Res. 37(1):1–13.
- Huang da W, Sherman BT, Lempicki RA. 2009b. Systematic and integrative analysis of large gene lists using DAVID bioinformatics resources. Nat Protoc. 4(1):44–57.
- Kopp EB, Medzhitov R. 1999. The Toll-receptor family and control of innate immunity. Curr Opin Immunol. 11(1):13–18.
- Kumar L, Futschik ME. 2007. Mfuzz: a software package for soft clustering of microarray data. Bioinformation. 2(1):5–7.
- Langfelder P, Horvath S. 2008. WGCNA: an R package for weighted correlation network analysis. BMC Bioinformatics. 9:559.
- Li K, Zhang L, Shahzad M, Mehmood K, Li J. 2019. Increasing incidence and changing epidemiology of brucellosis in China (2004-2016). Travel Med Infect Dis. 35:101464.
- Liu ZG, Wang M, Zhan ZF, Cui BY, Li ZJ. 2019. [Epidemiology of human brucellosis and source of Brucella isolates in Hunan province]. Zhonghua Liu Xing Bing Xue Za Zhi. 40(9):1150–1154.
- McDermott J, Grace D, Zinsstag J. 2013. Economics of brucellosis impact and control in low-income countries. Rev Sci Tech. 32(1):249–261.
- Medzhitov R, Janeway CA Jr. 1997. Innate immunity: the virtues of a nonclonal system of recognition. Cell. 91(3):295–298.
- Oldham MC, Konopka G, Iwamoto K, Langfelder P, Kato T, Horvath S, Geschwind DH. 2008. Functional organization of the transcriptome in human brain. Nat Neurosci. 11(11):1271–1282.
- Opara UL, Jacobson D, Al-Saady NA. 2010. Analysis of genetic diversity in banana cultivars (Musa cvs.) from the South of Oman using AFLP markers and classification by phylogenetic, hierarchical clustering and principal component analyses. J Zhejiang Univ Sci B. 11(5):332–341.
- Paranavitana C, Zelazowska E, Izadjoo M, Hoover D. 2005. Interferon-gamma associated cytokines and chemokines produced by spleen cells from Brucella-immune mice. Cytokine. 30(2):86–92.
- Pires D, Marques J, Pombo JP, Carmo N, Bettencourt P, Neyrolles O, Lugo-Villarino G, Anes E. 2016. Role of cathepsins in mycobacterium tuberculosis survival in human macrophages. Sci Rep. 6:32247.
- Radhakrishnan GK, Yu Q, Harms JS, Splitter GA. 2009. Brucella TIR domain-containing protein mimics properties of the toll-like receptor adaptor protein TIRAP. J Biol Chem. 284(15):9892–9898.
- Ritchie ME, Phipson B, Wu D, Hu Y, Law CW, Shi W, Smyth GK. 2015. Limma powers differential expression analyses for RNA-sequencing and microarray studies. Nucleic Acids Res. 43(7):e47.
- Rivera-Marrero CA, Stewart J, Shafer WM, Roman J. 2004. The down-regulation of cathepsin G in THP-1 monocytes after infection with Mycobacterium tuberculosis is associated with increased intracellular survival of bacilli. Infect Immun. 72(10):5712–5721.
- Rossetti CA, Galindo CL, Lawhon SD, Garner HR, Adams LG. 2009. Brucella melitensis global gene expression study provides novel information on growth phase-specific gene regulation with potential insights for understanding Brucella:host initial interactions. BMC Microbiol. 9:81.
- Shannon P, Markiel A, Ozier O, Baliga NS, Wang JT, Ramage D, et al. 2003. Cytoscape: a software environment for integrated models of biomolecular interaction networks. Genome Res. 13(11):2498–2504.
- Shim S, Soh SH, Im YB, Ahn C, Park HT, Park HE, Park WB, Kim S, Yoo HS. 2020. Induction of systemic immunity through nasal-associated lymphoid tissue (NALT) of mice intranasally immunized with Brucella abortus malate dehydrogenase-loaded chitosan nanoparticles. PloS one. 15(2):e0228463.
- Starr T, Ng TW, Wehrly TD, Knodler LA, Celli J. 2008. Brucella intracellular replication requires trafficking through the late endosomal/lysosomal compartment. Traffic. 9(5):678–694.
- Szklarczyk D, Morris JH, Cook H, Kuhn M, Wyder S, Simonovic M, Santos A, Doncheva NT, Roth A, Bork P, et al. 2017. The STRING database in 2017: quality-controlled protein-protein association networks, made broadly accessible. Nucleic Acids Res. 45(D1):D362–D3D8.
- Tian M, Lian Z, Bao Y, Bao S, Yin Y, Li P, Ding C, Wang S, Li T, Qi J, et al. 2019a. Identification of a novel, small, conserved hypothetical protein involved in Brucella abortus virulence by modifying the expression of multiple genes. Transbound Emerg Dis. 66(1):349–362.
- Tian M, Qu J, Han X, Zhang M, Ding C, Ding J, Chen G, Yu S. 2013. Microarray-based identification of differentially expressed genes in intracellular Brucella abortus within RAW264.7 cells. PloS one. 8(8):e67014.
- Tian M, Qu J, Li P, Bao Y, Liu J, Ding C, Wang S, Li T, Qi J, Yu S. 2019b. Identification of novel genes essential for Brucella abortus to establish infection by signature-tagged mutagenesis. Vet Microbiol. 230:130–137.
- Vishnu US, Sankarasubramanian J, Gunasekaran P, Rajendhran J. 2017. Identification of potential antigens from non-classically secreted proteins and designing novel multitope peptide vaccine candidate against Brucella melitensis through reverse vaccinology and immunoinformatics approach. Infect Genet Evol. 55:151–158.
- von Bargen K, Gagnaire A, Arce-Gorvel V, de Bovis B, Baudimont F, Chasson L, Bosilkovski M, Papadopoulos A, Martirosyan A, Henri S, et al. 2014. Cervical lymph nodes as a selective niche for Brucella during oral infections. PloS one. 10(4):e0121790.
- Wang L, Cao C, Ma Q, Zeng Q, Wang H, Cheng Z, Zhu G, Qi J, Ma H, Nian H, et al. 2014. RNA-seq analyses of multiple meristems of soybean: novel and alternative transcripts, evolutionary and functional implications. BMC Plant Biol. 14:169.