
 ?Mathematical formulae have been encoded as MathML and are displayed in this HTML version using MathJax in order to improve their display. Uncheck the box to turn MathJax off. This feature requires Javascript. Click on a formula to zoom.
Abstract
A key trait impacting the maturity of qingke is the heading date. Identification of major stable quantitative trait loci (QTL) for heading date trait is important for maturity improvement in qingke. Therefore, we conducted QTL mapping of an F2 population of 146 lines and constructed a high-density linkage map with 1,243 recombination bin markers. After phenotyping the F2:3 across three environments to detect QTL for heading date. The results showed that three QTLs that play a major role in heading date were identified, cqHD2H-1 and cqHD2H-2 were identified across two environments and considered environmentally stable. The cqHD2H-2, reflects a stable early-heading locus, explaining 27.50% of the phenotypic variance. Mapping of the cqHD2H-2 was subsequently conducted in extremely heading individuals from F5 populations, the cqHD2H-2 was further delimited to a region of approximately 84 Mb on 2H, and the HORVU2Hr1G087460 gene was identified as a homologue of the rice DTH8 gene by a BLASTN analysis of the candidate region. These results broaden our understanding on genetic basis of heading date and provide clues for fine mapping and marker-assisted qingke maturity breeding with optimized plant architecture for promising loci.
Introduction
Qingke (2n = 14; HH), the Tibetan barley (Hordeum vulgare L.), belongs to the genus Hordeum of the family Gramineae and has been grown in the Qinghai-Tibetan Plateau in China for thousands of years (Zeng et al. Citation2018). Owing to the separation of caryopsis from the palea and the bare grain, it was named the hulless barley, while the locals on the Qinghai-Tibetan Plateau collectively refer to it as qingke (Dai et al. Citation2018). It is a ration for Tibetan farmers and herdsmen as well as a high-quality feed for the plateau livestock (Qiang et al. Citation2008). There are few types of crops that are suitable for planting in the large alpine regions of the Qinghai-Tibetan Plateau; however, qingke is the only crop that can naturally mature (Zang et al. Citation2004). Due to the plateau’s high altitude and cold climate throughout the year, the cycle of suitable qingke is short. Thus, it is necessary to plant early-maturing qingke varieties to harvest the full grains and improve qingke’s yield and quality (Wu et al. Citation2018). Heading date is a key indicator of the early or later maturity of barley, where many studies have confirmed the significant positive correlation between heading date and maturity in barley (Yasuda Citation1989). Therefore, the genetic study of the heading date trait is of great importance to breeding the early-maturing varieties of qingke.
Heading date is a complex quantitative trait in plants and is regulated by a complex network. It responds to both endogenous and exogenous stimuli, including changes in photoperiods, temperatures, and hormones (Sun et al. Citation2007). In barley, four pathways that affect heading and flowering time have been identified, which are related to vernalization, photoperiod, gibberellic acid (GA), and autonomy (Boss et al. Citation2004). By using comparative genetic analyses of these pathways between wheat and barley, many gene homologs reflecting heading and flowering time have been isolated and shown to be associated with variations in heading and flowering time, such as VRN-1, VRN-2, VRN-3, Ppd-H1, Ppd-H2, and eam8 (Decousset et al. Citation2000; Tranquilli and Dubcovsky Citation2000; Fu et al. Citation2005; Turner et al. Citation2005; Yan et al. Citation2006; Xia et al. Citation2017).
Quantitative trait loci (QTL) mapping can identify candidate genes that control heading and flowering time in barley (Pauli et al. Citation2014), where QTL with large phenotypic effects have been mapped onto chromosomes 2H, 3H, 4H, 5H, 6H, and 7H in barley. Using a double-haploid (DH) population of 94 lines and a genetic linkage map of 92 restriction fragment length polymorphism markers, Laurie et al. (Citation1995) detected a total of eight QTLs related to flowering time with two photoperiodic response genes, Ppd-H1 and Ppd-H2, two vernalization response genes, Sh and Sh2, and a dwarfing gene, denso, on chromosomes 2H, 1H, 4H, 5H, and 3H. Börner et al. (Citation2002) also detected a flowering time QTL on the 1HL chromosome under a 16-h long-day condition, explaining 24% of the phenotypic variation, and mapped the early maturity genes, eam8 and eam10, to chromosomes 1HL and 3HL, respectively. In addition, genome-wide association studies (GWAS) of the heading date trait was performed with a single nucleotide polymorphism (SNP) array in a diversity panel comprising 766 spring barley breeding lines, where Wang et al. (Citation2012) identified three major QTL for heading date. Among them, the QTL QHD2 h.64 was located on the long arm of the 2H chromosome, which is close in proximity to the early maturity gene, EAM6. Pauli et al. (Citation2014) and Maurer et al. (Citation2015) also performed GWAS on the heading date of 770 and 1,420 barley varieties, respectively, where they determined that eight major QTLs controlled barley’s flowering time, and the QTL Ppd-H1 showed a major effect.
The development of high-throughput sequencing has increased the precision of species research, while the use of modern molecular methods has become a new trend in QTL studies. High-throughput sequencing also provides new opportunities for crop genetics and breeding (Schmutz et al. Citation2014; Wang et al. Citation2014). In addition, genotyping by sequencing (GBS) is efficient for genotyping a variety of species, especially those with complex and large genomes. A two-enzyme GBS protocol has now been developed that produces a uniform library for sequencing and has been applied to both wheat and barley. Compared with previous methods, this mapping method could significantly improve the efficiency of QTL mapping and marker development (Poland et al. Citation2012).
At present, there are few reports on the underlying genetics and the adaptive mechanisms of early maturity of qingke that grows under unique environmental conditions on the Qinghai-Tibetan Plateau. Although several QTL related to heading and flowering time have been detected and cloned in barley, due to the differences in the genetic backgrounds of barley and qingke, the effective use of these QTL in the early-maturing qingke breeding has been restricted. In this study, we constructed a high-density linkage map by resequencing F2 that comprised 146 individuals that were developed from a cross between the qingke cultivar Dazhangzi with an early-heading phenotype as well as between qingke cultivar Kunlun 10 with a markedly late-heading phenotype. The parents, F2:3 populations and F5 populations were planted in three spring ecological environments, in which the heading dates of the panel accessions were investigated. The objectives of this study were to evaluate the genetic variation and identify environmentally stable QTL for heading date based on the high-density genetic map across the different ecological conditions. At the same time, the localization of single locus was verified by an extreme single plant of a high generation F5 population. The results would clarify the genetic regulation of the early heading in qingke, while the newly detected QTL would be valuable for map-based cloning and qingke improvement.
Materials and methods
Plant material and population construction
A population consisting of 146 F2 lines that were derived from a cross between Dazhangzi and Kunlun 10 was used for preliminary mapping. Dazhangzi is an early-heading qingke (Figure a) and usually heads approximately 12–17 days sooner than Kunlun 10, which is a late-heading qingke (Figure b). The F2:3 population was constructed by crossing Dazhangzi with Kunlun 10 to obtain F1 plants, which were self-pollinated to obtain F2 plants. Next, the single-seed descendants were propagated from the 146 lines of the F2 to the F3 generation to obtain an F2:3 population consisting of 146 lines. Moreover, the field trials were conducted during the summer of 2020 at Quanwan (36°34' N, 101°49' E), Menyuan (37°38' N, 101°63' E), and Xining (36°62' N, 101°78' E) of the Qinghai province that are 2,225 m, 2,867 m, and 2,263 m above sea level, respectively, resulting in a total of three planting environments. We planted 16 plants per parent and the 146 F2:3 families. The experimental plot comprised two rows of 1.5 m in length and 0.3 m in width with eight plants per row.
Figure 1. Phenotypic comparison of the two parents in terms of the heading date. (a) Dazhangzi, an early-maturing parent, shows early heading, whereas (b) Kunlun 10, a late-maturing parent, shows late heading.
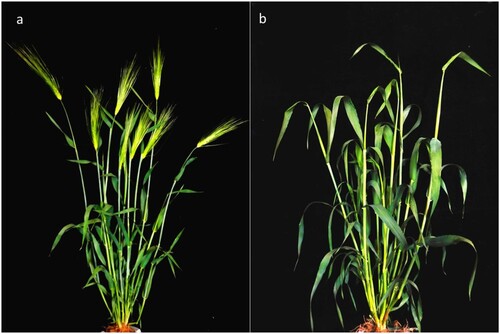
The F5 population, which comprised 120 individuals, was used for mapping the cqHD2H-2 locus. We planted 16 plants per parent and the 120 F5 lines. The experimental plot comprised two rows of 1.5 m in length and 0.3 m in width with eight plants per row.
Phenotypic evaluations
The heading date was calculated per plant by subtracting the date of the seedling’s emergence (monocotyledon’s emergence 1 cm above the ground) from the date of the awn had emerged from the flag leaf of the main tiller. With regards to the F2:3 population and F5 population, the phenotypic data of each family were the average of the 16 individual plants’ phenotypic data within the family. Sort the heading time of the F5 population, and select 25 extremely early heading and 25 extremely late heading individuals to map the cqHD2H-2 locus. Furthermore, various modules of the Statistical Analysis System (SPSS v19.0, Chicago, IL, USA) software package were used to analyze the phenotypic data. In the variance analysis model, the variances of the genotypes, environments, and interactions between the genotypes and environments were considered random effects. Broad-sense heritability (h2) was calculated following the established method (Hosseini et al. Citation2012): , where
is the genetic variance,
is the environmental variance,
is the interaction variance between genotypes and environments, while n and r are the number of environments and repeats, respectively.
Library construction and Illumina sequencing
The two parents and each F2 line of the population were planted for a month, in which the genomic DNA was extracted from the young leaves using the Plant Genomic DNA Kit (Tiangen Biotech, Beijing, China). A total of 1 μL of DNA solution was used to check the DNA quality in 10 g/L agarose via gel electrophoresis, while the DNA concentration was measured using a Nano Photometer spectrophotometer (Implen, CA, USA). A GBS approach was used in this study to develop the SNP markers, in which a GBS pre-design experiment was performed, and the GBS library was constructed using a double digest of the genomic DNA in combination with the NlaIII, MseI, and EcoRI enzymes. This was subsequent to adding the adapters with barcodes, after which each sample was amplified in a multiplex with selected fragments being used for library construction. GBS was performed by Novogene Bioinformatics Technology (Beijing, China).
Furthermore, the Illumina HiSeqTM sequencing platform (Illumina, San Diego, CA, USA) was employed for the double-stranded (paired-end) 150-bp sequencing. Then, based on the evaluation of the original data and the DNA library assembly, HiSeq sequencing was further performed to remove any low-quality base calls or uncalled bases. Meanwhile, we determined the number of reads digested by MseI at both ends of each screened read in the progeny that was subjected to GBS analysis. The specific reads as well as the ratio of the total number of reads to the number of enzyme-captured reads were recorded. Finally, using an Illumina high-throughput sequencing platform, paired-end sequencing was performed on the selected tags, followed by SNP genotyping and evaluation. For GBS, each sample was sequenced and then compared to the reference genome, while the paired-end reads of the clean data from both the parent and the offspring were compared to the reference genome using the Burrows–Wheeler Aligner (BWA) software (Li and Durbin Citation2019). In addition, the SAMtools software (Li et al. Citation2009) was used to create the SAM/BAM format files, which were used to detect mutations, while the coverage was determined using Perl scripts. Finally, a linkage map was also constructed that was based on the hulless barley genome database (ftp://ftp.ensemblgenomes.org/pub/release-29/plants/fasta/hordeum_vulgare/dna/).
Identifying and genotyping SNPs
The SNP mainly refers to the DNA sequence polymorphism that is caused by the variation of a single nucleotide at the genomic level, including the conversion of a single base. Based on the results of the BWA comparison, the parents and the progeny lines were detected by identifying the SNPs on a population level using: (1) The filtered BWA results, which consisted of reads that were aligned to the unique position on the barley genome and were selected for subsequent analysis. (2) SNP detection: GATK was used to perform the group SNP detection on the filtered BAM files (McKenna et al. Citation2010). (3) SNP filtering: to reduce the false positive SNPs from sequencing errors, the parent SNP base support number would not be less than 4. (4) SNP information statistics: number of heterozygous and homozygous SNPs as well as the ratio of heterozygous SNPs. Furthermore, based on the results of the parental genotype testing, developing polymorphic markers between parents was also performed, which was followed by genotyping the 146 progeny lines in the loci at which the parents differed.
Linkage map construction
To ensure the quality of the genetic map, markers were screened according to the following four criteria: (1) Checking abnormal bases, i.e. those present in the offspring but not in the parent, which were regarded as missing and represented by the symbol ‘–’. (2) Checking abnormal genotypes, which were present in the offspring but not in the parent, that were regarded as missing. (3) Integrity filtration, in which genotypes were screened that covered at least 75% of all the offspring individuals. (4) Partial separation filtration, in which 0.001 was used as the threshold to obtain the non-biased separation markers and degenerate the SNP markers into bin markers according to their physical locations and the similarity between the markers. Using the JoinMap 4.0 software, the genetic linkage map was constructed for the developed bin marker genotype (Van Ooijen Citation2006). The command ‘group’ was used to group all the markers (logarithm of the odds score = 3.0) and assign the markers to the possible linkage groups (LGs). Next, the commands ‘compare,’ ‘try,’ and ‘ripple’ were used to determine the sequence of each LG marker, while the Kosambi function was used to convert the recombination value into map distance units (cM) and ‘map’ was used to construct the linkage map.
QTL identification and analysis
QTL mapping was performed by the inclusive composite interval mapping method in the IciMapping v4.1 software (http://www.isbreeding.net/). The QTL reflecting the heading date from every environment were detected in the biparental populations, in which an inclusive composite interval mapping module with a logarithm of the odds score above 2.5 was used. In addition, the consensus QTL were integrated by a meta-analysis using the BioMercator v2.1 software (Goffinet and Gerber Citation2000). When a QTL was identified in only one environment, then that QTL was considered an environment-specific QTL. In contrast, when a QTL was identified across multiple environments, this QTL was designated position on the same chromosome and treated as an environmentally stable consensus QTL. Furthermore, a QTL that explained more than 10% of the phenotypic variance was considered a major QTL.
Mapping of the cqHD2H-2 locus
Indel (insertion/deletion) markers were developed from the resequencing data of the parents according to the hulless barley genome sequence in the cqHD2H-2 primary mapping interval. SSR markers were developed based on the hulless barley genome sequence corresponding to the interval.
The 25 extremely early heading and 25 extremely late heading individuals in the F5 population were used to map the cqHD2H-2 locus using indel and SSR markers. First, we designed 6 SSR markers and 33 indel markers in the primer mapping interval to map the cqHD2H-2 locus. A linkage map for the cqHD2H-2 locus was constructed using JoinMap 4.0 (Van Ooijen Citation2006). Finally, the mapping interval for the cqHD2H-2 locus was gradually reduced, the physical location was obtained by blasting the hulless barley genome database using the indel and SSR sequences. The physical linkage map was produced with MapDraw 2.1 (Liu and Meng Citation2003). All genes within the targeted mapping interval on 2H were identified using annotations from the hulless barley genome, the homologous sequences were aligned using BLASTN (http://blast.ncbi.nlm.nih.gov/).
Results
Phenotypic statistical analysis
T tests and analyses of variance were used to compare the differences in the heading dates between the parents and the F2:3 population across three environments (Table ), in which significant differences were observed. The average heading date of the early-heading parent Dazhangzi was 48.33 days across the three environments, whereas Kunlun 10, the late-heading parent’s heading date reached 62.74 days. With regards to the F2:3, the heading date exhibited continuous variation, which had an approximately normal distribution, implying that early heading date in Dazhangzi was quantitatively inherited (Figure ). Furthermore, the analyses of variance revealed highly significant differences (P < 0.001) that were caused by the genotype (G), environment (E), and the genotype × environment (G × E) interaction (Table ), which indicated that the heading date trait was significantly influenced by both genetic and environmental factors. Broad-sense heritability (h2) of the F2:3 population across the three environments was 83.61%, demonstrating that QTL controlling heading date can largely reduce the number of days toheading.
Figure 2. Heading date comparison and distribution of the parents and the F2:3 populations derived from a cross between Dazhangzi and Kunlun 10, which were measured under three spring ecological conditions and environments in 2020 consisting of 20QW (Quanwan), 20MY (Menyuan), and 20XN (Xining).
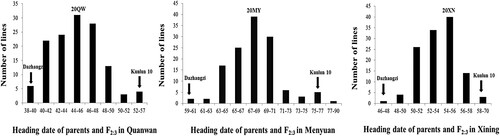
Table 1. Summary statistics of the heading date trait of the parents and the F2:3 populations across 20QW (Quanwan), 20MY (Menyuan), and 20XN (Xining).
Table 2. Analysis of variance and broad-sense heritability of the heading date.
Construction of a high-density genetic map
GBS generated 1,187,660,448 bp and 1,160,952,480 bp of clean data from Dazhangzi and Kunlun 10, respectively, where the Q20 percentages were 96.84% and 97.14%, respectively. After filtering the parents’ sequencing data to render the clean data, 7,695,118 bp (Dazhangzi) and 7,566,250 bp (Kunlun 10) of clean reads were obtained. Further alignments of the clean reads to the reference genome were performed, while the comparison rates of Dazhangzi and Kunlun 10 relative to the reference genome had reached 95.73% and 96.91%, respectively, whereas the ratio of the 146 F2 lines exceeded 96%. With regards to the alignment results of the clean data relative to the reference genome, the GATK software was used for SNP calling, where a total of 311,270 SNPs was detected between the parents Dazhangzi and Kunlun 10. After filtering, a total of 35,044 homozygous SNPs was identified for further analysis. After filling and correcting the SNPs, 2,740 candidate SNP markers were obtained and according to the physical location and similarity of the markers, the 2,740 SNP markers were degenerated into 1,440 bin markers. Unlinked markers were filtered out, where a total of 1,243 bin markers were ultimately mapped to the LGs and spanned a total length of 854.929 cM. Furthermore, the average distance was 0.69 cM between the adjacent bin markers, where LG1 was the largest LG, covering 187.06 cM and containing 188 bin markers, whereas LG4 was the smallest, spanning 51.913 cM and containing 143 bin markers. In addition, LG5 contained 306 bin markers that displayed a high marker polymorphism. In summary, these results indicated that all the bin markers were thoroughly distributed across the genome, with approximately 97.64% of the adjacent marker intervals being less than 5 cM (Table S1, Figure S1).
QTL analysis of heading date and identifying environmentally stable and specific QTL
The high-density genetic linkage map was combined with the phenotypic data and used to detect QTL for heading date. A total of ten QTL that were associated with heading date was identified in the F2:3 population (Table , Figure ), which were distributed mainly on the LGs of 2H (five QTL), 3H (two QTL), 5H (one QTL), and 7H (two QTL), which individually explained 1.51% to 29.65% of the phenotypic variance. Moreover, the additive effect (from −0.81 to −4.97 days) of the eight QTL that was detected in the present study was negative, implying that the parent Dazhangzi contributed alleles of a shorter heading date. However, to verify the QTL identified across multiple environments and integrate the overlapping loci as consensus QTL, BioMercator v2.1 software was used for a meta-analysis. Thus, four QTL of the ten detected QTL in this study were integrated into two consensus QTL as being environmentally stable, while the remaining six QTL were considered environment-specific (Table ).
Figure 3. QTL mapping of the heading date trait in the F2:3 population derived from a cross between Dazhangzi and Kunlun 10. Ten heading date QTL that were identified in the three environments are distributed among four chromosomes. The colored lines represent the QTL detected in each environment, and the line with two colors represents the QTL detected in different environments simultaneously. The two consensus QTL are located on the chromosome 2, while the six specific QTL were identified by the single-environment analysis across the three environments.
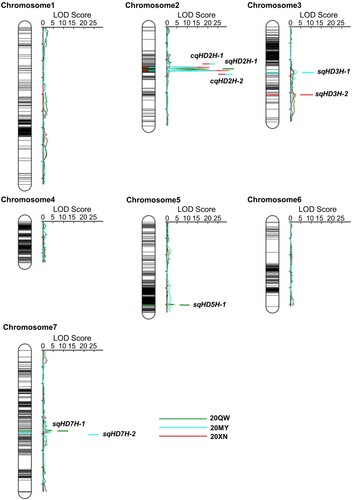
Table 3. Consensus, specific, and identified quantitative trait loci (QTL) of the heading date trait within the F2:3 population in 2020.
As an example, the QTL cqHD2H-2 was stable and detected in two environments, explaining 25.35% to 29.65% of the phenotypic variance and −4.65 to −4.97 of the additive effects, in which the negative effect of the allele may shorten the heading date of the parent Kunlun 10 by 4.81 days. In contrast, the QTL cqHD2H-1 was detected in two environments, explaining 13.36% to 16.13% of the phenotypic variance, while the additive effect from 3.49–3.65 days of cqHD2H-1 was positive, implying that cqHD2H-1 is a late-heading locus (Table , Figure ). Furthermore, six QTL for heading date with no overlapping confidence intervals across the different environments were considered environment-specific QTL. It is worth noting that the QTL qHD2H-20QW1 was integrated, but the peak position of this locus was 51.0 cM, which is very close to the position of cqHD2H-2 (53.0 cM). As it is an early-heading QTL with a phenotypic variation rate of 25.94%, cqHD2H-2 and qHD2H-20QW1 may be the same QTL.
In this study, we aimed to identify the major QTL explaining a relatively high proportion of the phenotypic variation, where three large-effect QTL were detected, including qHD2H-20QW1, cqHD2H-1, and cqHD2H-2 (Table , Figure ). The major QTL, qHD2H-20QW1, was detected in only one ecological condition, showing environmental specificity, whereas the QTL cqHD2H-1 explained 14.75% of the phenotypic variance and was detected in two environments. Moreover, the major QTL cqHD2H-2 was detected in two environments and explained 27.50% of the phenotypic variance, which was expressed in two ecological conditions; therefore, it was considered an environmentally stable QTL. Regardless of whether these major QTL were environmentally stable or specific, they were all considered key QTL for the heading date trait to be used in subsequent fine mapping and map-based cloning analyses.
Mapping of the cqHD2H-2 locus
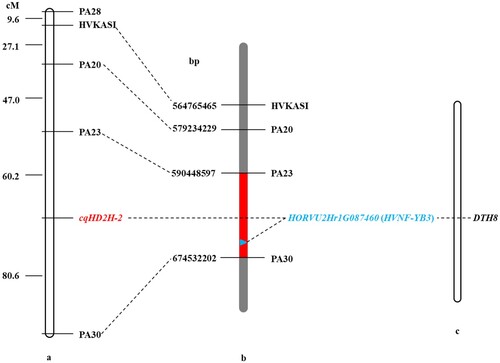
To map the cqHD2H-2 locus and identify the candidate genes, 6 primer pairs of SSR and 33 indel markers were designed to uniformly cover the preliminary mapping interval. As a result, 15 polymorphic markers were detected in the two parental lines. Two of these markers were found to be codominant. The 25 extremely early heading and 25 extremely late heading individuals in the F5 population were then analyzed using these primers. The linkage map constructed using the primer data and corresponding heading date phenotypes showed that one of the SSR maker and 4 of the indel primers were tightly linked to the cqHD2H-2 locus (Table S2). The cqHD2H-2 locus was delimited to an interval of 20.4 cM between PA23 and PA30 (Figure a), corresponding to a candidate interval of approximately 84 Mb between 590,448,597 bp and 674,532,202 bp on 2H of the hulless barley genome (Figure b). The sequence of the candidate region was analysed, the HORVU2Hr1G087460 gene was highly homologous to rice Days-to-heading on chromosome 8 (DTH8)/Os08g0174500 (Figure c). DTH8, a major QTL with pleiotropic effects, can delay flowering and increase plant height and grain number per panicle in rice under long-day conditions (Wei et al. Citation2010; Yan et al. Citation2011). Therefore, we inferred that HORVU2Hr1G087460 was the most important candidate gene for heading date.
Figure 4. Genetic and comparative mapping of the cqHD2H-2. (a) Linkage map of markers of cqHD2H-2. (b) A partial physical map of the linkage markers surrounding cqHD2H-2. The red region indicates the cqHD2H-2 candidate interval, which corresponds to 590,448,597 bp and 674,532,202 bp. (c) HORVU2Hr1G087460 gene corresponding homologous genes of DTH8 of rice.
Discussion
Significance and identifying environmentally stable and specific QTL
Integrating QTL with overlapping confidence intervals can help identify the environmentally specific QTL or the multi-environmentally stable QTL. In this study, four QTL from the ten that were integrated into two consensus QTL were considered environmentally stable. Among these QTL, cqHD2H-2 was detected in two environments and was located at the peak position of 53.0 cM on the 2H chromosome. Interestingly, the QTL qHD2H-20QW1 was not combined, but the peak position was 51.0 cM, which is very close to the position of cqHD2H-2 (53.0 cM). Additionally, irregular emergence in the Quanwan environment was problematic, which indirectly caused experimental errors in the heading investigation. Moreover, the deviation of the phenotypic data may have caused the qHD2H-20QW1 locus to deviate from 53.0 cM to 51.0 cM. Therefore, cqHD2H-2 and qHD2H-20QW1 may be the same locus, both of which are QTL with environmental stability that still require marker development to verify the population. Environmentally stable QTL could be beneficial in breeding new qingke varieties with broad adaptability and be more suitable for fine mapping. With respect to assisting breeding of early maturity qingke, identifying major loci for early heading was our main objective, but in addition to detecting a major QTL for early heading, we also detected an environmentally stable major QTL, cqHD2H-1, reflecting late heading. The cqHD2H-1 can potentially lay the foundation for developing the late-maturing QTL molecular markers as well as support research on the maturity mechanism of qingke, which still require further study.
Comparison and analysis of major QTLs with eam8, Ppd-H1 and Vrn-H1
In our previous experiment, we used three spring long-day environments, where the cqHD2H-2 QTL was detected in two spring long-day environments, reflecting a strong long-day environmental specificity. Previous research results of barley have also showed that the long arm regions of barley’s 1H and 2H chromosomes carry photoperiod response genes, in which Xia et al. Citation2017 mapped a photoperiod response gene, eam8, in the genetic region between 3.9 to 20.3 cM of 1H within a Lalu (early flowering) × Diqing 1 (late flowering) F2 population in the Qinghai-Tibetan Plateau. The results showed that eam8 carries an A/G alternative splicing mutation in the intron, where this alternative splicing event causes a putative protein truncation and can lead to early flowering. Meanwhile, Börner et al. Citation2002 detected a flowering time QTL (eam8) on the 1HL chromosome under a 16 h long-day condition that explained 24% of the phenotypic variation; hence, eam8 is considered a locus involved in long photoperiod responses. Therefore, cqHD2H-2 is distinct from eam8’s position, where the photoperiod response gene Ppd-H1 was mapped in the 2.2 cM genetic interval of the 2H chromosome of barley, and fine mapping of Ppd-H1 was performed to reach the 1.4 cM genetic region. At the same time, the key gene, PRR, was filtered out after the collinearity comparison with rice, in which multiple amino acid variations occur in the structural domain, thus, Ppd-H1 is considered to be a pseudo-response regulator (Decousset et al. Citation2000; Turner et al. Citation2005). Subsequently, a number of studies conducted the haplotype and phenotypic association analysis of the photoperiod gene Ppd-H1 by cloning the approximately 29 Mb HORVU2Hr1G013400 (Ppd-H1) on the short arm of the 2H chromosome of barley (Dondup Citation2015; Nitcher et al. Citation2013). We used cqHD2H-2 flanking markers to perform blast comparison analysis on the 2H chromosome of barley and found that cqHD2H-2 is located in the range of 590 Mb to 674 Mb on the 2H chromosome, which is different from Ppd-H1 (29 Mb). Compared with other results on the qingke heading date, the cqHD2H-2 was newly detected. Therefore, the study of cqHD2H-2 locus is expected to provide new genetic markers and genes. In this study, a minor QTL sqHD5H-1 was detected on the 5H chromosome, which explained the phenotypic variation of 3.82%. On the 5H chromosome of barley, the research on genes related to heading date focused on the vernalization response gene Vrn-H1 (Nitcher et al. Citation2013; Dondup et al. Citation2016; Karsai et al. Citation2005; Maurer et al. Citation2015). Blast comparison between the position of Vrn-H1 gene (599 Mb) and sqHD5H-1 flanking markers (115 Mb-128 Mb) on the 5H chromosome of barley showed that they were not in the same physical location interval.
Candidate genes prediction
Through the development of markers in the cqHD2H-2 preliminary mapping interval and the verification analysis using an F5 subpopulation, we finally obtained the latest positioning interval of cqHD2H-2, based on the gene annotation information in the candidate interval, and the sequence of the candidate interval was analysed, the HORVU2Hr1G087460 gene was highly homologous to rice DTH8 (Os08g0174500). DTH8, a major QTL with pleiotropic effects, can delay flowering and increase plant height and grain number per panicle in rice under long-day conditions (Wei et al. Citation2010; Yan et al. Citation2011). The HORVU2Hr1G087460 homologous sequences were aligned using BLASTN. The homologous gene of HORVU2Hr1G087460 is TaNF-YB3 in Triticum aestivum, TaNF-YB3 was down-regulated by short days and vernalization, and sensitive to the transfer of day length (Dong et al. Citation2011). The homologous gene of HORVU2Hr1G087460 is NF-YB3 in Arabidopsis, NF-YB3 play additive roles in the promotion of flowering, specifically under inductive photoperiodic conditions, and NF-YB3 is essential for the normal induction of flowering by long-days and act through regulation of the expression of FLOWERING LOCUS T (FT) (Kumimoto et al. Citation2008). Liang et al. Citation2012 cloned the NF-YB3 full-length coding region from barley (Hordeum vulgare), and analysis of barley SNP data, revealed a significant association between a HvNF-YB3 SNP and heading date. Therefore, we inferred that HORVU2Hr1G087460 was the most important candidate gene for headingdate.
The importance of molecular marker-assisted selection breeding for qingke
Qingke breeders often use traditional hybridization methods to infiltrate the early-maturing genes with the desired agronomic traits by breeding late-maturing inbred lines or varieties with early-maturing varieties, but the breeding cycle is long and the selection efficiency is low. At the same time, due to the introduction of chain burden, it is difficult to control the genetic stability of adverse genes and unexplored precocious genes. Thus, molecular markers can directly select genotypes without being affected by growth periods or environmental factors, which greatly improves the accuracy and efficiency of the selection. In addition, the molecular marker technique has been widely used in breeding many crops (Koebner et al. Citation2001; Miedaner and Korzun Citation2012; Lateef Citation2015). Hence, in this study, we mapped multiple QTL that potentially control the heading date trait and detected the novel and major QTL, cqHD2H-1 and cqHD2H-2, and two flank co-dominant markers closely linked to cqHD2H-2 were obtained (Figure S2). These molecular marker-assisted selection was applied in the qingke breeding to improve the breeding efficiency and supplement the molecular markers of qingke. With that, we provided a favorable foundation for both molecular marker-assisted selection and gene aggregation breeding in qingke.
Conclusions
The results showed that three major QTLs for the heading date trait in qingke were detected: 2 environmentally stable QTLs and 1 environment-specific QTL. The major QTL, cqHD2H-2, reflects a stable early-heading locus, explaining 27.50% of the phenotypic variance, while the novel QTL cqHD2H-1 was detected in two environments, explaining 14.75% of the phenotypic variance, it is a late-heading locus, this finding could contribute to our understanding of the genetic regulation of the heading date in qingke. In addition, the major QTL cqHD2H-2 was delimited to a candidate region of approximately 84 Mb, and HORVU2Hr1G087460 was determined to be a potential gene, it provides a favorable basis for fine mapping and marker-assisted selection breeding for early maturity.
Supplemental Material
Download MS Word (12.7 KB)Acknowledgements
We thank Handong Wang of the Northwest Institute of Plateau Biology, Chinese Academy of Sciences, for assisting with the data analysis.
Disclosure statement
No potential conflict of interest was reported by the author(s).
Data availability statement
The data that support the findings of this study are openly available in figshare.com at https://doi.org/10.6084/m9.figshare.14866248.v4.
Additional information
Funding
References
- Börner A, Buck-Sorlin GH, Hayes PM, Malyshev S, Korzun V. 2002. Molecular mapping of major genes and quantitative trait loci determining flowering time in response to photoperiod in barley. Plant Breed. 121(2):129–132.
- Boss PK, Bastow RM, Mylne JS, Dean C. 2004. Multiple pathways in the decision to flower: enabling, promoting, and resetting. Plant Cell. 16(Supp1):S18–S31.
- Dai F, Wang X, Zhang XQ, Chen ZH, Nevo E, Jin GL, Wu DZ, Li CD, Zhang GP. 2018. Assembly and analysis of a qingke reference genome demonstrate its close genetic relation to modern cultivated barley. Plant Biotechnol J. 16(3):760–770.
- Decousset L, Griffiths S, Dunford RP, Pratchett N, Laurie DA. 2000. Development of STS markers closely linked to the Ppd-H1 photoperiod response gene of barley (Hordeum vulgare L.). Theor Appl Genet. 101(8):1202–1206.
- Dondup D. 2015. Haplotypes and Phenotypic Association Analysis of Vernalization and Photoperiod Genes in Chinese Barley. PhD thesis, Chinese Academy of Agricultural Sciences. Beijing.
- Dondup D, Dong G, Xu DD, Zhang LS, Zha S, Yuan XM, Tashi NM, Zhang J, Guo GG. 2016. Allelic variation and geographic distribution of vernalization genes HvVRN1 and HvVRN2 in Chinese barley germplasm. Mol Breed. 36(1):11.
- Dong XC, Cheng ZY, Cheng SH, Xu F, An YR, Bian XZ, Chen T. 2011. Identification, characterization, and expression analysis of the TaNF-YB3 gene from Triticum aestivum. Notulae Botanicae Horti Agrobotanici Cluj-Napoca. 39(2):254–263.
- Fu DL, Szűcs P, Yan LL, Helguera M, Skinner JS, von Zitzewitz J, Hayes PM, Dubcovsky J. 2005. Large deletions within the first intron in VRN-1 are associated with spring growth habit in barley and wheat. Mol Genet Genomics. 273(1):54–65.
- Goffinet B, Gerber S. 2000. Quantitative trait loci: a meta-analysis. Genetics. 155(1):463–473.
- Hosseini M, Houshmand S, Mohamadi S, Tarang A, Khodambashi M, Rahimsoroush H. 2012. Detection of QTL with main, epistatic and QTL × environment interaction effects for rice grain appearance quality traits using two populations of backcross inbred lines (BILs). Field Crops Res. 135:97–106.
- Karsai I, Szűcs P, Mészáros K, Filichkina T, Hayes PM, Skinner JS, Láng L, Bedő Z. 2005. The Vrn-H2 locus is a major determinant of flowering time in a facultative×winter growth habit barley (Hordeum vulgare L.) mapping population. Theor Appl Genet. 110(8):1458–1466.
- Koebner RMD, Powell W, Donini P. 2001. Contributions of DNA molecular marker technologies to the genetics and breeding of wheat and barley. Plant Breed Rev. 21:181–220.
- Kumimoto RW, Adam L, Hymus GJ, Repetti PP, Reuber TL, Marion CM, Hempel FD, Ratcliffe OJ. 2008. The nuclear factor Y subunits NF-YB2 and NF-YB3 play additive roles in the promotion of flowering by inductive long-day photoperiods in Arabidopsis. Planta. 228(5):709–723.
- Lateef DD. 2015. DNA marker technologies in plants and applications for crop improvements. J Biosciences Medicines. 3(05):7–18.
- Laurie DA, Pratchett N, Snape JW, Bezant JH. 1995. RFLP mapping of five major genes and eight quantitative trait loci controlling flowering time in a winter× spring barley (Hordeum vulgare L.) cross. Genome. 38(3):575–585.
- Li H, Durbin R. 2019. Fast and accurate short read alignment with Burrows-Wheeler transform. Bioinformatics. 25(14):1754–1760.
- Li H, Handsaker B, Wysoker A, Fennell T, Ruan J, Homer N, Marth G, Abecasis G, Durbin R. 2009. 1000 genome Project data processing subgroup. 2009. The sequence alignment/map format and samtools. Bioinformatics. 25(16):2078–2079.
- Liang MX, Hole D, Wu JX, Blake T, Wu YJ. 2012. Expression and functional analysis of NUCLEAR FACTOR-Y, subunit B genes in barley. Planta. 235(4):779–791.
- Liu RH, Meng JL. 2003. Mapdraw: a microsoft excel macro for drawing genetic linkage maps based on given genetic linkage data. Hereditas. 25(3):317–321.
- Maurer A, Draba V, Jiang Y, Schnaithmann F, Sharma R, Schumann E, Kilian B, Reif JC, Pillen K. 2015. Modelling the genetic architecture of flowering time control in barley through nested association mapping. BMC Genomics. 16(1):290.
- McKenna A, Hanna M, Banks E, Sivachenko A, Cibulskis K, Kernytsky A, Garimella K, Altshuler D, Gabriel S, Daly M, DePristo MA. 2010. The genome analysis toolkit: A mapreduce framework for analyzing next-generation DNA sequencing data. Genome Res. 20(9):1297–1303.
- Miedaner T, Korzun V. 2012. Marker-assisted selection for disease resistance in wheat and barley breeding. Phytopathology. 102(6):560–566.
- Nitcher R, Distelfeld A, Tan CT, Yan LL, Dubcovsky J. 2013. Increased copy number at the HvFT1 locus is associated with accelerated flowering time in barley. Mol Genet Genomics. 288(5):261–275.
- Pauli D, Muehlbauer GJ, Smith KP, Cooper B, Hole D, Obert DE, Ullrich SE, Blake TK. 2014. Association mapping of agronomic QTLs in US spring barley breeding germplasm. Plant Genome. 7(3):1–15.
- Poland JA, Brown PJ, Sorrells ME, Jannink JL. 2012. Development of high-density genetic maps for barley and wheat using a novel two-enzyme genotyping-by-sequencing approach. PloS one. 7(2):e32253.
- Qiang XL, Chi DZ, Feng JL. 2008. Current situation of highland barley production and development in Qinghai-Tibet Plateau region. Tibet Science and Technology. 3:11–17.
- Schmutz J, McClean PE, Mamidi S, Wu GA, Cannon SB, Grimwood J, Jenkins J, Shu S, Song Q, Chavarro C, et al. 2014. A reference genome for common bean and genome-wide analysis of dual domestications. Nat Genet. 46(7):07–713.
- Sun CH, Deng XJ, Fang J, Chu CC. 2007. An overview of flowering transition in higher plants. Hereditas. 29(10):1182–1190.
- Tranquilli G, Dubcovsky J. 2000. Epistatic interaction between vernalization genes Vrn-Am1 and Vrn-Am2 in diploid wheat. J Hered. 91(4):304–306.
- Turner A, Beales J, Faure S, Dunford RP, Laurie DA. 2005. The pseudo-response regulator Ppd-H1 provides adaptation to photoperiod in barley. Science. 310(5750):1031–1034.
- Van Ooijen JW. 2006. JoinMap® 4, Software for the calculation of genetic linkage maps in experimental populations. Kyazma BV, Wageningen. 33(10.1371).
- Wang HY, Smith KP, Combs E, Blake T, Horsley RD, Muehlbauer GJ. 2012. Effect of population size and unbalanced data sets on QTL detection using genome-wide association mapping in barley breeding germplasm. Theor Appl Genet. 124(1):111–124.
- Wang LH, Yu S, Tong CB, Zhao YZ, Liu Y, Song C, Zhang YX, Zhang XD, Wang Y, Hua W, et al. 2014. Genome sequencing of the high oil crop sesame provides insight into oil biosynthesis. Genome Biol. 15(2):1–13.
- Wei XJ, Xu JF, Guo HN, Jiang L, Chen SH, Yu CY, Zhou ZL, Hu PS, Zhai HQ, Wan JM. 2010. DTH8 suppresses flowering in rice, influencing plant height and yield potential simultaneously. Plant Physiol. 153(4):1747–1758.
- Wu KL, Yao XH, Yao YH, Bai YX, Chi DZ. 2018. Reflections and practice on breeding barley varieties under the background of diversified uses. Tibet J Agricultural Sciences. 40(S1):1–2.
- Xia TF, Zhang LQ, Xu JQ, Wang L, Liu BL, Hao M, Chang X, Zhang TW, Li SM, Zhang HG, et al. 2017. The alternative splicing of EAM8 contributes to early flowering and short-season adaptation in a landrace barley from the Qinghai-Tibetan plateau. Theor Appl Genet. 130(4):757–766.
- Yan L, Fu D, Li C, Blechl A, Tranquilli G, Bonafede M, Sanchez A, Valarik M, Yasuda S, Dubcovsky J. 2006. The wheat and barley vernalization gene VRN3 is an orthologue of FT. Proc Natl Acad Sci USA. 103(51):19581–19586.
- Yan WH, Wang P, Chen HX, Zhou HJ, Li QP, Wang CR, Ding ZH, Zhang YS, Yu SB, Xing YZ, Zhang QF. 2011. A major QTL, Ghd8, plays pleiotropic roles in regulating grain productivity, plant height, and heading date in rice. Mol Plant. 4(2):319–330.
- Yasuda S. 1989. Differences in mechanism of early maturity between cultivated common wheat and barley. Japan J Breed. 39(3):327–335.
- Zang JWK, Chen ZDJQ, Zhao GH. 2004. Applications of barley and study on its components. China Food Additives. 4:43–46.
- Zeng XQ, Guo Y, Xu QJ, Mascher M, Guo GG, Li SC, Mao LK, Liu QF, Xia ZF, Zhou JH, et al. 2018. Origin and evolution of qingke barley in Tibet. Nat Commun. 9(1):5433.