
Abstract
LUM, a less-explored member of small leucine-rich proteoglycan family, has gained growing concern with controversial roles in tumor prognosis in recent years. The function of LUM in gastric cancer remains rarely reported and largely unclear. In this study, we investigated the expression of LUM in gastric cancer as well as its association with clinical parameters. Data from the GEO and Human Protein Atlas (HPA) databases are used for further validation. GC tissue shows significantly high expression of LUM compared with normal tissue (P < 0.001). High expression of LUM is correlated with poor differentiation, advanced tumor stage, deeper local invasion and worse overall survival. Patients with high expression of LUM have significantly worse prognosis than those with low expression. Multivariate analysis shows that high expression of LUM is an independent risk factor for overall survival. Several biomolecular pathways, including extracellular matrix receptor interaction, melanoma, cancer, chemokine signaling, Toll-like receptor signaling and Wnt signaling, are screened out as significantly enriched in GCs with high LUM expression using GSEA. Our study reveals that LUM, as an independent predictor, is highly expressed and associated with clinicopathologic factors in gastric cancer, demonstrating potential applications in prognosis of patient with gastric cancer.
Introduction
Gastric cancer (GC) is the 5th most common neoplasm and the 3rd most deadly cancer worldwide and over a million new cases of GC are diagnosed each year (Bray et al. Citation2018). Although the incidence of GC has steadily declined worldwide over the past 50 years, the 5-year overall survival rate remains low due to the stage of GC at the time of initial diagnosis (Rawla and Barsouk Citation2019). Gastric cancer is highly aggressive and typically asymptomatic, and majority of GC patients are diagnosed in the advanced stage and even with distant metastasis (Meyer and Wilke Citation2011). Therefore, searching for novel effective biomarkers are urgently required for early detection and precise diagnosis of GC.
LUM, also known as lumican gene, encodes a member of the small leucine-rich proteoglycan (SLRP) family that is involved in matrix organization and regulation of cell growth and signaling (Nikitovic et al. Citation2008). The SLRP family not only regulates collagen fibrillogenesis, adhesion and degradation, but also plays a notable role in tumogenesis (Chen and Birk Citation2013). LUM had been reported to play controversial roles in regulating tumor occurrence and development by functioning both as an oncogene or tumor suppressor gene. LUM participates in cell processes such as cell proliferation, adhesion and migration. Functional studies had implicated that depletion of LUM in bladder and liver cancer would inhibit tumor proliferation, invasion and migration, while overexpression of LUM would lead to diametrically opposite result (Mao et al. Citation2019; Mu et al. Citation2018). Similar results were obtained in other cancers, including lung, renal, colorectal, bladder and ovarian cancers (de Wit et al. Citation2013; Ho et al. Citation2017; Mao et al. Citation2019; Mariani et al. Citation2019; Schaefer and Iozzo Citation2012; Zhou and Ge Citation2013). Nevertheless, several other studies have implied that LUM expression is higher in tumor stroma than in tumor cells, and was negatively related to the occurrence and progression of cancers, primarily through its influence on the extracellular matrix or the function of suppressor gene (Karamanou et al. Citation2017; Li et al. Citation2017; Nikitovic et al. Citation2008; Sharma et al. Citation2013).
As mentioned previously, no unified conclusion can be drawn regarding the role of LUM in cancers. Moreover, the clinicopathologic correlation and prognostic value of LUM in GC are rarely reported and remain largely unclear. Therefore, it is essential to investigate the role of LUM in GC. We analyzed datasets from The Cancer Genome Atlas (TCGA) and Gene Expression Omnibus (GEO) databases based on bioinformatics analysis. Our study reveals the association of LUM with clinicopathologic factors, as well as several newly identified molecular signaling pathways correlated with LUM in GC, which helps to define the diagnostic and prognostic value of LUM in GC.
Materials and methods
Data extraction from TCGA database
The Gene Expression Quantification (Workflow Type: HTSeq-Counts, 407 cases in total, including 32 normal samples) and corresponding clinical data with survival time of GC patients were downloaded from the TCGA Genomic Data Commons data portal (https://portal.gdc.cancer.gov/repository, TCGA public data updated until 7 April 2020). Boxplots are used to visually show the distribution of discrete clinical variates. The HTSeq-Counts data of RNA-Seq gene expression for 375 GC patients is used for further analysis.
Statistical analysis and gene set enrichment analysis
We use Wilcoxon signed rank test and logistic regression to evaluate the correlation between LUM expression and clinical factors. Cox-regression and the Kaplan–Meier method were used to screen out clinical factors which were significantly associated with GC overall survival. Multivariate Cox-analysis is used to investigate the correlation of LUM expression and clinicopathologic parameters (age, gender, tumor grade, distant metastasis status, lymph node status, clinical stage and depth of invasion). The LUM expression data are divided into high and low groups based on the median values and median risk score. GSEA is a computational method used to distinguish differential expression of gene sets between groups and to explore biologically molecular signaling pathways. The phenotype labels of LUM expression data (375 tumor samples) from TCGA database are divided into high- and low- LUM group. The phenotype label files and datasets are uploaded to the GSEA software (gsea-3.0.jar). Each analysis is conducted 1000 times for the gene set permutations. Gene sets are defined as enriched only for both normal P-value < 0.05 and false discovery rate (FDR) Q-value < 0.05. The Perl Programming Language (v5. 30. 0) and R software (V.3.6.2) are used for the above data preparation and analysis.
Gene Expression Omnibus (GEO) and Human Protein Atlas (HPA) databases analysis
To further validate the accuracy of conclusion from the TCGA profile, GC samples from the GEO database are downloaded for analysis. GSE54129 contained 111 human cancerous and 21 noncancerous gastric tissues are used for differential expression analysis of LUM, while GSE84437 included 433 GC tissue samples containing clinical information is used for differential analysis of LUM expression. The Human Protein Atlas (HPA) contains an expression map of the complete human proteome in normal and cancerous tissues. Therefore, further validation of the protein expression difference is conducted through analysis of immunohistochemistry (IHC) data from the HPA database (http://www.proteinatlas.org/).
Result
Association between LUM and clinical parameters
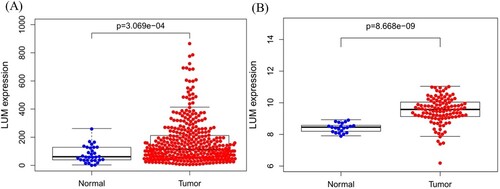
A total of 407 patients (including 375 tumor and 32 normal tissues samples) are enrolled from TCGA database. The association between LUM expression and clinicopathologic parameters, including age, gender, tumor grade, tumor stage, depth of invasion, distant metastasis status and lymph node status, are evaluated. LUM expression is much higher in tumor tissues compared to normal tissues (P < 0.001) (Figure (A), P < 0.001). The high expression of LUM in GC tissues is validated in GEO54129 dataset (Figure (B), P < 0.001).
Figure 1. LUM differential expression in normal and tumor tissues. A: comparison of TCGA profile; B: comparison of GEO dataset
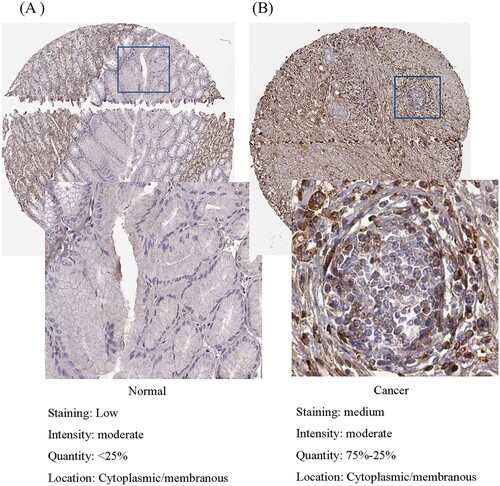
To further validate the LUM expression upon protein level, IHC staining is visualized from the HPA, which shows critical high staining of LUM in glandular cells of GC compared to normal gastric tissues (Figure ).
Figure 2. Validation of protein expression of LUM in normal tissue (A) and gastric cancer (B) using the Human Protein Atlas database.
As shown in Figure (a–f), the high expression of the LUM is significantly correlated with tumor grade (P < 0.001), clinical stage (P < 0.001) and depth of local invasion (P < 0.001) while no association with age, gender, distant metastasis or lymph nodes metastasis.
Figure 3. Association of LUM expression with clinical variates. A: age; B: gender; C: grade; D: distant metastasis; E: lymph node metastasis; F: clinical stage; G: depth of invasion
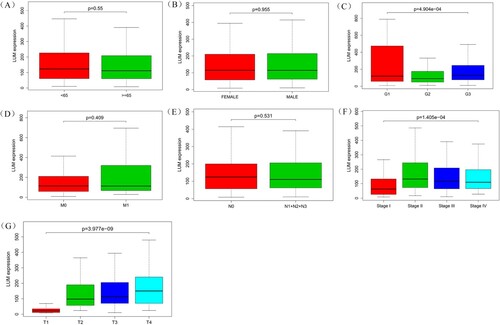
Univariate analysis using logistic regression indicates high LUM expression is associated with adverse prognostic clinicopathologic variates (Table ). High expression of LUM in GC is significantly associated with clinical stage (OR = 3.149 for stage II vs. stage I; OR = 2.081 for stage III vs. stage I) and T classification (OR = 13.304 for T2 vs. T1; OR = 18.434 for T3 vs. T1; OR = 30.649 for T4 vs. T1).
Table 1. Logistic regression between LUM expression and clinicopathologic parameters.
Diagnostic value of LUM In GC
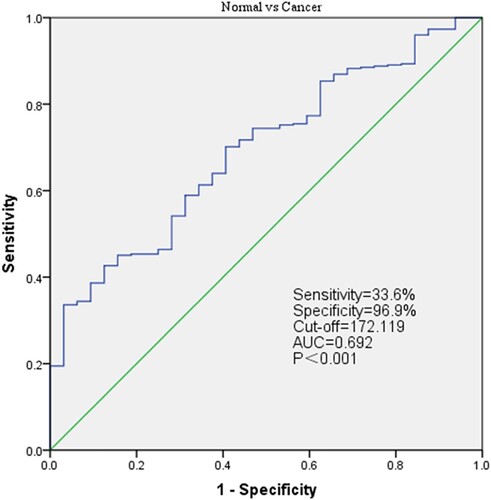
To evaluate the diagnostic value of LUM, the mRNA expression profiles from TCGA 375 GC patients and 32 normal tissues are assessed by receiver operating characteristic (ROC). The area below ROC curve is 0.692 [95% confidence interval (CI): 60.9–77.6%], the sensitivity is 33.6%, while the specificity is 96.9%, which indicates considerable diagnostic value (Figure ).
Figure 4. Receiver operating characteristic curve for LUM expression in normal and gastric cancer tissues.
Survival analysis and univariate/multivariate analysis of both datasets
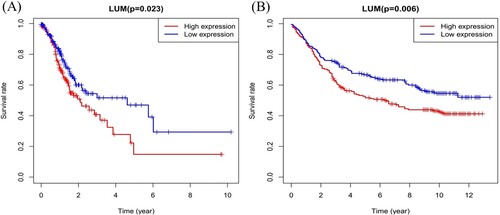
As shown in Figure (a), the high expression of LUM is strongly correlated with worse overall survival (P = 0.023). This correlation is further confirmed in GSE84437 (Figure B, P = 0.006) dataset.
Figure 5. LUM expression and overall survival in gastric cancer patients in TCGA profile (A) and the GSE84437 dataset (B).
As shown in Table , the univariate analysis shows that overexpression of LUM is significantly associated with poor overall survival [hazard ratio (HR): 1.001; 95% CI: 1.000–1.003; P-value = 0.0241]. Other clinical factors associating with adverse survival outcome include age, stage and TNM classification. Multivariate Cox analysis of the clinical variates reveals that high LUM expression and age are still the independent risk factors for overall survival with a HR of 1.001 (95%CI: 1.000–1.003, P = 0.00263) and age (HR = 1.040, 95%CI: 1.019–1.060, P < 0.001). Univariate and multivariate analysis using GSE84437 also indicate that high expression of LUM and age are still associated with lower overall survival in GC patients (Table ).
Table 2. Univariate and multivariate analysis of the correlation between LUM expression and overall survival in gastric cancer patients.
Table 3. Univariate and multivariate analysis of the correlation between LUM expression and overall survival in gastric cancer patients validated using the GSE8443 dataset.
LUM-related signaling pathways by GSEA
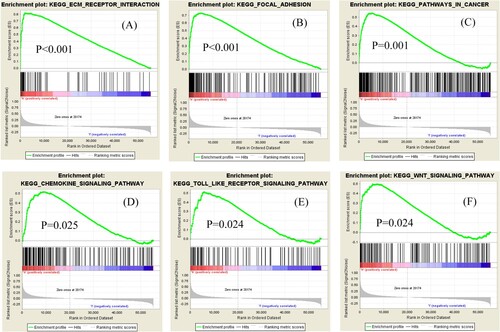
Gene Set Enrichment Analysis (GSEA) is performed to screen for potential signaling pathways by comparing the high and low LUM expression datasets in a molecular signature database (MSigDB). We carry out random sample permutations of 1000. Significant gene set enrichment is defined with nominal P-value < 0.05 and FDR q-value < 0.05. As shown in Figure , we identify several cancer-related significantly enriched signaling pathways, including extracellular matrix receptor interaction, melanoma, cancer, chemokine signaling, Toll-like receptor signaling and Wnt signaling (FDR < 0.01), that are related to overexpression of LUM in GC based on normalized enrichment scores.
Figure 6. Significantly enriched signaling pathways of GSEA. Genes involved in extracellular matrix-receptor interaction (A), focal adhesion (B), cancer (C), chemokine signaling (D), Toll-like receptor signaling (E) and WNT signaling (F) were significantly enriched in LUM-related gastric cancer.
Discussion
LUM is a key member of small leucine-rich proteoglycans (SLRPs). LUM located at the distal end of the human chromosome 12 and is composed of 3 exons and 2 introns with a total length of about 6.9 kb (Appunni et al. Citation2017; Chakravarti et al. Citation1995). Recently, LUM had been reported to play controversial roles in tumor occurrence and development. Several studies have shown that LUM was upregulated in cancer, such as bladder, renal and liver cancer (Ho et al. Citation2017; Mao et al. Citation2019; Mu et al. Citation2018), and LUM affects the proliferation, adhesion and migration of cancer cells through a variety of mechanisms (D’Onofrio et al. Citation2008; Kang et al. Citation2015; Seomun and Joo Citation2008). While other studies also showed its anti-tumor properties in melanoma, pancreatic adenocarcinoma and lung cancer (Jeanne et al. Citation2017; Li et al. Citation2017; Yang et al. Citation2018). Therefore, the predictive value of LUM as a novel biomarker in GC has not been well clarified. We aim to revealed the association of LUM with clinicopathologic factors, and potential molecular signaling pathways, which will help to clarify the diagnostic and prognostic value of LUM in GC.
In the present study, bioinformatics analysis of LUM expression data from both TCGA and GEO databases reveal that LUM is more highly expressed in tumor compared to normal tissues. Previous studies based on tissue assay and immunohistochemistry showed that LUM was highly expressed in GC tissue, which confirmed our findings at the mRNA and protein level (Chen et al. Citation2017; Wang et al. Citation2017). Combined with other research findings, the LUM expression might be correlated with the clinicopathologic characteristics in GC. Further analysis indicates that high expression of the LUM is significantly correlated with tumor grade, clinical stage and depth of local invasion. Our findings are consistent with previous studies which reported that LUM was correlated with clinical factors and might modulate tumor growth and progression in GC (Appunni et al. Citation2019; Wang et al. Citation2017).
Univariate and multivariate Cox analysis of the clinical variates from both TCGA and GEO datasets reveal that high LUM expression is the independent risk factor for overall survival. ROC curve further shows its considerable diagnostic value in GC. As showed in multivariate analysis, age is an independent risk factor for overall survival in GC patients. This result is consistent with a previous report (Song et al. Citation2018). To further explore the roles of LUM in GC, GSEA is used to distinguish critical gene sets in TCGA profiles. We identify several cancer-related significantly enriched signaling pathways, including extracellular matrix receptor interaction, focal adhesion, cancer, chemokine signaling, Toll-like receptor signaling and Wnt signaling, which might relate to overexpression of LUM in GC.
In recent years, it has been proved that the extracellular matrix (ECM) affects the tumor microenvironment and plays significant role in tumor progression (Lu et al. Citation2012). ECM is essential in tumor cell differentiation, migration and matrix organization through complex biological interactions (Bonnans et al. Citation2014; Gilkes et al. Citation2014). A recent genes expression research in gastrointestinal cancer revealed that ECM remodeling and cell adhesion interacted with each other resulting in the progression in GC (Binato et al. Citation2018). Pathways that affect the ECM also interact with cell adhesion pathway. An imbalance among these pathways results in tumor progression (Krupp et al. Citation2011). These conclusions are consistent with our findings of the GSEA result. Wnt pathway is well recognized as important pathway in cell proliferation during both normal and cancerous gut development (Molaei et al. Citation2018). High expression of SALL4 and SOX2 were shown to activate Wnt/β-catenin pathway in gastrointestinal cancer, and therefore could be a target for the treatment of GC (Forghanifard et al. Citation2014; Zhang et al. Citation2014). Together with our findings, ECM receptor interaction, cancer and Wnt signaling pathways might be the key molecular regulating networks of aberrant LUM expression in gastric carcinogenesis. LUM is also observed to modulate tumor proliferation and migration in a tumor-specific manner by different mechanisms.
SLRPs are ubiquitously distributed in ECM that potentially regulates cancer cell proliferation, angiogenesis and migration (Appunni et al. Citation2019). As a key member of SLRPs family, LUM is observed to modulate tumor proliferation and migration in a tumor-specific manner by different mechanisms. It has been reported that LUM promoted cancer growth by activating the integrin β1 mediated FAK signaling pathway through the cancer-associated fibroblasts (CAF) (Wang et al. Citation2017). The silencing of LUM can deactivate MAPK signaling pathway and inhibit the invasion of colon cancer (Quan Fengtao Citation2017). However, some studies also reveal a contradictory function and showed its antitumor activity in cancers including prostate, breast and pancreatic ductal adenocarcinoma (Coulson-Thomas et al. Citation2013; Karamanou et al. Citation2017; Li et al. Citation2017). Thus, the expression and association of LUM with clinical outcomes should be treated in a tumor-specific manner.
However, this study has its drawbacks. As all the datasets are from online public databases, more validations of LUM expression in GC are needed in future research. Because our study is based on bioinformatics analysis, the biological and pathological properties of LUM in GC are worthwhile for further investigations. In conclusion, our study is novel in several aspects. First, we further clarify that LUM, serving as oncogene, is highly expressed in gastric cancer. Second, LUM might promote tumor progression in matrix organization and biological interactions through extracellular matrix receptor interaction and Wnt signaling. Finally, we demonstrated that high expression of LUM represented a potential biomarker and prognostic predictor for patients with GC.
Abbreviations
GC – astric cancer
TCGA – The Cancer Genome Atlas
ROC – Receiver operating characteristic
HPA – Human Protein Atlas
GSEA – Gene set enrichment analysis
SLRP – Small leucine-rich proteoglycan
FDR – False discovery rate
GEO – Gene Expression Omnibus
IHC – Immunohistochemistry
CI – Confidence interval
HR – Hazard ratio
MSigDB – Molecular signatures database
ECM – Extracellular matrix
CAF – Cancer associated fibroblasts
Data accessibility
The datasets or profiles used in the current study are from TCGA and GEO databases, which are available at the following websites:
https://portal.gdc.cancer.gov/repository
Acknowledgements
The authors extend deepest appreciation to Dr Huang Yingshi for editing the manuscript.
Disclosure statement
No potential conflict of interest was reported by the author(s).
References
- Appunni S, Anand V, Khandelwal M, Gupta N, Rubens M, Sharma A. 2019. Small leucine rich proteoglycans (decorin, biglycan and lumican) in cancer. Clin Chim Acta. 491:1–7.
- Appunni S, Anand V, Khandelwal M, Seth A, Mathur S, Sharma A. 2017. Altered expression of small leucine-rich proteoglycans (decorin, biglycan and lumican): plausible diagnostic marker in urothelial carcinoma of bladder. Tumour Biol 39:1010428317699112.
- Binato R, Santos EC, Boroni M, Demachki S, Assumpcao P, Abdelhay E. 2018. A common molecular signature of intestinal-type gastric carcinoma indicates processes related to gastric carcinogenesis. Oncotarget. 9:7359–7371.
- Bonnans C, Chou J, Werb Z. 2014. Remodelling the extracellular matrix in development and disease. Nat Rev Mol Cell Biol. 15:786–801.
- Bray F, Ferlay J, Soerjomataram I, Siegel RL, Torre LA, Jemal A. 2018. Global cancer statistics 2018: GLOBOCAN estimates of incidence and mortality worldwide for 36 cancers in 185 countries. CA Cancer J Clin. 68:394–424.
- Chakravarti S, Stallings RL, SundarRaj N, Cornuet PK, Hassell JR. 1995. Primary structure of human lumican (keratan sulfate proteoglycan) and localization of the gene (LUM) to chromosome 12q21.3-q22. Genomics. 27:481–488.
- Chen L, Zhang Y, Zuo Y, Ma F, Song H. 2017. Lumican expression in gastric cancer and its association with biological behavior and prognosis. Oncol Lett. 14:5235–5240.
- Chen S, Birk DE. 2013. The regulatory roles of small leucine-rich proteoglycans in extracellular matrix assembly. FEBS J 280:2120–2137.
- Coulson-Thomas VJ, Coulson-Thomas YM, Gesteira TF, de Paula CA A, Carneiro CR, Ortiz V, Toma L, Kao WW, Nader HB. 2013. Lumican expression, localization and antitumor activity in prostate cancer. Exp Cell Res. 319:967–981.
- de Wit M, Belt EJ, Delis-van Diemen PM, Carvalho B, Coupé VM, Stockmann HB, Bril H, Beliën JA, Fijneman RJ, Meijer GA. 2013. Lumican and versican are associated with good outcome in stage II and III colon cancer. Ann Surg Oncol. 20(Suppl 3):S348–S359. Epub 2012/06/20.
- D’Onofrio MF, Brezillon S, Baranek T, Perreau C, Roughley PJ, Maquart FX, Wegrowski Y. 2008. Identification of beta1 integrin as mediator of melanoma cell adhesion to lumican. Biochem Biophys Res Commun. 365:266–272.
- Forghanifard MM, Ardalan Khales S, Javdani-Mallak A, Rad A, Farshchian M, Abbaszadegan MR. 2014. Stemness state regulators SALL4 and SOX2 are involved in progression and invasiveness of esophageal squamous cell carcinoma. Med Oncol. 31:922.
- Gilkes DM, Semenza GL, Wirtz D. 2014. Hypoxia and the extracellular matrix: drivers of tumour metastasis. Nat Rev Cancer. 14:430–439.
- Ho TH, Serie DJ, Parasramka M, Cheville JC, Bot BM, Tan W, Wang L, Joseph RW, Hilton T, Leibovich BC, et al. 2017. Differential gene expression profiling of matched primary renal cell carcinoma and metastases reveals upregulation of extracellular matrix genes. Ann Oncology: Official J Eur Soc Med Oncol. 28:604–610.
- Jeanne A, Untereiner V, Perreau C, Proult I, Gobinet C, Boulagnon-Rombi C, Terryn C, Martiny L, Brezillon S, Dedieu S. 2017. Lumican delays melanoma growth in mice and drives tumor molecular assembly as well as response to matrix-targeted TAX2 therapeutic peptide. Sci Rep. 7:7700.
- Kang Y, Zhang R, Suzuki R, Li SQ, Roife D, Truty MJ, Chatterjee D, Thomas RM, Cardwell J, Wang Y, et al. 2015. Two-dimensional culture of human pancreatic adenocarcinoma cells results in an irreversible transition from epithelial to mesenchymal phenotype. Laboratory Investig J Techn Methods Pathol. 95:207–222.
- Karamanou K, Franchi M, Piperigkou Z, Perreau C, Maquart FX, Vynios DH, Brezillon S. 2017. Lumican effectively regulates the estrogen receptors-associated functional properties of breast cancer cells, expression of matrix effectors and epithelial-to-mesenchymal transition. Sci Rep. 7:45138.
- Krupp M, Maass T, Marquardt JU, Staib F, Bauer T, Konig R, Biesterfeld S, Galle PR, Tresch A, Teufel A. 2011. The functional cancer map: a systems-level synopsis of genetic deregulation in cancer. BMC Med Genomics. 4:53.
- Li X, Kang Y, Roife D, Lee Y, Pratt M, Perez MR, Dai B, Koay EJ, Fleming JB. 2017. Prolonged exposure to extracellular lumican restrains pancreatic adenocarcinoma growth. Oncogene. 36:5432–5438.
- Lu P, Weaver VM, Werb Z. 2012. The extracellular matrix: a dynamic niche in cancer progression. J Cell Biol. 196:395–406.
- Mao W, Luo M, Huang X, Wang Q, Fan J, Gao L, Zhang Y, Geng J. 2019. Knockdown of lumican inhibits proliferation and migration of bladder cancer. Translational Oncology. 12:1072–1078.
- Mariani A, Wang C, Oberg AL, Riska SM, Torres M, Kumka J, Multinu F, Sagar G, Roy D, Jung DB, et al. 2019. Genes associated with bowel metastases in ovarian cancer. Gynecol Oncol. 154:495–504. Epub 2019/06/18.
- Meyer HJ, Wilke H. 2011. Treatment strategies in gastric cancer. Deutsches Arzteblatt International. 108:698–705.; quiz 706.
- Molaei F, Forghanifard MM, Fahim Y, Abbaszadegan MR. 2018. Molecular signaling In tumorigenesis of gastric cancer. Iran Biomed J. 22:217–230.
- Mu QM, He W, Hou GM, Liang Y, Wang G, Li CL, Liao B, Liu X, Ye Z, Lu JL, et al. 2018. Interference of lumican regulates the invasion and migration of liver cancer cells. Sichuan Da Xue Xue Bao Yi Xue Ban. 49:358–363.
- Nikitovic D, Berdiaki A, Zafiropoulos A, Katonis P, Tsatsakis A, Karamanos NK, Tzanakakis GN. 2008. Lumican expression is positively correlated with the differentiation and negatively with the growth of human osteosarcoma cells. The FEBS Journal. 275:350–361.
- Nikitovic D, Katonis P, Tsatsakis A, Karamanos NK, Tzanakakis GN. 2008. Lumican, a small leucine-rich proteoglycan. IUBMB Life. 60:818–823. Epub 2008/10/25.
- Quan F, Chen Y, Hao D, Zhang L, Yang W. 2017. Epigenetic silence of lumican inhibits the motility of colon cancer via inactivating MAPK signaling in vitro and in vivo. Int J Clin Exp Med. 10.
- Rawla P, Barsouk A. 2019. Epidemiology of gastric cancer: global trends, risk factors and prevention. Prz Gastroenterol. 14:26–38.
- Schaefer L, Iozzo RV. 2012. Small leucine-rich proteoglycans, at the crossroad of cancer growth and inflammation. Curr Opin Genet Dev. 22:56–57.
- Seomun Y, Joo CK. 2008. Lumican induces human corneal epithelial cell migration and integrin expression via ERK 1/2 signaling. Biochem Biophys Res Commun. 372:221–225.
- Sharma B, Ramus MD, Kirkwood CT, Sperry EE, Chu PH, Kao WW, Albig AR. 2013. Lumican exhibits anti-angiogenic activity in a context specific manner. Cancer Microenviron: Off J Int Cancer Microenviron Soc. 6:263–271.
- Song W, Lv CG, Miao DL, Zhu ZG, Wu Q, Wang YG, Chen L. 2018. Development and validation of a nomogram for predicting survival in patients with gastrointestinal stromal tumours. Eur J Surg Oncol. 44:1657–1665.
- Wang X, Zhou Q, Yu Z, Wu X, Chen X, Li J, Li C, Yan M, Zhu Z, Liu B, et al. 2017. Cancer-associated fibroblast-derived lumican promotes gastric cancer progression via the integrin beta1-FAK signaling pathway. Int J Cancer. 141:998–1010.
- Yang CT, Li JM, Chu WK, Chow SE. 2018. Downregulation of lumican accelerates lung cancer cell invasion through p120 catenin. Cell Death Dis. 9:414.
- Zhang L, Xu Z, Xu X, Zhang B, Wu H, Wang M, Zhang X, Yang T, Cai J, Yan Y, et al. 2014. SALL4, a novel marker for human gastric carcinogenesis and metastasis. Oncogene. 33:5491–5500.
- Zhou K, Ge M. 2013. Effect of lumican gene over-expression on proliferation of lung adenocarcinoma cell A549 and its mechanism. Xi Bao Yu Fen Zi Mian Yi Xue Za Zhi. 29:492–495. 497. Epub 2013/05/07.