
 ?Mathematical formulae have been encoded as MathML and are displayed in this HTML version using MathJax in order to improve their display. Uncheck the box to turn MathJax off. This feature requires Javascript. Click on a formula to zoom.
Abstract
All parts of Phyllanthus emblica L. are traditionally used for the treatment of jaundice, inflammation, and diarrhea. The present study was planned to evaluate the P. emblica leaf extract (PELE) assisted clearance of bilirubin in artificially-induced hyperbilirubinemic rabbits. Hyperbilirubinemia was induced in White New Zealand albino rabbits by oral administration of phenyl hydrazine solution (10 mg kg−1 body weight) and an intraperitoneal injection of ursodeoxycholic acid solution (10 mg kg−1 bw). PELE-assisted bilirubin clearance from animals was optimized by a bi-factorial response-surface central composite design with five levels of each of the extract dose (0, 25, 50, 75, and 100 mg kg−1 bw) and sampling period (24, 48, 72, 96, and 120 h). The oral administration of PELE showed a significant (p < 0.05) dose-dependent linear increase in bilirubin clearance from hyperbilirubinemic rabbits. However, the sampling period showed no significant effect on bilirubin clearance. The optimum levels of PELE dose and sampling period for maximum clearance of bilirubin (0.658 mg dL−1) were found to be 94.864 mg kg−1 body weight and 51.12 h respectively. PELE was found to be effective in bilirubin clearance at the observed optimum levels of extract dose and would be a good choice for the management of hyperbilirubinemia.
Introduction
Bilirubin is a bile pigment produced as the end product of heme metabolisms. Bilirubin being insoluble in water, due to the presence of intramolecular hydrogen bonds, gets associated with serum albumin for its transportation to the liver. In the liver, ligandin carries insoluble bilirubin to hepatocytes where it undergoes conjugation with glucuronic acid catalyzed by uridine diphosphate-glucuronyl transferase (UDP-GT) and becomes water-soluble. The water-soluble bilirubin is excreted through bile into the small intestine and finally excreted out via feces (Wolkoff Citation2014). A relatively high level of bilirubin in the blood is termed as hyperbilirubinemia. An excess production, enterohepatic circulation, and defective conjugation of bilirubin lead to unconjugated hyperbilirubinemia (Chowdhury et al. Citation2020). The defects in hepatic and biliary clearance of conjugated bilirubin develop conjugated hyperbilirubinemia. The unconjugated lipophilic bilirubin gets deposited in lipocytes resulting in the yellow pigmentation of skin and eyes, a physiologic condition known as jaundice. The immature liver and excess hemolysis are the major factors for the development of jaundice in neonates (Ullah et al. Citation2016). The severe unconjugated neonatal hyperbilirubinemia causes neurotoxicity leading to neurological dysfunction, kernicterus (irreversible brain damage), and death (Abbas et al. Citation2016; Berthelot et al. Citation1982; Chee et al. Citation2018; Chowdhury et al. Citation2020).
The hyperbilirubinemia can be managed by proper clearance of bilirubin from the body that requires the transformation of water-insoluble bilirubin to water-soluble one. Currently, phototherapy, chemical and herbal treatment, exchange transfusion, liver transplant, and gene therapy are the in-practice methods for the treatment and management of hyperbilirubinemia (Sharma et al. Citation2012; Edris et al. Citation2014; Woodgate and Jardine Citation2015; Mitra and Rennie Citation2017).
Phototherapy is a conventional method that can be used to cure hyperbilirubinemia and jaundice. However, it may cause, Bronze Baby Syndrome, insensible water loss, disturbed sleep, oxidative stress, DNA damage, and electrolyte imbalance resulting in a discomforting environment for infants (Xiong et al. Citation2011; Kale et al. Citation2013; Ramy et al. Citation2016). Herbal treatment, on the other hand, is a relatively safe and reliable method for the management of hyperbilirubinemia. Cichorium intybus, Phyllanthus emblica L, Ziziphus jujuba Mill, Descurainia sophia L, Punica granatum L and many other plants are traditionally used as a remedy against jaundice (Gupta et al. Citation2014; Janghel et al. Citation2019; Jannat et al. Citation2019; Khedmat et al. Citation2021; Raghuvanshi et al. Citation2021).
The plants of the genus Phyllanthus contains various bioactive phytochemicals including phenolics, flavonoids, and phytosterols that possess anti-diabetic, anti-bacterial, anti-oxidant, anti-ulcerogenic, hepato-protective, gastro-protective properties. All parts of P. emblica are used for the treatment of jaundice, diarrhea, and inflammation. P. emblica leaf also possesses hepatoprotective potential due to the presence of phyllanthin and hypophyllanthin as bioactive constituents (Ahmad et al. Citation2021; Huang et al. Citation2021; Shanmugarajan et al. Citation2021). The present study was, therefore, designed to optimize the P. emblica leaf extract-assisted clearance of bilirubin from experimentally induced hyperbilirubinemic rabbit models.
Materials and methods
Materials
Chemicals and reagents
Phenyl hydrazine and methanol were purchased from Merck, Germany, ursodeoxycholic acid, ethanol, and formaldehyde from Fluka (Switzerland), and bilirubin assay kit from Randox Laboratories, UK. The chemicals were used as received without further purification.
Plant material
P. emblica leaves were obtained from a local nursery, identified by a Botanist from Bahauddin Zakariya University, Multan, Pakistan (Identification Voucher No. BZBOT0001510), brought to the research laboratory, cleaned with distilled water, and dried under shade at 25 ± 5 °C for one week (Nawaz et al. Citation2018). The dried samples were pulverized using a pestle and mortar and sieved through cheesecloth.
Study design
The study was divided into three phases 1) induction of hyperbilirubinemia in animals, 2) optimization of treatment of hyperbilirubinemic animals with P. emblica leaf extract (PELE), and 3) analysis of samples. The optimization of the PELE dose and sampling period to achieve maximum clearance of hyperbilirubinemia was done by RSM using a five-level bi-factorial (X1: extract dose and X2: sampling period) central composite design (CCD). RSM is a widely used suitable technique in the research field for the optimization of process variables based on a set of statistical and mathematical tools that can design, develop, and optimize a process. This methodology works with a reduced sample size and is more adventitious in the animals-based studies where it is mandatory to use a minimum number of animals (Taavitsainen Citation2012; Montgomery Citation2017). The RSM utilizes only significant combinations of the input variables and thus ensures the use of a relatively reduced number of animals. The CCD consisted of 4 factorial, 4 axial, and 5 center points. The five levels of the selected input factors were set at PELE dose: 0, 25, 50, 75, and 100 mg kg−1 bw, and sampling period: 24, 48, 72, 96, and 120 h. The bilirubin clearance (%) was taken as a response to the treatment of hyperbilirubinemia. The coded levels of the selected input variables at suggested levels were calculated using expression 1 (Montgomery Citation2017):
(1)
(1) Where,
is the center point location and
is scale interval while
is the particular level of the input factor. The coded value represented as
of variable
can be
.
The specific codes for each level of the selected input variables were calculated using expressions 2 and 3.
(2)
(2)
(3)
(3) A design matrix consisting of the coded and actual combinations of the selected input factors obtained from CCD using a statistical software Design-Expert version 9 (DX9, Stat-Ease, Inc. USA) is presented in Table .
Table 1. Experimental values of serum total bilirubin (STB) level of the control and hyperbilirubinemic animals before and after treatment at various combinations of extract dose and sampling period.
The levels of the input variables for optimal clearance of bilirubin were found by the method of numerical optimization. The coded optimum levels (COL) of variables obtained after optimization were converted to actual optimum levels (AOL) using the following expression (Gul et al. Citation2020).
(4)
(4) Where
and
are the interval between two actual levels and the central point of the actual levels of that variable respectively.
Preparation of plant extract
The P. emblica leaf powder (50 g) was extracted in 80% aqueous methanol (solid: solvent 1:10) for 48 h at 40 °C with occasional shaking. The PELE was evaporated to dryness in a water bath at 60 °C and stored in dark at 4 °C.
Experimental animals
White New Zealand albino male rabbits (n = 49, weight = 1 ± 0.2 kg, age = 6 ± 2 months) were purchased from a local pet market, acclimated in a natural underground environment (30 ± 2 °C temperature, 40-45% humidity and: 14/10 h light/dark duration) for one week. The animals were allowed to drink tap water ad libitum and feed on a blend of rice, barley, and wheat grains throughout the study period (Nawaz et al. Citation2016). The use of animals of the male sex was to avoid the physiological variation in the female during menstruation, pregnancy, and feeding.
Induction of hyperbilirubinemia
Hyperbilirubinemia was induced in animals by oral administration of phenyl hydrazine as a hemolytic agent (Nawaz et al. Citation2016) followed by an intraperitoneal injection of ursodeoxycholic acid as an inhibitor of UDP-glucuronyl transferase to prevent the hepatic conjugation of bilirubin with glucuronic acid. The induction of hyperbilirubinemia was confirmed by determining the elevation in the serum total bilirubin (STB) level (mg dL−1). The progress of phenyl hydrazine-induced hyperbilirubinemia was assessed by a dose-dependent response of bilirubin against phenyl hydrazine that was checked by treating 5 groups of animals (each consisting of 3 animals) with different doses (5, 10, 15, 20, and 25 mg kg−1 bw each repeated for three times) of phenyl hydrazine (10% phenyl hydrazine solution prepared in 20% ethanol). A set of 3 animals was left untreated as control.
Preliminary selection of the tolerable range of phenyl hydrazine dose
The range of phenyl hydrazine dose in which the animal survived and showed maximum induction of hyperbilirubinemia was selected by oral administration of different doses (5, 10, 15, and 20 mg kg−1 bw) of phenyl hydrazine (10% phenyl hydrazine solution prepared in 20% ethanol) to 4 groups of animals, each consisting of 3 animals (Table ). The dose was repeated after 24 h for 3–5 times in different cases. Based on physical observation, the range of phenyl hydrazine dose at which the animal survived with maximum elevation in the bilirubin level was selected for the optimization process.
Table 2. Preliminary selection of the tolerable dose of phenyl hydrazine for induction of hyperbilirubinemia.
Induction
A set of 16 animals was administered with the selected tolerable dose of phenyl hydrazine (10 mg kg−1 bw) followed by an intraperitoneal injection of ursodeoxycholic acid (10 mg kg−1 bw). The dose of phenyl hydrazine and ursodeoxycholic acid was repeated five times after an interval of 24 h and blood samples were taken after 24 h of the last dose (Nawaz et al. Citation2016). A group of 3 animals was left untreated as healthy control.
Treatment of hyperbilirubinemic animals
The hyperbilirubinemic animals (n = 13) were treated with PELE at various combinations of extract dose (0, 25, 50, 75, and 100 mg kg−1 bw) and sampling period (24, 48, 72, 96, and 120 h) as suggested by CCD. The treatment was repeated three times after an interval of 24 h. A group of 3 animals was left untreated as hyperbilirubinemic control.
Blood sampling
The blood samples (5 mL) were collected before and after induction of hyperbilirubinemia and after administration of PELE at selected levels of sampling period in gel and clot activator vacuumed tube (Y330984 IMPROVACUTER) by punching the middle vein of the ear with a sterile syringe needle (gauge: 22, length 1.5 in.) (Nawaz et al. Citation2016). The blood samples of the control animals were collected after 120 h of the initial sampling. Sera were collected in Eppendorf tubes by centrifugation at 4000 rpm for 20 min at room temperature (25 ± 2°C) and stored at −4°C in the dark until the determination of STB.
Determination of serum bilirubin
STB and serum direct bilirubin (SDB) were determined by the diazo-sulfanilic acid method (Ichida and Nobuka Citation1968) using a commercially available bilirubin kit (Randox, UK). The level of STB was calculated using the regression equation obtained from the standard curve of bilirubin
. The results were presented in terms of STB (mg dL−1). The degree of hyperbilirubinemia was calculated as the elevation in STB and the bilirubin clearance (%) was calculated using expression 5.
(5)
(5) where,
and
are the serum total bilirubin levels of the hyperbilirubinemic and PELE treated animals respectively.
Statistical analysis
The results for the dose-dependent response of bilirubin towards phenyl hydrazine were presented as a mean ± standard deviation of three parallel replicates. The relationship between phenyl hydrazine dose and elevation in the STB level was determined by regression analysis. The relationship between bilirubin clearance and PELE dose and sampling period was determined by developing a second-order polynomial quadratic response surface model. The suggested model finds the level of input variables in the region of optimal response. The following generalized polynomial regression equation was obtained after fitting the data in the suggested model.
(6)
(6) where,
is a constant that indicates the main effect, as
are the linear effects,
is the interaction effect while
are the quadratic effects of the input factors, and
. represents the predicted response.
The response of bilirubin clearance towards various combinations of the selected input variables was studied by one-way analysis of variance (ANOVA) and the significance of the model was suggested based on lack of fit test (F) at a probability (p) of 0.05. The variables with relatively larger F (>3.21) and smaller p-values (p < 0.05) are considered more significant. The adequacy of the suggested response surface model and fairness of fit of the data in the regression equation was checked by determining the coefficient of determination (R2) and adjusted coefficient of determination () respectively. Determination of coefficient of variation (CV) suggested the precision and reliability of the experimental runs reciprocally. The measurement of adequate precision indicated the signal-to-noise ratio in the experimental runs (Nawaz et al. Citation2016).
Results
Selection of tolerable dose of phenyl hydrazine
The experiments performed for the selection of the tolerable dose of phenyl hydrazine showed that the animal survived and showed safe tolerance and the reasonable response of STB elevation at an accumulative phenyl hydrazine dose of 50–60 mg kg−1 bw, distributed in 3–5 doses and repeated after an interval of 24 h (Table ). However, the animals showed a lethargic or anemic response at a phenyl hydrazine dose of 75–80 mg kg−1 bw and could not continue their survival at or above a dose of 100 mg kg−1 bw even distributed in 5 doses. A dose of 10 mg kg−1 bw repeated 5 times after an interval of 24 h was found to be most effective to generate reasonable data for the induction of hyperbilirubinemia. This dose was thus selected for further experimentation.
Dose-dependent response of STB towards phenyl hydrazine
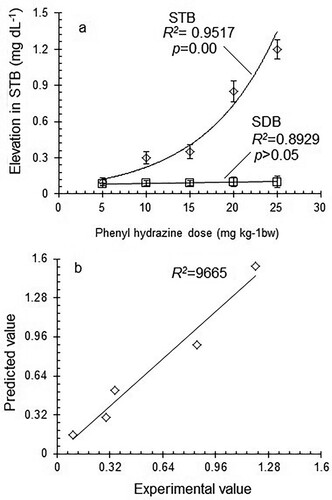
The dose-dependent response of STB towards phenyl hydrazine administration is presented in Figure a. In the experiments performed on five groups of animals (each consisting of three animals) treated at five levels of phenyl hydrazine dose varying from 5 to 25 mg kg−1 bw (each repeated three times), the STB level was found to be elevated from 0.1–1.2 mg dL−1. Regression analysis of the experimental data showed a statistically significant () exponential increase
in STB level in response to an increase in phenyl hydrazine dose from 5 to 25 mg kg−1 bw. However, no significant dose-dependent elevation in direct bilirubin was observed. The regression analysis of the experimental data yielded the following generalized exponential regression equation to explain the relationship between phenyl hydrazine dose and elevation in STB level.
(7)
(7) where
,
and
are the elevation sensitivity coefficient (slope), elevation in STB before induction, and phenyl hydrazine dose respectively. The sign and magnitude of the slope indicate the trend and extent of variation in STB in response to variation in phenyl hydrazine dose. After putting the values of
, and
for a particular level of
, the above equation was written as:
(8)
(8) The predicted values of elevation in STB were obtained from the above equation and plotted against the experimental values to test the validity of the suggested regression model (Figure b). A good agreement between experimental and predicted values of elevation in STB with a relatively higher degree of correlation (
) indicated the suitability and applicability of the suggested regression model to study the dose-dependent response of STB elevation towards phenyl hydrazine dose.
Figure 1. a) Dose-dependent response of serum total bilirubin (STB) and serum direct bilirubin (SDB) towards phenyl hydrazine, b) Correlation between experimental and predicted values of STB.
Induction of hyperbilirubinemia
The induction of hyperbilirubinemia in a set of 13 animals for the optimization process as suggested by the response surface CCD resulted in an elevation in the STB level from 0.405–1.138 mg dL−1. The hyperbilirubinemic animals were subjected to PELE treatment for optimization of the process variables to achieve maximum clearance of bilirubin.
Clearance of bilirubin
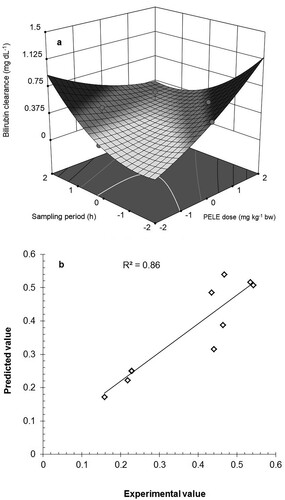
The process of PELE-assisted clearance of bilirubin was optimized by treating the hyperbilirubinemic animals at various combinations of PELE dose and sampling period as selected by CCD. The experimental values of STB of control, phenyl hydrazine-treated and PELE-treated animals, and bilirubin clearance at selected combinations of treatment variables are given in Table . PELE treatment at the various combinations of PELE dose and sampling period showed a decrease in the STB level of the hyperbilirubinemic animals from 0.158–0.542 mg dL−1 with mean ± standatd deviation of 0.334 ± 0.14 mg dL−1. A dose-dependent increase in bilirubin clearance was observed in response to an increase in PELE dose. However, the effect of the sampling period on bilirubin clearance was found to be nonsignificant.
The response surface analysis yielded the following second-order polynomial regression equation to show the empirical relationship of input variables with the response.
(9)
(9) The above regression equations contained the coefficient for intercept and the quadratic, linear, and interaction terms that has been presented graphically in Figure a. The sign and magnitude of the coefficients of estimates in the above equation determine the main, interaction, and quadratic effects of the treatment factors on bilirubin clearance. This polynomial regression equation was used to calculate the predicted value of bilirubin clearance at various combinations of the selected input factors. The applicability and validity of the suggested response-surface model were checked by plotting the experimental values of STB clearance against those predicted by the model (Figure b).
Figure 2. a) 3D response-surface plot of bilirubin clearance at selected combinations of PELE dose and sampling period, b) Agreement between the experimental and predicted values of bilirubin clearance PELE: P. emblica leaf extract.
One-way analysis of variance of the data showed a statistically significant variation in the STB level of the hyperbilirubinemic and PELE treated animals (F-value: 8.60, p-value: 0.007). An F-value >3.21 and a p-value <0.05 suggest the significance and applicability of the selected response surface quadratic model. The PELE showed a significant dose-dependent positive linear (F = 10.92, and p = 0.013) and negative interaction (F = 8.69, p = 0.022) effects on bilirubin clearance. The sampling period showed a significant time-dependent positive quadratic (F = 23.12, p = 0.002) effect on bilirubin clearance (Table ).
Table 3. Analysis of variance in STB in response to the selected input variables using a quadratic model.
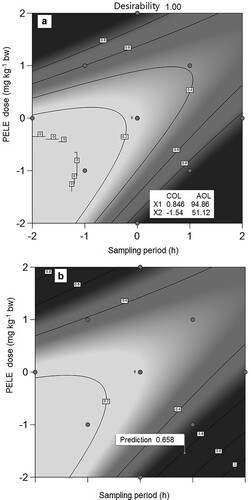
The coded and actual optimum levels of PELE dose and sampling period to achieve maximum clearance of bilirubin as predicted by the design are presented in Figure a, b. The treatment variables indicated that the maximum clearance of STB (0.658 mg dL−1) could be achieved using a PELE dose of 94.86 mg kg−1 bw and a sampling period of 51.12 h.
Figure 3. a) Graphical expressions of optimum levels of PELE dose and sampling period for optimal clearance of bilirubin at maximum desirability, b) Graphical prediction of bilirubin clearance at optimum levels of PELE dose and sampling period PELE: P. emblica leaf extract, COL: Coded optimum levels, AOL: Actual optimum levels.
Discussion
Phenyl hydrazine, being a hemolytic agent, has been reported to induce excess hemolysis in animals that leads to hyperbilirubinemia in animals (Shukla et al. Citation2012). To induce hyperbilirubinemia in animals, a dose-dependent response of bilirubin of STB towards phenyl hydrazine was studied. The regression analysis of the data showed a significant (p = 0.00) exponential increase () in STB in response to increase phenyl hydrazine dose. The correlation between the experimental values and those predicted by the regression model indicated the suitability and applicability of the suggested regression model to study the dose-dependent response of STB elevation towards phenyl hydrazine dose. The results suggested that significant induction of hyperbilirubinemia may be done in the studied range of phenyl hydrazine dose. However, the non-significant dose-dependent increase in direct bilirubin may be attributed to the inhibition of UDP glucuronyl transferase by ursodeoxycholic acid treatment.
Response surface analysis and optimization
The response surface analysis of the experimental data resulted in a statistically significant variation in the STB level of the hyperbilirubinemic and PELE treated animals. The significant dose-dependent positive linear and negative interaction effects of PELE and significant time-dependent positive quadratic effect of sampling period on bilirubin clearance suggest the significance and applicability of the selected response surface quadratic model. The regression coefficient (R²) was used to find the variability of the model in the observed response values. A value of R² closer to unity gives a better prediction of the response and high significance of the model. The calculated values of R² (0.860) indicated that 86% of the variability in bilirubin clearance as a function of selected input variables could be explained by the suggested response-surface model. The value of adjusted R² (Adj. R² = 0.7601) also advocates the significance of the model. A relatively lower value of the coefficient of variation (CV = 20.46%) and a higher value of adequate precision (AP = 7.831) suggest more reliability, precision, and reproducibility of experiments. The signal-to-noise ratio is given by adequate precision and a ratio greater than 4 is considered adequate for navigation of design space.
The plot of experimental values of STB clearance against those predicted by the response surface model showed a good correlation between the experimental and predicted values of the response with a relatively higher value of correlation coefficient (R2 = 0.860) that proves the applicability of the suggested model to study the influence of PELE on bilirubin clearance.
The suggested response surface model has been found successfully applicable for the optimization of PELE-assisted clearance of bilirubin from the animal body. It has significantly explained the relationship between the PELE dose, sampling period, and bilirubin clearance. The observed patterns of PELE-assisted bilirubin clearance may be attributed to the presence of some bioactive phytochemicals that facilitate the metabolic conjugation of bilirubin in hepatocytes. The PELE consists of bioactive phytochemicals including quercetin, methyl gallate, gallic acid, lupeol, naringenin-7-O-β-D-glucopyranoside and β- sitosterol (Zhang et al. Citation2013; Gupta et al. Citation2014). Due to strong antioxidant potential these phytochemical compounds reduce the hepatic load and improve liver functions including bilirubin conjugation and excretion (Tahir et al. Citation2016; Engwa Citation2018; Subramanya et al. Citation2018). The study provides a useful guideline for the researchers to extend the trials on humans for the management of hyperbilirubinemia in neonates and adults. It would be a novel contribution to the scientific literature regarding the therapeutic significance of P. emblica leaves and the management of hyperbilirubinemia.
Conclusion
Phenyl hydrazine and PELE were found to be effective in inducing hyperbilirubinemia and reducing hyperbilirubinemia in animals respectively. A phenyl hydrazine dose of 10 mg kg−1 bw repeated 5 times after an interval of 24 h was found to be tolerable and effective for the induction of hyperbilirubinemia. Phenyl hydrazine showed a significant dose-dependent increase in the STB level of rabbits while PELE treatment resulted in a significant dose-dependent decrease in the STB level of hyperbilirubinemic rabbits. The response-surface optimization showed a significant linear positive effect of PELE dose on bilirubin clearance. The optimal clearance of STB (0.658 mg dL−1) was achieved using a PELE dose of 94.86 mg kg−1 bw and a sampling period of 51.12 h. The results would be helpful in the biomedical field for the management of hyperbilirubinemia in neonates and adult humans.
Acknowledgments
The authors are grateful to the Department of Biochemistry, Bahauddin Zakariya University for providing basic facilities for the study.
Data availability statement
The data that support the findings of this study are openly available in Mendeley Data at https://www.doi.org/10.17632/x6ghb4m8v3.1 (Nawaz Citation2021, Mendeley Data).
Disclosure statement
No potential conflict of interest was reported by the author(s).
Ethical statement
The study was approved by the Advanced Studies and Research Board and Departmental Ethical Committee for the care and use of the animals in the study (Ethical Approval No. Biochem/110/2018). Strict adherence to the protocols recommended by the Committee was ensured and the animals were treated humanely.
Additional information
Funding
Related Research Data
References
- Abbas MW, Shamshad T, Ashraf MA, Javaid R. 2016. Jaundice: a basic review. Int J Res Med Sci. 4(5):1313–1319.
- Ahmad B, Hafeez N, Rauf A, Bashir S, Linfang H, Rehman M, Mubarak MS, Uddin MS, Bawazeer S, Shariati MA. 2021. Phyllanthus emblica: A comprehensive review of its therapeutic benefits. S Afr J Bot. 138:278–310.
- Berthelot P, Duvaldestin P, Fevery J. 1982. Physiology and disorders of human bilirubin metabolism. In: Bilirubin. CRC Press, Boca Raton, Florida; p. 173–214.
- Chee YY, Chung PH, Wong RM, Wong KK. 2018. Jaundice in infants and children: causes, diagnosis, and management. Hong Kong Med J. 24(3):285–292.
- Chowdhury NR, Li Y, Chowdhury JR. 2020. Disorders of bilirubin metabolism. The liver: biology and pathobiology: 229–244.
- Edris AA, Ghany EA, Razek AR, Zahran AM. 2014. The role of intensive phototherapy in decreasing the need for exchange transfusion in neonatal jaundice. J Pak Med Assoc. 64(1):5–8.
- Engwa GA. 2018. Free radicals and the role of plant phytochemicals as antioxidants against oxidative stress-related diseases. Phytochemicals: Source of Antioxidants and Role in Disease Prevention BoD–Books on Demand. 7:49–74.
- Gul S, Shad MA, Arshad R, Nawaz H, Ali A, Altaf A, Gul T, Iqbal W. 2020. Response surface optimization of prodigiosin production by mutagen-treated Serratia marcescens in different growth media. Pharmacogn Mag. 16(68):99.
- Gupta J, Gupta A, Gupta AK. 2014. Studies on the chemical constituents of leaves of Phyllanthus emblica (L.). Orient J Chem. 30(4):2069–2071.
- Huang H-Z, Qiu M, Lin J-Z, Li M, Ma X, Ran F, Luo C-H, Wei X, Xu R, Tan P. 2021. Potential effect of tropical fruits Phyllanthus emblica L. for the prevention and management of type 2 diabetic complications: a systematic review of recent advances. Eur J Nutr. 60:1–18.
- Ichida T, Nobuka M. 1968. Hyperbilirubinemia in Neonates: Types, Causes, Clinical Examinations, Preventive Measures and Treatments: A Narrative Review Article. Clin Chim Acta. 19(2):249–255.
- Janghel V, Patel P, Chandel SS. 2019. Plants used for the treatment of icterus (jaundice) in Central India: A review. Ann Hepatol. 18(5):658–672.
- Jannat K, Shova NA, Islam MM, Jahan R, Rahmatullah M. 2019. Herbal formulations for jaundice treatment in Jamalpur district, Bangladesh. J Med Plants. 7(2):99–102.
- Kale Y, Aydemir O, Celik Ü, Kavurt S, Isikoglu S, Bas AY, Demirel N. 2013. Effects of phototherapy using different light sources on oxidant and antioxidant status of neonates with jaundice. Early Hum Dev. 89(12):957–960.
- Khedmat L, Mojtahedi SY, Moienafshar A. 2021. Recent clinical evidences in the herbal therapy of neonatal jaundice in Iran: A review. J Herb Med. 29:100457.
- Mitra S, Rennie J. 2017. Neonatal jaundice: aetiology, diagnosis and treatment. Br J Hosp Med. 78(12):699–704.
- Montgomery DC. 2017. Design and analysis of experiments. John wiley & sons, New York.
- Nawaz H. 2021. Phyllanthus emblica L. leaf extract-assisted clearance of hyperbilirubinemia in White New Zealand albino rabbits - Mendeley Data. [accessed 2021 Dec 12]. https://www.doi.org/10.17632/x6ghb4m8v3.1.
- Nawaz H, Shad MA, Iqbal MS. 2016. Optimization of phenylhydrazine induced hyperbilirubinemia in experimental rabbit. Exp Anim. 65(4):363–372.
- Nawaz H, Shad MA, Rauf A. 2018. Optimization of extraction yield and antioxidant properties of Brassica oleracea Convar Capitata Var L. leaf extracts. Food Chem. 242:182–187.
- Raghuvanshi D, Dhalaria R, Sharma A, Kumar D, Kumar H, Valis M, Kuča K, Verma R, Puri S. 2021. Ethnomedicinal Plants Traditionally Used for the Treatment of Jaundice (Icterus) in Himachal Pradesh in Western Himalaya—A Review. Plants. 10(2):232.
- Ramy N, Ghany EA, Alsharany W, Nada A, Darwish RK, Rabie WA, Aly H. 2016. Jaundice, phototherapy and DNA damage in full-term neonates. J Perinatol. 36(2):132–136.
- Shanmugarajan D, Girish C, Harivenkatesh N, Chanaveerappa B, Prasanna Lakshmi NC. 2021. Antihypertensive and pleiotropic effects of Phyllanthus emblica extract as an add-on therapy in patients with essential hypertension—A randomized double-blind placebo-controlled trial. Phytother Res. 35(6):3275–3285.
- Sharma J, Gairola S, Gaur RD, Painuli RM. 2012. The treatment of jaundice with medicinal plants in indigenous communities of the Sub-Himalayan region of Uttarakhand, India. J Ethnopharmacol. 143(1):262–291.
- Shukla P, Yadav NK, Singh P, Bansode FW, Singh RK. 2012. Phenylhydrazine induced toxicity: a review on its haematotoxicity. Int J Basic Appl Med Sci. 2(2):86–91.
- Subramanya SB, Venkataraman B, Meeran MFN, Goyal SN, Patil CR, Ojha S. 2018. Therapeutic potential of plants and plant derived phytochemicals against acetaminophen-induced liver injury. Int J Mol Sci. 19(12):3776.
- Taavitsainen V-MT. 2012. Experimental optimization and response surfaces. Chemometrics in Practical Applications. 91–138.
- Tahir I, Khan MR, Shah NA, Aftab M. 2016. Evaluation of phytochemicals, antioxidant activity and amelioration of pulmonary fibrosis with Phyllanthus emblica leaves. BMC Complement Altern Med. 16(1):1–12.
- Ullah S, Rahman K, Hedayati M. 2016. Hyperbilirubinemia in neonates: types, causes, clinical examinations, preventive measures and treatments: a narrative review article. Iran J Public Health. 45(5):558.
- Wolkoff AW. 2014. Bilirubin metabolism. Gastrointestinal Anatomy and Physiology. 173–182.
- Woodgate P, Jardine LA. 2015. Neonatal jaundice: phototherapy. BMJ Clin Evid. 2015:1–21.
- Xiong T, Qu Y, Cambier S, Mu D. 2011. The side effects of phototherapy for neonatal jaundice: what do we know? What should we do? Eur J Pediatr. 170(10):1247–1255.
- Zhang Y, Liang R, Zhao Q, Hong A, Wang Y, Cen Y. 2013. Chemical constituents from the fresh leaves of Phyllanthus emblica L. Lishizhen Med Mater Med Res. 24(12981300):26.