
ABSTRACT
Glioblastoma is the most fatal of all primary human brain tumors, with a 14-month median survival. The mainstay therapy for this tumor involves temozolomide, surgery, radiotherapy, and tumor-treating electric field. Cancer resistance to commonly available chemotherapeutics remains a major challenge in glioblastoma patients receiving treatment and unfavorably impacts their overall survival and outcome. However, the lack of progress in this area could be attributed to the lack of tools to probe unbiasedly at the genome-wide level the coding and non-coding elements’ contribution on a large scale for factors that control resistance to chemotherapeutics. Understanding the mechanisms of resistance to chemotherapeutics will enable precision medicine in the treatment of cancer patients. CRISPR Cas9a has emerged as a functional genomics tool to study at the genome level the factors that control cancer resistance to drugs. Recently, we used genome-wide CRISPR-Cas9a screen to identify genes responsible for glioblastoma susceptibility to etoposide. We extended our inquiry to understanding genes that control glioblastoma response to temozolomide using the genome-scale CRISPR. This study shows that the unbiased genome-wide loss of function approach can be applied to discover genes that influence tumor resistance to chemotherapeutics and contribute to chemoresistance in glioblastoma.
Introduction
Glioblastoma is the deadliest of all primary brain tumors with very poor survival outcomes. Temozolomide, an alkylating agent, is used as a mainstay drug in treating glioblastoma patients and radiation, tumor-treating field and surgery (Verhaak et al. Citation2010; Stupp et al. Citation2017). This drug offers a survival benefit to 47% of glioblastoma patients with MGMT promoter methylation. However, in 53% of the glioblastoma patients, the methylation status of MGMT promoter doesn’t predict response to this drug-temozolomide. Hence, the objective of the generation of these data is to understand and uncover genes that control glioblastoma susceptibility and resistance to temozolomide using an unbiased genome-scale CRISPR Cas9a knockout screen.
Material and methods
Details of source of all samples
Cell lines: The glioma cell line, U251, was commercially obtained from ATCC and used in the genome-scale CRISPR screen. We also performed a dose-dependent drug response experiment with temozolomide across glioma cell lines (Supplementary Figure 1).
Reagent: The U251 cells were grown in 10% FBS DMEM media with antibiotics up to 80% confluency before downstream analysis.
CRISPR Knockout library: The Brunello library pooled gRNA (Cat no: 73178-LV) was commercially purchased from Addgene. This library contains 70,000 sgRNA, with 60,000 guides targeting approximately the 20,000 genes in the human genome at the rate of 3–4 guides per gene. There are about 10,000 guides that are the non-targeting controls.
Determination of viral titer and multiplicity of infection: 3 × 10⁶ of U251 cells are seeded into a 12-well plate in 2 ml. The Brunello library was added as the virus supernatant at 400 µl, 200 µl, 100 µl, 75 µl, 50 µl, 25 µl and 8 µg/µl of polybrene is and spinfected at 1000 g at 33°C for 2 h. Cells then are incubated at 37°C. After 24 h the cells are harvested and seeded at 4 × 10³ with puromycin for 96 h with a well-containing cells that were not transduced with any virus. After 96 h the cell titer glo Promega (cat no G7570) is used to determine cell viability at MOI 21%. At the multiplicity of infection (MOI) of 21% we are able to infect 1 sgRNA/cell (Figure (A–C)).
Figure 1. Strategy for genome-scale CRISPR screen. (A) shows the schematic depiction of the sgRNA library. (B) Library is packaged into lentiviral. (C) Viral titer and MOI are determined. (D) A gel shows amplification of the sgRNA library. (E) Lentivirus containing sgRNA is spinfected into glioma cells. (F) Transduced cells are selected with puromycin, after which some cells are harvested for baseline sgRNA representation. The rest of the cells are placed under the treatment of temozolomide/DMSO/puromycin for 14 days. (G) Cells are harvested, sgRNA extracted and sequenced on NEXT-generation sequencers.
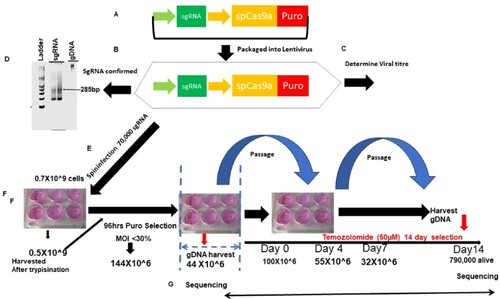
Figure 2. Kinetics of cell selection pressure under chemotherapy in genome-scale CRISPR screen. (A) shows the schematic depiction of the number of T225 flask of cells starting from over half a billion cells to the number that remains after 14 days of selection.
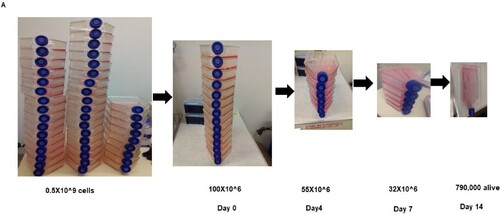
Genome-wide scale CRISPR-Cas9a knockout screen: To do the CRISPR screen, we expanded the U251 to 500 million cells and then spinfected them with 70,000 sgRNA. The library was integrated into the cells by spinfection, and subsequently selected with 0.6 µg/ml of puromycin for 4days. This is aimed at the cells that have been rightly integrated with the sgRNA that incorporates the puromycin cassette into their genome. We achieved an MOI of 21% in two independent screens. At the end of day 4, about a 150 million cells survived the selection. We used 50 million selected cells for the extraction of genomic DNA. The base sgRNA representation is obtained by the amplification of the sgRNA with unique barcoded primers. The remaining 100million cells were expanded for 2 days once cells grew to 300 million. One hundred million cells were treated with temozolomide at a concentration of 700 µM for 14 days. The 100 million cells were treated with DMSO and Puromycin for 14 days, respectively and served as control. DMSO is controlled for temozolomide-treated cells, whereas puromycin is for the identification of essential genes driving glioma. After 14 days, the cells were harvested, the gDNA extracted, and the sgRNA was amplified with another unique barcoded primer (Figure (D–G); Figure (A), Figure (A–B)).
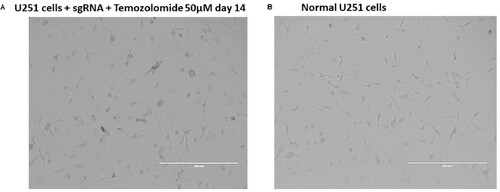
Figure 3. Morphology of cells transduced with CRISPR library under drug selection compared to wild-type control. (A) shows U251 cells transduced with sgRNA treated with temozolomide for 14 days, and (B) shows normal U251 wild-type controls.
DNA extraction and PCR amplification of pooled sgRNA: The genomic DNA (gDNA) was extracted with the Zymo Research Quick-DNA midiprep plus kit (Cat No: D4075). gDNA was further cleaned by precipitation with 100% ethanol with 1/10 volume 3M sodium acetate, PH 5.2 and 1:40 glycogen co-precipitant (Invitrogen Cat No: AM9515). The gDNA concentration was measured by Nanodrop 2000 (Thermo Scientific). The PCR was set up as follows:
50 µl reaction
5 µl of 10× buffer
4 µl of 50 mM DNTP (1/25)
0.5 µl of P5 forward primers’ equimolar mix
10 µl of 20 µM reverse primer (1 per experimental condition)
gDNA (20 ng for sgRNA library) or 2–10 µg for sgRNA in various experimental conditions
1.5 µl of Extaq enzyme
27 µl of H20
With NEBNEXT PCR polymerase enzyme, the following recipe is used:
25 µl of NEB Next High Fidelity Master Mix (2×)
1 µl of gDNA (20 ng for sgRNA library) or 2–10 µg for sgRNA in various experimental conditions
1.25 µl of P5 forward primers’ equimolar mix
1.25 µl of 20 µM reverse primer (1 per experimental condition)
21.5 µl ultrapure H20
The sequences of P5 forward primers and the reverse primers can be found as described by Joung et al. (Citation2017).
The PCR cycle used is as follows:
Don’t exceed 23 cycles. We have found that difficulty in gDNA containing sgRNA can be amplified using an annealing temperature gradient of 53–68°C. The sgRNA knockout size is 285bp. All extracted gDNA from the cells was amplified to maintain the library coverage.
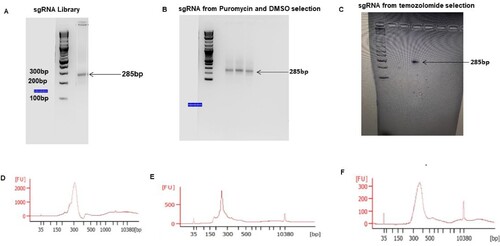
Next-Generation Sequencing: The sgRNAs amplified and gel extracted from Figure were pooled together and sequenced in a Next-generation sequencer (Next Seq) at 300 million reads for the four sgRNA pool aiming at 1000 reads/sgRNA. The samples were sequenced according to the Illumina user manual with 80 cycles of read 1 (forward) and 8 cycles of index 1 (Joung et al. Citation2017; Awah et al. Citation2020). 20% PhiX was added on the Next Seq to improve library diversity and aiming for coverage of >1000 reads per SgRNA in the library.
Figure 4. PCR amplification of sgRNA from the library, puromycin, DMSO and temozolomide-selected glioblastoma: (A–C) shows agarose gel pic of the sgRNA amplified from the library, puromycin, DMSO and temozolomide-treated cells. (D–F) shows electropherogram measurement of the amplified sgRNA from different conditions.
CRISPR screen data analysis: All data analyses were performed with the bioinformatics tool CRISPR Analyzer (http://crispr-analyzer.dkfz.de/) (Winter et al. Citation2017).
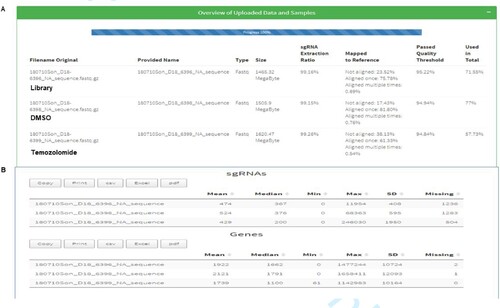
The sequence reads obtained from Next Seq as fastq files were aligned with the human genome in quality assessment to determine the percentage that maps to the total human genome (Figure ).
Figure 5. Alignment of Next Seq sgRNA reads from the library, DMSO and temozolomide-treated cells. (A) shows the mapping of sgRNA library (75.78%) DMSO (81.8%) and temozolomide (61.33%) mapped to the human reference genome. (B) shows the number of genes and sgRNA missing from the mapped library, which were few.
To find genes that were enriched or depleted under various treatment conditions, the CRISPR Analyzer performs four rigorous statistical analyses: (1) DeSeq 2 (Log2 fold sgRNA count) 3 (Wilcoxon t-test) and 4 (Z-ratio) comparing the enrichment of guides in treatment conditions versus their non-targeting controls. p-Value of .05 is used as a cut-off for statistical enrichment for guides. The sgRNA that does not meet a read count of 20 is removed. Hit calling from the CRISPR screen was done based on sgRSEA enriched, p < .05 was used for significance based on Wilcoxon test.
To set up the analysis, the sgRNA reads (library, puromycin, DMSO and temozolomide) replicates were loaded onto the software.
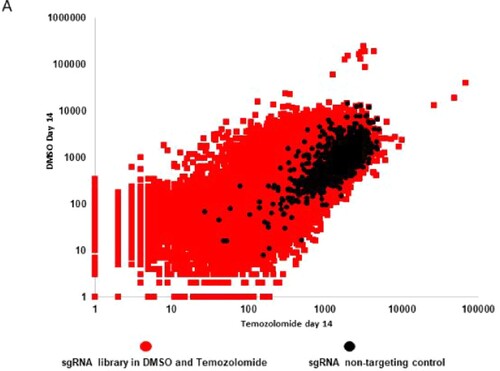
CRISPR Analyzer also does correlation analysis based on Pearson and Spearman statistical analysis to determine the relatedness between samples replicates and then uses log2 fold SgRNA read count to calculate the cumulative frequency between guides in other treated samples compared to controls. The results are presented as a cumulative frequency curve (Figure ) and in a scatter plot (Figure ).
Figure 6. Cumulative frequency of sgRNA distribution in CRISPR library, DMSO and temozolomide-treated glioblastoma cells. A shows a cumulative frequency distribution of log 2 sgRNA read count in sgRNA library (red), sgRNA DMSO (blue) and sgRNA temozolomide (green).
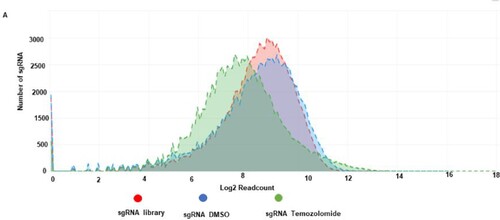
Figure 7. Scatter plot distribution of sgRNA in DMSO versus temozolomide-treated glioblastoma cells. A Scatter plot depicting sgRNA distribution in DMSO (y-axis) and temozolomide (x-axis) and their non-targeting controls (black dots).
Dataset validation
To validate the data from the screen, we found that NSUN6 a 5mC RNA methyltransferase is enriched in the CRISPR screen under temozolomide compared to DMSO and puromycin selection for 14 days. We performed a single gene editing of NSUN6 and proved that loss of NSUN6 led to the loss of 5mC and caused resistance to temozolomide. These data have been presented in the primary article (Awah et al. Citation2021a).
Software availability
CRISPR Analyzer, the software used in this data analysis, is publicly available at http://crispr-analyzer.dkfz.de/.
Acknowledgement
We acknowledge our colleagues who provided support in the cell culture.
Disclosure statement
No potential conflict of interest was reported by the author(s).
Data availability statement
The data that support the findings of this study are available in the Zenodo repository at https://doi.org/10.5281/zenodo.5167143. Data 1: 5953 DMSO Day 14 Rep2; Data 2: 6377 Library; Data 3: 6396 Puromycin Day 0; Data 4: 6397 Puromycin Day 14; Data 5: 6398 DMSO Day 14 Rep1; Data 6: 6399 Temozolomide Day 14.
Correction Statement
This article has been corrected with minor changes. These changes do not impact the academic content of the article.
Additional information
Funding
References
- Awah CU, Chen L, Bansal M, Mahajan A, Winter J, Lad M, Warnke L, Gonzalez-Buendia E, Park C, Zhang D, Feldstein E. 2020. Ribosomal protein S11 influences glioma response to TOP2 poisons. Oncogene. 2020 Jul 39(27):5068–5081.
- Awah CU, Winter J, Mazdoom CM, Ogunwobi OO. 2021a. NSUN6, an RNA methyltransferase of 5-mC controls glioblastoma response to temozolomide (TMZ) via NELFB and RPS6KB2 interaction. Cancer Biol Ther. 39.
- Joung J, Konermann S, Gootenberg JS, Abudayyeh OO, Platt RJ, Brigham MD, Sanjana NE, Zhang F. 2017. Genome-scale CRISPR-Cas9 knockout and transcriptional activation screening. Nat Protoc. 12(4):828–863.
- Stupp R, Taillibert S, Kanner A, Read W, Steinberg DM, Lhermitte B, Toms S, Idbaih A, Ahluwalia MS, Fink K, Di Meco F. 2017. Effect of tumor-treating fields plus maintenance temozolomide vs maintenance temozolomide alone on survival in patients with glioblastoma: a randomized clinical trial. JAMA. 318(23):2306–2316.
- Verhaak RG, Hoadley KA, Purdom E, Wang V, Qi Y, Wilkerson MD, Miller CR, Ding L, Golub T, Mesirov JP, Alexe G. 2010. Integrated genomic analysis identifies clinically relevant subtypes of glioblastoma characterized by abnormalities in PDGFRA, IDH1, EGFR, and NF1. Cancer Cell. 17(1):98–110.
- Winter J, Schwering M, Pelz O, Rauscher B, Zhan T, Heigwer F, Boutros M. 2017. CRISPRAnalyzer: interactive analysis, annotation, and documentation of pooled CRISPR screens. BioRxiv. 2017:109967.