
Abstract
Topping and salicylic acid (SA) treatment are thought to change nicotine content in Nicotiana tabacum L. (tobacco). This study aimed to investigate the potential underlying molecular mechanisms. Tobacco variety K326 plants were divided into four groups, each receiving only the topping treatment (TW), the topping and 0.6 mM SA treatment (TS), the 0.6 mM SA treatment only (NS), and no treatment (control group, NW). The content of alkaloids and expression of genes related to nicotine synthesis were determined through gas chromatography-hydrogen flame ionization and liquid chromatography mass spectrometry. Differentially expressed and differentially expressed genes (DEGs) were screened and analyzed between different groups. Finally, we constructed a DEG-pathway-differential metabolite network using Cytoscape. While SA treatment decreased the expression of genes related to nicotine synthesis and alkaloid content, topping showed the opposite results: transcriptome and metabolome analyses showed that both changed a variety of biological pathways and related gene expression in tobacco, including arginine and proline metabolism, tropane, piperidine and pyridine alkaloid biosynthesis, nicotinate and nicotinamide metabolism, glutathione metabolism, biotin metabolism, phenylpropanoid biosynthesis, and plant hormone signal transduction. This study provides new insights for understanding how topping and SA treatment affect nicotine content in tobacco and provides a direction for future breeding.
Introduction
Apical dominance is a phenomenon in plants that regulates the preferential growth of apical buds and inhibits the growth of lateral branches. When the apical advantage is lost, the side branches grow rapidly (Barbier et al. Citation2017). In the cultivation of Nicotiana tabacum L. (tobacco), an important economic crop, topping is an important agronomic measure to improve the quality and yield of tobacco leaves (Qi et al. Citation2012). When the first flower appears in a tobacco plant, the whole inflorescence and young leaves are removed (Li et al. Citation2016). After the plant is topped, the apical source of auxin disappears, so the auxin transport capacity in the main stem improves, and the dormant axillary buds start to release auxin themselves (Gaudreau et al. Citation2020). The topping process causes many reactions in tobacco plants, including increased nicotine biosynthesis and secondary root growth. Nicotine is mainly produced in tobacco roots and is then transported to the leaves. Studies have reported that the activities of nicotine synthesis-related enzymes in tobacco, including putrescine N-methyltransferase (PMT), ornithine decarboxylase (ODC), s-adenosylmethionine synthase, and quinolinate phosphoribosyl transferase (QPT), increase after topping (DeBoer et al. Citation2011; Geng et al. Citation2018; Khan et al. Citation2017).
Salicylic acid (SA) is a hormone widely distributed throughout the plant kingdom. The currently known roles of SA include seed germination, growth regulation, flowering induction, and regulation of plant responses to biotic and abiotic stresses (Janda et al. Citation2020). Plants accumulate SA in response to pathogens to gain systemic acquired resistance, which promotes plant growth and stimulates plant defense mechanisms (Denancé et al. Citation2013; Islam et al. Citation2020). It has been reported that the SA application results in a decrease in the nicotine content in field cultivation compared to controls (Liang et al. Citation2013). Jasmonic acid (JA) is an important plant hormone that participates in defense mechanisms of most plants. JA signaling can interact with other plant hormone signaling pathways and participate in mediating massive transcription and metabolic remodeling of plants after injury (such as that brought by herbivore feeding) (Wang and Wu Citation2013). The JA signaling pathway is involved in the biosynthesis of specific metabolites, including nicotine, in a variety of plants (Sui et al. Citation2019b). JA treatment also induced the synthesis of alkaloids in tobacco (Dewey and Xie Citation2013). JA regulates the expression of nicotine biosynthesis genes through MYC2 and JA ZIM domain inhibition systems (Chen et al. Citation2018). Whether SA affects the synthesis of nicotine in tobacco by triggering the JA signaling pathway requires further study.
Besides being a secondary metabolite of the tobacco stress response by helping plants resist insects and herbivores (Zeng et al. Citation2020), nicotine is also the main addictive substance in tobacco products and is a key ingredient in medical and biochemical reagents (Kohut Citation2017). As tens of thousands of deaths per year are related to smoking nicotine-rich products (Benowitz Citation2009; Valentine and Sofuoglu Citation2018), reducing nicotine content in tobacco has long been the focus of research. While existing research proves that topping can increase the secondary growth of tobacco roots and nicotine content and exogenous application of SA can reduce nicotine content (Li et al. Citation2016), increasing tobacco production while reducing nicotine content is challenging. This study intends to study the effects of topping and of SA application on the transcriptome and metabolome of tobacco, in order to reveal the potential molecular mechanisms underlying their effects on tobacco nicotine content (Supplementary Figure 1).
Materials and methods
Plant materials
The tobacco seeds (variety K326) were sterilized twice in 2% sodium hypochlorite for 5 min, and then planted in seedling trays filled with the substrate. After the growth of 4–5 tobacco leaves per plant, strong seedlings with uniform growth were selected and transplanted into a flower pot filled with the substrate, then cultivated with 12/12 h day/night cycles at 22°C to 28°C, 800 μmol m-2s-1 light, and 85% humidity. The experiment was carried out in the climate room of the National Research Base of Tobacco Cultivation Physiology and Biochemistry, Henan Agricultural University, China.
Experimental design
Tobacco plants with nine leaves were selected and divided into four groups. Group one (TW) was assigned the topping treatment only; group two (TS) was topped and treated with 0.6 mM SA; group three (NS) only received 0.6 mM SA; group four (NW) was set as the control group and only received water, which was equivalent to the SA used in the NS and TS groups. In the NS group both the front and back of the tobacco leaf surface were treated until the solution on the leaf formed uniform droplets. The leaves and roots were collected 24 h and 5 days after treatment and stored in liquid nitrogen for later use. Five tobacco plants were selected for each treatment, with three replicates each.
Detection of the alkaloid content
Lyophilized tobacco root samples (200 mg) were ground, and 2 mL of 2 N NaOH solution was added to each flask. After 15 min of rest, 10 mL of methyl tertbutyl ether (MTBE) containing 0.1062 g mL-1 quinoline was added to the flask. Then, the flask was shaken well and left to rest overnight. Finally, 1 mL of the top MTBE layer was transferred into a vial, and a gas chromatography-hydrogen flame ionization detector (GC-FID) (Agilent 7890A, Agilent Technologies, Santa Clara, CA, USA) system was used to quantify the content of nicotine in root samples (Sui et al. Citation2019a).
Metabolite extraction and liquid chromatography mass spectrometry (LC-MS)
The lyophilized sample (50 mg) was ground and added to 400 μL of extracting solution (methanol:water =4:1, v:v) containing 0.02 mg mL-1 2-Chloro-L-phenylalanine. After 30 min of cold ultrasonic extraction, the sample was left to rest for 30 min at −20°C (Ianculov et al. Citation2005). Finally, the supernatant was taken from the sample after centrifugation (15 min, 13000 g, 4°C) and used for LC-MS analysis (Ianculov et al. Citation2004).
In this study, ultrahigh-performance liquid chromatography coupled with Q Exactive HF-X mass spectrometry (UHPLC-QE/MS, Thermo Fisher Scientific, Waltham, MA, USA) system equipped with an ACQUITY UPLC HSS T3 column (100 mm × 2.1 mm, 1.8 µm; Waters Corporation, Milford, MA, USA) was used to perform the LC-MS analysis. The mobile phase consisted of solvents A (95% H2O, 5% acetonitrile, and 0.1% formic acid) and B (47.5% acetonitrile, 47.5% isoacetone, and 0.1% formic acid). The elution gradient program for samples was: 0–24.5% B, 0–3.5 min; 24.5–65% B, 3.5–5 min; 65–100% B, 5–5.5 min; 100% B, 5.5–7.4 min; 100–51.5% B, 7.4–7.6 min; 51.5–0% B, 7.6–10 min. The sample was ionized by electrospray and mass spectrometry signals were collected in the positive and negative ion scanning modes, respectively. The specific parameters were as follows: scan type, 70–1050 m/z; sheath gas flow rate, 50 arb; Aux gas flow rate, 13 arb; heater temperature, 425°C; capillary temperature, 325°C; spray voltage (+), 3500 V; spray voltage (−), −3500 V; S-Lens RF level, 50; normalized collision energy, 2, 40, and 60 eV; resolution, 60000 full MS; resolution, 7500 MS2.
Differential metabolite analysis
Partial least squares discriminant analysis (PLS-DA) is a multivariate statistical analysis method used for discriminant analysis to build a model of the relationship between the expression level of metabolites and the sample category to predict the behavior of the latter. In this study, we used PLS-DA to identify outliers and distinguish clusters of samples with high similarity. The variable importance in projection value ≥ 1 was set as the threshold for differential metabolite screening.
RNA isolation and sequencing
Total RNA was isolated from leaf and root samples stored in liquid nitrogen. The sample was ground into a powder using a mortar and pestle. RNA was extracted using TRIzol reagent (Invitrogen Life Technologies, Maltham, MA, USA) according to the manufacturer’s instructions (Vennapusa et al. Citation2020 oct). The concentration and purity of the isolated RNA were tested using Nanodrop2000. The Illumina TruseqTM RNA sample prep kit was used to construct the library. The amplified leaf cDNA libraries were sequenced on an Illumina Novaseq 6000 sequencing platform.
Quality control and reads mapping
Raw reads obtained by sequencing were filtered. Adaptors, bases with a mass value of less than 30 at the end of the sequence, reads with an N ratio over 10%, and sequences shorter than 50 bps after adapter removal and mass trimming were eliminated. The clean reads were mapped onto the Nicotiana tabacum K326 genome (https://www.ncbi.nlm.nih.gov/assembly/GCA_000715075.1/) using TopHat2 (http://tophat.cbcb.umd.edu/). Based on the existing reference genome, StringTie software (http://ccb.jhu.edu/software/stringtie/) was used to assemble and splice the mapped reads.
Gene annotation and differentially expressed genes (DEGs) screening
All mapped sequences were subjected to a similarity search against major public databases, including Gene Ontology (Denny and Feuermann Citation2018), Kyoto Encyclopedia of Genes and Genomes (KEGG) (Kanehisa and Goto Citation2000), the National Center for Biotechnology Information Search Database (NCBI) non-redundant protein, Swiss-Prot database, and Pfam database. Fragments per kilobase per million reads were set as a standard to measure gene expression. Based on gene expression levels, DEGs between the groups were obtained using DESeq2. The thresholds of |log2FC (fold change)| ≥1 and p < 0.05, were set as the criterion for significant differential expression.
KEGG analysis of differential metabolites and DEGs
All differential metabolites and DEGs were mapped using the KEGG database (http://www.genome.jp/kegg/). KEGG pathway assignments were carried out using SciPy software (version 1.0.0) with default parameters (Virtanen and Gommers Citation2020). Fisher's exact test was used for enrichment analysis and corrected with the Bonferroni correction. A corrected p<0.05 was considered as the enrichment threshold.
Association analysis of transcriptome and metabolome
The enrichment pathways shared by the results of KEGG enrichment analysis of the transcriptome and metabolome were screened and correlation analysis of the DEGs and differential metabolites with shared pathways was performed. We also calculated the Pearson correlation coefficients and performed a correlation test. The relationship pairs with p < 0.05 and |r|>0.95 were selected for further analysis. Finally, the DEG-metabolite regulatory network was constructed using Cytoscape software (version 3.6.1) (Shannon et al. Citation2003).
Functional integration analysis of the transcriptome and metabolome
We screened the DEGs and differential metabolites that participated in the DEG-differential metabolite network constructed in the previous step. Then, we used these pathways, DEGs, and differential metabolites to construct a DEGs-KEGG pathways-differential metabolite regulatory network using Cytoscape software (version 3.6.1) (Shannon et al. Citation2003).
Detection of genes related to nicotine synthesis
The relative expression of eight genes (ADC, ODC, PMT, QPT, 622, BBLa, BBLc, and LDC) related to nicotine synthesis was detected by quantitative reverse transcription PCR (RT-qPCR). PCR was performed using a fluorescence quantitative PCR instrument (7900HT FAST, ABI, Vernon, CA, USA). The primer information of the detected genes is shown in Supplementary Table 1. Actin was used as the internal reference gene.
Results
Alkaloid content detection
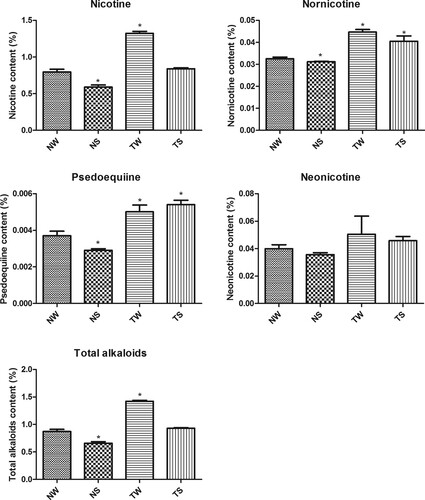
The contents of nicotine, nornicotine, psedoequiine, neonicotine, and total alkaloids in tobacco were measured (Figure ); in the NS group all, except for neonicotine, were significantly lower than those of the control group (p < 0.05). However, in the TW group the contents of nicotine, nornicotine, psedoequiine, and total alkaloids were significantly higher than those in the control group (p < 0.05). Except for psedoequiine, the content of other alkaloids in the TS group decreased compared with that of the TW group.
Figure 1. Tobacco alkaloid content under different treatments TW, tobacco group subjected to topping treatment only; TS, tobacco group treated by topping and 0.6 mM SA; NS, tobacco group only receiving 0.6 mM SA; NW, control group.
Ion content with LC-MS detection
With LC-MS detection, 15078 peaks were obtained. A total of 566 identified metabolites for LC-MS in the positive ion model were detected, of which 469 were annotated in the public database and 171 were annotated in the KEGG database. In the negative model, 252 metabolites were identified, of which 215 were annotated in the public database and 72 were annotated in the KEGG database.
Metabolic differences among the four groups
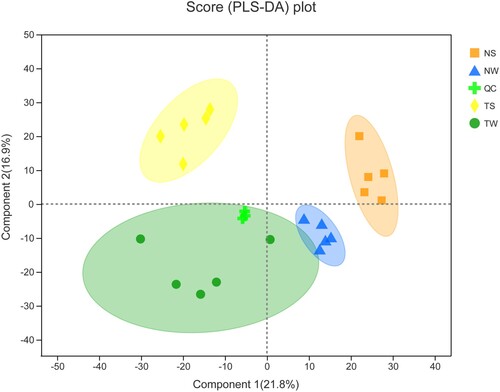
To compare the metabolite composition of the four groups, datasets obtained from UHPLC -Q Exactive HF-X in ESI+ (ESI–) mode were subjected to PLS-DA. The results showed that the four samples were clearly separated (Figure ).
Figure 2. PLS-DA analysis TW, tobacco group subjected to topping treatment only; TS, tobacco group treated by topping and 0.6 mM SA; NS, tobacco group only receiving 0.6 mM SA; NW, control group.
We further counted the number of differential metabolites among the different groups. Between the NS and NW groups, 1539 and 1353 differential metabolites in the positive and negative ion models were obtained, respectively. For the TS vs. NS group, 1772 and 1557 differential metabolites were obtained in the positive and negative ion models, respectively. A total of 1372 and 729 differential metabolites were obtained when confronting TW and NW groups in the positive and negative ion models, respectively. Furthermore, 1544 (positive ion model) and 1212 (negative ion model) differential metabolites were evidenced between the TS and TW groups.
KEGG analysis of differential metabolites
KEGG enrichment analysis was performed on the different metabolites obtained by comparing different groups (Supplementary Table 2). Differential metabolites obtained between the NS and NW groups were involved in 44 KEGG pathways, such as ABC transporters, glyoxylate and dicarboxylate metabolism, arginine and proline metabolism, tropane, piperidine and pyridine alkaloid biosynthesis, nicotinate and nicotinamide metabolism, and others. A total of 49 KEGG pathways were obtained from the enrichment analysis of the differential metabolites between the TS and NS groups, including aminoacyl-tRNA biosynthesis, isoquinoline alkaloid biosynthesis, tyrosine and tryptophan biosynthesis, tropane, and piperidine and pyridine alkaloid biosynthesis. When comparing TS and TW groups, the differential metabolites were mainly involved in 33 KEGG pathways, including isoquinoline alkaloid biosynthesis, ubiquinone and other terpenoid-quinone biosynthesis, biosynthesis of various secondary metabolites, tropane, and piperidine and pyridine alkaloid biosynthesis pathways. Differential metabolites screened between TW and NW groups were mainly involved in 42 KEGG pathways, including tropane, piperidine and pyridine alkaloid biosynthesis, biosynthesis of various secondary metabolites, ubiquinone, and other terpenoid-quinone biosynthesis pathways.
Screening of DEGs between groups
After analyzing the expression levels of genes in different groups, we screened the DEGs (Supplementary Table 3). When comparing TS and NS groups, 515 DEGs (204 upregulated and 311 downregulated) showed significant differences (p < 0.05). A total of 976 DEGs, including 680 upregulated and 296 downregulated DEGs, were detected between the NW and NS groups (p < 0.05). Using NW as the control group, the screening between the TW and NW groups evidenced 952 significant DEGs, including 699 upregulated and 253 downregulated DEGs (p < 0.05). The TS vs. TW comparison identified a total of 719 significant DEGs (463 upregulated and 256 downregulated, p < 0.05).
KEGG analysis of DEGs
To understand their role in post-treatment regulation, we performed KEGG pathway analysis of the DEGs. DEGs screened between the NS and NW groups were mainly involved in 87 KEGG pathways, including glutathione metabolism, biotin metabolism, isoquinoline alkaloid biosynthesis, and alkaloid biosynthesis. In the TS vs. NS group, the DEGs were mainly involved in photosynthesis, plant hormone signal transduction, tropane, piperidine and pyridine alkaloid biosynthesis, and ubiquinone and other terpenoid-quinone biosynthesis. Between the TS and TW groups, 94 KEGG pathways were evidenced, including MAPK signaling pathway, arginine and proline metabolism, terpenoid backbone biosynthesis, alkaloid biosynthesis, and others. KEGG pathway analysis was also performed on DEGs between the TW and NW groups, which were involved in 88 pathways including alkaloid biosynthesis, phenylpropanoid biosynthesis, plant hormone signal transduction, alkaloid biosynthesis, and others.
Construction of DEGs-differential metabolites network.
According to the method section, 26 pathways were shared between NS and NW groups, involving 83 DEGs and 20 differential metabolites. After correlation analysis and screening, 61 DEGs and differential metabolite co-expression relationship pairs were obtained, including 37 DEGs and 10 differential metabolites (Figure A). P-SA had a positive correlation with nine genes but had a negatively correlated expression relationship with P48977. Tryptophanol was positively correlated with six upregulated genes.
Figure 3. Differentially expressed genes-differential metabolites network in (A) NS vs NW, (B) TW vs TS, (C) TW vs NW, and (D) NS vs TS TW, tobacco group subjected to topping treatment only; TS, tobacco group treated by topping and 0.6 mM SA; NS, tobacco group only receiving 0.6 mM SA; NW, control group. The red circle represents the up-regulated protein, the green circle represents the down-regulated protein, the blue square represents the metabolite, the red line represents the positive correlation, and the green line represents the negative correlation.
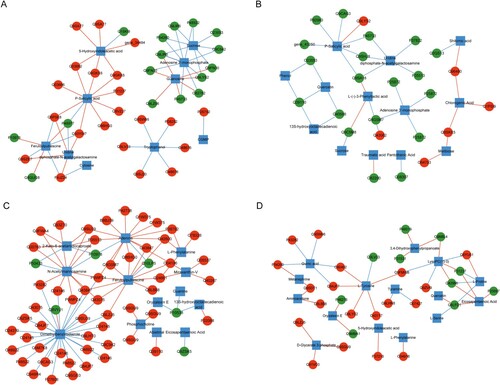
Between the TW and TS groups 25 shared pathways were identified, with 60 DEGs and 23 differential metabolites involved. Overall, these data led to the construction of a co-expression network containing 25 differential genes and 13 differential metabolites (Figure B). A positive correlation between chlorogenic acid and the three upregulated DEGs, a negative correlation between P-SA and six down-regulated DEGs, and a positive correlation between P-SA acid and one upregulated DEG were detected.
A total of 35 pathways were shared by the TW and NW groups, involving 146 DEGs and 24 differential metabolites. The constructed network included 92 co-expression relationship pairs, composed of 59 DEGs and 13 differential metabolites (Figure C). The co-expression network evidenced a negative correlation between eicosapentaenoic acid and downregulated DEG Q9ZSK5 and a relationship between dimethylbenzimidazole, one downregulated DEG (Q8VYJ1), and 28 upregulated DEGs.
There were 32 common pathways between the NS and TS groups, involving 29 DEGs and 15 differential metabolites. The co-expression network constructed with these related DEGs and differential metabolites involved 43 relationship pairs (Figure D). Eicosapentaenoic acid was positively correlated with the four downregulated DEGs (P25697, P31237, Q42966, and Q8LFD1). L-proline was positively correlated with Q42966 and P31237, but negatively correlated with Q6YU51. There was also a positive correlation between D-glycerate 3-phosphate and the three upregulated genes (Q9LZJ5, Q91VC0, and Q9SGU9).
Integrative analysis of DEGs-KEGG pathways-differential metabolites
Four DEG-KEGG pathways-differential metabolite networks were constructed as described in the method section. For the NS vs. NW group, the regulatory network included 69 nodes and 127 relationship pairs (Figure A). A total of 37 DEGs, 10 differential metabolites, and 22 KEGG pathways were enrolled in the integrative network. The starch and sucrose metabolism pathways were related to two downregulated genes (O23553 and Q9LIR6), two upregulated genes (Q9LV33 and P26792), and sucrose. The glycolysis/gluconeogenesis pathway is related to Q9GKX6, Q03662, and P48977. Tropane and piperidine/pyridine alkaloid biosynthesis were related to Q9FN30 and Q9FN30.
Figure 4. Differentially expressed genes-KEGG pathway-differential metabolites network in (A) NS vs NW, (B) TS vs NS, (C) TS vs TW, and (D) TW vs NW TW, tobacco group subjected to topping treatment only; TS, tobacco group treated by topping and 0.6 mM SA; NS, tobacco group only receiving 0.6 mM SA; NW, control group. The red circle represents the up-regulated protein, the green circle represents the down-regulated protein, the orange hexagon represents the pathway, the blue square represents the metabolite, the red line represents the positive correlation, and the green line represents the negative correlation.
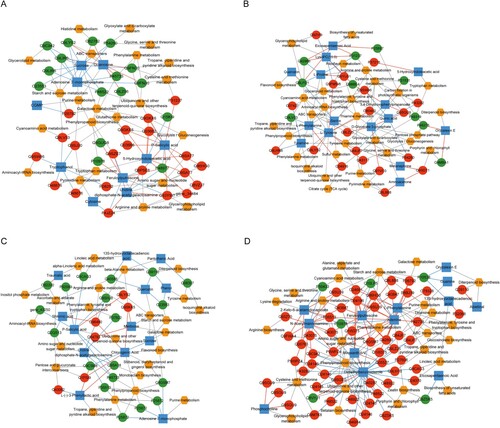
The constructed DEGs-KEGG pathways-differential metabolite integrative network associated with TS vs. NS (Figure B) included 29 DEGs, 15 differential metabolites, and 30 KEGG pathways. Tropane and piperidine/pyridine alkaloid biosynthesis are related to L-phenylalanine, while the isoquinoline alkaloid biosynthesis pathway is related to tyramine and L-tyrosine. We also found a relationship between the citrate cycle pathway and O04916, which is itself related to L-phenylalanine, glyoxylate, and dicarboxylate metabolisms.
For the TS vs. TW group, the integrative network included 24 KEGG pathways, 25 DEGs, and 13 differential metabolites (Figure C). P-SA acid was related to some DEGs and differential metabolites, including gene_43250, P92983, Q9CAG3, Q9SHJ8, Q9LYS2, Q9SA18, P45733, and ubiquinone and other terpenoid-quinone biosynthesis. Traumatic acid was connected to O82200 and alpha-linolenic acid metabolism in the network, which also included some glycometabolism-related pathways and metabolites.
A total of 26 KEGG pathways, 59 DEGs, and 13 differential metabolites were identified in the integrative network of TW vs. NW (Figure D). Starch and sucrose metabolism was related to six upregulated DEGs (Q9SU39, Q43847, O04196, Q9SU39, Q43847, and P26792) and two downregulated DEGs (Q10LP5 and P10538). One upregulated DEG, O24661, was related to alanine, aspartate, and glutamate metabolism. Instead, tropane and piperidine/pyridine alkaloid biosynthesis pathways are related to Q9LHT0 and L-phenylalanine.
Relative expression of nicotine synthesis-related genes
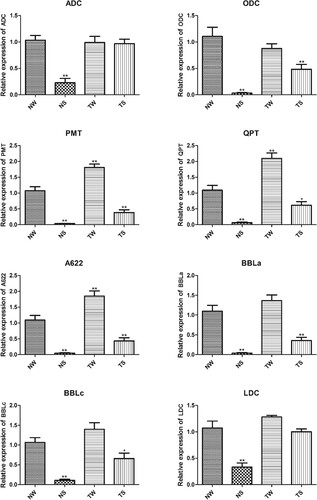
The relative expression of eight genes, including ADC, ODC, PMT, QPT, A622, BBLa, BBLc, and LDC was analyzed (Figure ). After tobacco treatment with SA for 24 h, the expression levels of eight genes in tobacco were significantly lower than those in the control group (p < 0.01). After topping, the expression levels of PMT, QPT, and A622 in tobacco were significantly higher than those in the control group (p < 0.01). In the TS group, except for ADC and LDC, the expression of the other six genes in tobacco was significantly lower than that in the control group (p < 0.05).
Figure 5. RT-qPCR detection of the relative expression of genes related to nicotine synthesis TW, tobacco group subjected to topping treatment only; TS, tobacco group treated by topping and 0.6 mM SA; NS, tobacco group only receiving 0.6 mM SA; NW, control group.
Discussion
Tobacco is an important and world widely grown economic crop, whose cultivation technique requires topping. Decades of research have found that topping can increase the quality of tobacco leaves by eliminating the apical advantage, while also significantly increasing the content of nicotine (Xu Haiqin et al. Citation2016). Nicotine is an alkaloid composed of a pyridine ring and a pyrrole ring and it is considered a risk factor for cancer (O'Malley et al. Citation2014); therefore, reducing its content in tobacco production is an adequate goal. It has been reported that external application of SA can reduce nicotine content in tobacco. This study aimed to understand the molecular mechanism of its effects by studying the effects of topping and SA treatment on the transcriptome and proteome of tobacco.
Transcriptome and proteome reveal the effects of topping on tobacco
After topping treatment, we screened the different metabolites and DEGs from the two groups of samples (TW vs. NW). The network formed by the joint analysis contained 26 KEGG pathways, 59 DEGs, and 13 different metabolites, where tropane and piperidine/pyridine alkaloid biosynthesis were related to Q9LHT0, a gene encoding tropinone reductase that was upregulated in the TW group. Two types of tropinone reductase, a member of the dehydrogenase family, exist: I and II. Tropinone reductase I reduces tropinone to tropine, whereas tropinone reductase II catalyzes the change between tropinone to pseudotropine. Topping is believed to promote root growth and increase the expression of genes related to nicotine synthesis in the roots, ultimately leading to the accumulation of more nicotine in the leaves (Henry et al. Citation2019). The synthesis and metabolism of a variety of amino acids, including arginine, also changed after topping. Nicotine is synthesized in the roots from ornithine and arginine with putrescine as intermediate product, which may serve as a reactant to generate the pyrrolidine ring of nicotine in Nicotiana tabacum and related species (Zhang et al. Citation2016). Topping is perceived as a stress by tobacco; it induces upregulation of some genes related defense, such as O24146, which encodes 4-coumarate-CoA ligase 2. When tobacco encounters drought and other stresses, it increases the content of coniferyl alcohol to further improve its tolerance to drought and osmosis (Chen et al. Citation2020). In short, topping changes the content of metabolites related to the synthesis of various alkaloids in tobacco and the expression of stress-related proteins. Previous studies have shown that the DEGs screened out after tobacco topping involve signal transduction, transcription and translation, stress, and alkaloid synthesis-related reactions, which is consistent with our results (Li et al. Citation2016). In addition, after the topping treatment, the content in alkaloids increased to varying degrees compared with the control group (NW), and the expression levels of nicotine synthesis-related genes PMT, QPT, and A622 were also significantly higher than those of the control group (p < 0.01). PMT is a methyltransferase that catalyzes monomethylation of the diamine putrescine, synthesizing N-methylputrescine and S-adenosylhomocysteine. The first is oxidized and cyclized to the reactive N-methylpyrrolinium cation, which becomes the pyrrolidine ring of nicotine and tropane alkaloids (Biastoff et al. Citation2009). Silencing PMT can significantly reduce the nicotine content in tobacco (Wang et al. Citation2009). QPT is involved in the pyridine nucleotide cycle and acts as a component of the pyridine alkaloid (Khan et al. Citation2017), while orphan oxidoreductase A622 has been shown to be responsible for the biosynthesis of three pyridine alkaloids in tobacco (Deboer et al. Citation2009).
The effect of external application of SA on tobacco
SA is a systemic acquired resistance plants signal released after pathogen induction (Kamatham et al. Citation2017); it can enhance antioxidant defenses, the detoxification potential, and photosynthesis and thus promote plant adaptation to various environmental stresses such as high temperature, salinity, heavy metal stress, and pesticide injury (Künstler et al. Citation2020). A previous study reported that treatment of isolated tobacco root hairs with SA could significantly reduce the content of nicotine, which may be due to SA's interference with the JA pathway in plants. JA regulates nicotine biosynthetic gene expression through MYC2 and the jasmonate ZIM-domain (JAZ) repressor system. The exogenous application of JA is believed to promote nicotine accumulation in tobacco (Zayed and Wink Citation2009). In this study, 0.6 mM SA treatment significantly decreased the relative expression of nicotine synthesis-related genes and decreased the alkaloid content. In addition, a variety of differential metabolites and genes after SA treatment were found to be involved in the biosynthesis of nicotine. Q9FN30 encodes aminotransferase TAT2, which is related to the synthesis of alkaloids in the complex network, and its expression was downregulated after SA treatment. TAT2 is responsible for the degradation and metabolism of L-tyrosine. Studies have shown that inducing TAT silencing in poppy can lead to a decrease in the levels of isoquinoline alkaloids derived from both 4-hydroxyphenylpyruvate and L-tyrosine (Wang et al. Citation2019).
Topping transforms the circulation of raw materials in tobacco plants from nitrogen metabolism-related pathways to carbon metabolism-related pathways, thereby affecting photosynthesis and secondary metabolism (Loake and Grant Citation2007; Yan et al. Citation2019). As the biosynthesis of nicotine involves the cooperation of multiple pathways, this study also screened genes with altered expression levels affected by topping and SA treatment. A subject of further genomic research may be the molecular control of these genes’ expression, as topping and other similar practices require heavy labor. Another aim may be influencing the biosynthesis and regulation mechanisms of nicotine in tobacco. Additionally, this study only considered a single checkpoint in time, but, as the two treatments may have further time-dependent results, the matter may require further research in the future. In conclusion, this study provides new insights on how topping and SA treatment affect nicotine content in tobacco and provides a direction for future breeding.
Acknowledgements
This work was supported by Science and Technology Project of China National Tobacco Corporation (grant number 110202103013).
Disclosure statement
No potential conflict of interest was reported by the author(s).
Authors’ contributions
Conception and design of the research: HS; acquisition of data: MZ, YZ, and CY; analysis and interpretation of data: MZ and YZ; statistical analysis: MZ and CY; drafting the manuscript: MZ; revision of manuscript for important intellectual content: HS. All authors read and approved the final manuscript.
Data availability statement
The transcriptome data that support the findings of this study are available in the NCBI BioProject repository (http://www.ncbi.nlm.nih.gov/bioproject/766705) with accession number PRJNA766705.
Geolocation information
Henan Agricultural University, Henan 450000, People’s Republic of China.
References
- Barbier FF, Dun EA, Beveridge CA. 2017. Apical dominance. Current Biology: Cb. Sep. 11(27):R864–r865. Epub 2017/09/13.
- Benowitz NL. 2009. Pharmacology of nicotine: addiction, smoking-induced disease, and therapeutics. Annu Rev Pharmacol Toxicol. 49:57–71.
- Biastoff S, Brandt W, Dräger B. 2009. Putrescine N-methyltransferase–the start for alkaloids. Phytochemistry. Oct-Nov. 70:1708–1718. Epub 2009/08/05.
- Chen H, Wang B, Geng S, Arellano C, Chen S, Qu R. 2018. Effects of overexpression of jasmonic acid biosynthesis genes on nicotine accumulation in tobacco. Plant Direct. 2:1–11.
- Chen X, Su W, Zhang H, Zhan Y, Zeng F. 2020. Fraxinus mandshurica 4-coumarate-CoA ligase 2 enhances drought and osmotic stress tolerance of tobacco by increasing coniferyl alcohol content. Plant Physiology and Biochemistry: Ppb. 155:697–708. Epub 2020/08/31.
- DeBoer KD, Dalton HL, Edward FJ, Hamill JD. 2011 Apr. RNAi-mediated down-regulation of ornithine decarboxylase (ODC) leads to reduced nicotine and increased anatabine levels in transgenic Nicotiana tabacum L. Phytochemistry. 72:344–355. Epub 2011/01/15.
- Deboer KD, Lye JC, Aitken CD, Su AK, Hamill JD. 2009. The A622 gene in Nicotiana glauca (tree tobacco): evidence for a functional role in pyridine alkaloid synthesis. Plant Molecular Biology. Feb. 69:299–312. Epub 2008/11/18.
- Denancé N, Sánchez-Vallet A, Goffner D, Molina A. 2013. Disease resistance or growth: the role of plant hormones in balancing immune responses and fitness costs. Front Plant Sci. 4:155–166.
- Denny P, Feuermann M. 2018. Exploring Autophagy with Gene Ontology. 14:419–436.
- Dewey RE, Xie J. 2013. Molecular genetics of alkaloid biosynthesis in Nicotiana tabacum. Phytochemistry. 94:10–27.
- Gaudreau S, Missihoun T, Germain H. 2020. Early topping: an alternative to standard topping increases yield in cannabis production. Plant Science Today. 7:627–630.
- Geng C, Zhao T, Yang C, Zhang Q, Bai F, Zeng J, Zhang F, Liu X, Lan X, Chen M, et al. 2018. Metabolic characterization of hyoscyamus Niger root-specific putrescine N-methyltransferase. Plant Physiol Biochem. 127:47–54.
- Henry JB, Vann MC, Lewis RS. 2019. Agronomic practices affecting nicotine concentration in flue-cured tobacco: A review. Agron J. 111:3067–3075.
- Ianculov I, Gergen I, Palicica R, Butnariu M, Dumbrava D, Gabor L. 2004. The determination of total alkaloids from atropa belladona and lupinus sp using various spectrophotometrical and gravimetrical methods. Rev Chim. Nov. 55:835–838.
- Ianculov I, Palicica R, Butnariu M, Dumbrava D, Gergen I. 2005. The obtaining of chlorophyll in crystalline form from fir needles (abies alba) and from pine needles (pinus silvestris). Rev Chim. Apr. 56:441–443.
- Islam MN, Ali MS, Choi S-J, Park Y-I, Baek K-H. 2020. Salicylic acid-producing endophytic bacteria increase nicotine accumulation and resistance against wildfire disease in tobacco plants. Microorganisms. 8:31–47.
- Janda T, Szalai G, Pál M. 2020. Salicylic acid signalling in plants. Int J Mol Sci. 21:2655–2657.
- Kamatham S, Pallu R, Pasupulati AK, Singh SS, Gudipalli P. 2017 Nov. Benzoylsalicylic acid derivatives as defense activators in tobacco and arabidopsis. Phytochemistry. 143:160–169. Epub 2017/08/19.
- Kanehisa M, Goto S. 2000. KEGG: kyoto encyclopedia of genes and genomes. Nucleic Acids Research. Jan. 1(28):27–30. Epub 1999/12/11.
- Khan S, Pandey SS, Jyotshna SK, Khan F, Rahman LU. 2017. Cloning and functional characterization of quinolinic acid phosphoribosyl transferase (QPT) gene of Nicotiana tabacum. Physiologia Plantarum. Jul. 160:253–265. Epub 2017/03/04.
- Kohut SJ. 2017. Interactions between nicotine and drugs of abuse: a review of preclinical findings. The American Journal of Drug and Alcohol Abuse. Mar. 43:155–170. Epub 2016/09/03.
- Künstler A, Kátay G, Gullner G, Király L. 2020. Artificial elevation of glutathione contents in salicylic acid-deficient tobacco (Nicotiana tabacum cv. Xanthi NahG) Reduces Susceptibility to the Powdery Mildew Pathogen Euoidium Longipes. Jan. 22:70–80.
- Li F, Zhang H, Wang S, Xiao W, Ding C, Liu W, Guo H. 2016. Identification of topping responsive proteins in tobacco roots. Front Plant Sci. 7:582–593.
- Liang S, Yang J, Zhou J, Yu J, Ma Y. 2013. Application of exogenous substances reduces tobacco-specific nitrosamines content by regulating biosynthesis of nicotine and nitrite in burley tobacco. Acta Physiol Plant. 35:3027–3036.
- Loake G, Grant M. 2007. Salicylic acid in plant defence—the players and protagonists. Curr Opin Plant Biol. 10:466–472.
- O'Malley SS, Wu R, Mayne ST, Jatlow PI. 2014 Aug. Smoking cessation is followed by increases in serum bilirubin, an endogenous antioxidant associated with lower risk of lung cancer and cardiovascular disease. Nicotine & Tobacco Research: Official Journal of the Society for Research on Nicotine and Tobacco. 16:1145–1149. Epub 2014/05/09.
- Qi Y, Guo H, Li K, Liu W. 2012. Comprehensive analysis of differential genes and miRNA profiles for discovery of topping-responsive genes in flue-cured tobacco roots. FEBS J. 279:1054–1070.
- Shannon P, Markiel A, Ozier O, Baliga NS, Wang JT, Ramage D, Amin N, Schwikowski B, Ideker T. 2003. Cytoscape: a software environment for integrated models of biomolecular interaction networks. Genome Research. Nov. 13:2498–2504. Epub 2003/11/05.
- Sui X, Zhang H, Song Z, Gao Y, Li W, Li M, Zhao L, Li Y, Wang B. 2019a. Ethylene response factor NtERF91 positively regulates alkaloid accumulations in tobacco (Nicotiana tabacum L. Biochem Biophys Res Commun. 517:164–171.
- Sui X, Zhang H, Song Z, Gao Y, Li W, Li M, Zhao L, Li Y, Wang B. 2019b. Ethylene response factor NtERF91 positively regulates alkaloid accumulations in tobacco (Nicotiana tabacum L.). Biochemical and Biophysical Research Communications. Sep. 10(517):164–171. Epub 2019/07/22.
- Valentine G, Sofuoglu M. 2018. Cognitive effects of nicotine: recent progress. Curr Neuropharmacol. 16:403–414. Epub 2017/11/08.
- Vennapusa AR, Somayanda IM, Doherty CJ, Jagadish SVK. 2020 oct. A universal method for high-quality RNA extraction from plant tissues rich in starch, proteins and fiber. Scientific Reports. 10:1–13.
- Virtanen P, Gommers R. 2020. SciPy 1.0: fundamental algorithms for scientific computing in python. Mar. 17:261–272.
- Wang L, Wu J. 2013. The essential role of Jasmonic acid in plant-herbivore interactions – using the Wild tobacco Nicotiana attenuata as a model. J Genet Genomics. 12/01:597–606.
- Wang M, Toda K, Block A, Maeda HA. 2019. TAT1 and TAT2 tyrosine aminotransferases have both distinct and shared functions in tyrosine metabolism and degradation in Arabidopsis thaliana. J Biol Chem. 294:3563–3576.
- Wang P, Zeng J, Liang Z, Miao Z, Sun X, Tang K. 2009. Silencing of PMT expression caused a surge of anatabine accumulation in tobacco. Molecular Biology Reports. Nov. 36:2285–2289. Epub 2009/01/24.
- Xu Haiqin LS, Lixin W, Jingyuan W, Ling H, Xiaoyan X. 2016. Expression and significance of LASS2 /TMSG-1 in human lung cancer cell lines with different metastatic potentiality. J Shanxi Med Univ. 47:884–889.
- Yan S, Niu Z, Yan H, Zhang A, Liu G. 2019. Transcriptome sequencing reveals the effect of biochar improvement on the development of tobacco plants before and after topping. 14:1–16.
- Zayed R, Wink M. 2009. Induction of pyridine alkaloid formation in transformed root cultures of Nicotiana tabacum. Zeitschrift für Naturforschung C. 64:869–874.
- Zeng JY, Wu DD, Shi ZB, Yang J, Zhang GC. 2020. Influence of dietary aconitine and nicotine on the gut microbiota of two lepidopteran herbivores. Jul;104:e21676.
- Zhang X, Lin H-m, Hu H, Hu X, Hu L. 2016. Gamma-aminobutyric acid mediates nicotine biosynthesis in tobacco under flooding stress. Plant Diversity. 38:53–58.