
Abstract
The underlying molecular mechanisms of colorectal cancer (CRC) has attracted great attention from the scholarly community. The aim of our study is to identify pivotal genes related to the pathogenesis and prognosis of CRC. We integrated five microarray datasets from Gene Expression Omnibus (GEO) database. The differentially expressed genes (DEGs) were analyzed with the limma package. DAVID and OmicShare tools were used for Gene Ontology (GO) and KEGG enrichment analysis. The protein–protein interaction (PPI) network of DEGs was constructed. The prognostic analysis of hub genes was performed through Kaplan Meier-plotter. Finally, potential drugs were predicted in the CMap database. Through five microarray datasets, a total of 90 DEGs were detected including 54 up-regulated and 36 down-regulated genes. Biological process analysis showed DEGs were mainly enriched in positive regulation of neutrophil chemotaxis, chemokine-mediated signaling pathway, and bicarbonate transport. Signaling pathway analysis indicated that DEGs played a vital in proximal tubule bicarbonate reclamation, cell cycle and progesterone-mediated oocyte maturation. The GEPIA database confirmed that overexpression levels of hub genes were significantly associated with better survival of patients. Finally, the 20 most significant small molecules were obtained based on the CMap database. Our study has identified novel candidate biomarkers, pathways, and kinases associated with CRC prognosis.
Introduction
In the world, Colorectal Cancer (CRC) is common cancer and a major public health problem. Overall, the incidence of colorectal cancer (CRC) ranks third and the cancer-related mortality ranks second, with approximately 1.88 million new cases and 915,880 deaths reported worldwide in Citation2021.
Colonoscopy – today’s gold standard due to its capacity to screen CRC and remove precancerous lesions – is invasive, inconvenient for the patients, and costly. The disadvantages inherent to colonoscopy makes it inappropriate for use as a primary screening tool (Benard et al. Citation2018). However, it has proven to be effective in reducing CRC incidence and mortality. Colorectal cancer often manifests as early lymph node invasion or distant metastases, with patients often diagnosed only when they possess advanced disease, a phenomenon that inevitably leads to dismal clinical outcomes. CRC patients with relapse respond inadequately to the second or third line of treatment making their prognosis generally poor. The 5-year survival rate for metastatic CRC remains only 12% (Siegel et al. Citation2019).
In addition, environmental, socioeconomic, and lifestyle in individual may be regarded as risk factors of developing CRC (Keum and Giovannucci Citation2019). As other malignancies, CRC is considered a polyphase disease in different stages of tumor initiation, progression, and metastasis, which are accompanied by many change, including genetic mutations, epigenetic changes, cellular contexts, and environmental influences (Boussios et al. Citation2019). It has shown in several studies that the occurrence and development of CRC involves multiple genes and cellular signal transduction pathways, which are used for early tumor screening. Therefore, the demand for identifying patients at a higher or lower risk of CRC death through sensitive and specific biological markers is essential, not only to better understand the molecular and cellular processes of tumorigenesis but also for more effective early diagnosis, appropriate therapeutic strategies, and improved prognosis.
Over the recent years, bioinformatics serve as an important tool for a range of life science applications, which could be used for early diagnosis of the tumor, tumor grade, and prognostic judgment (Canzoneri et al. Citation2019). Various bioinformatics databases, such as the GEO database, TCGA database, provide opportunities for data mining for gene expression profiles of cancer. The public database Gene Expression Omnibus (GEO) is a huge repository of high-throughput gene expression data and hybridization arrays, chips, microarrays (Jiang and Liu Citation2015). GEO database has provided a powerful platform for bioinformatics to explore novel biomarkers for cancer diagnosis, treatment, and prognosis analysis. For this study, we performed an integrated bioinformatics analysis to identify specific genes differentially expressed, discover the hub genes; and build protein to protein interaction (PPI) networks of hub genes by analyzing various bioinformatic online datasets to reveal the potential pathogenesis of colorectal cancer.
Materials and methods
Microarray data
The five gene expression profile matrix files and platform TXT files (GSE110223, GSE1110224, GSE113513, GSE84984, and GSE73360) were downloaded from the Gene Expression Omnibus database (http://www.ncbi.nlm.nih.gov/geo/). These RNA profiles were based on GPL96 platform (Affymetrix Human Genome U133A Array), GPL570 platform(Affymetrix Human Genome U133 Plus 2.0 Array), GPL15207 platform (Affymetrix Human Gene Expression Array), and GPL17586 platform (Affymetrix Human Transcriptome Array 2.0), containing a total of 100 colorectal cancer samples and 79 normal samples. The GSE110223 profile included 13 tumor samples and 13 normal samples, GSE110224 profile contained 17 tumor samples and 17 normal samples, GSE113513 profile provided 14 tumor samples and 14 normal samples, GSE84984 profile comprised from 9 tumor samples and 6 normal samples, and GSE73360 profile consisted of 37 tumor samples and 19 normal samples. The characteristics of these datasets are shown in Table .
Table 1. Details of the GEO colorectal cancer data.
Screening of DEGs
The analysis was carried out by using GEO2R (https://www.ncbi.nlm.nih.gov/geo/geo2r/), a convenient online analysis tool that is based on R programming language and can be used to perform comparisons on GEO datasets (Yao and Liu Citation2018). Adjusted P < 0.05 and |log fold change (FC)| > 1 were chosen as the cutoff value for statistical analysis of each dataset. The adjusted P-value (adj. P) was applied to help correct false positives. The heat map and volcano plot were drawn with the ‘ggplots’ package in R 3.6.2. The upregulated and downregulated gene lists were saved as Excel files for subsequent integration analysis.
Gene ontology and Kegg analysis of DEGs
To depict the potential biological functions of the overlapping DEGs, we performed Gene Ontology (GO, http://www.geneontology.org) enrichment analysis covering three domains: biological process (BP), molecular function (MF), and cellular component (CC) (Hinderer et al. Citation2019). OmicShare website, a free online platform for Go enrichment analysis (http://omicshare.com/tools), Kyoto Encyclopedia of Genes and Genomes (KEGG, http://www.genome.ad.jp/kegg/), an extensive database of genomes, biological pathways, diseases, drugs, and chemical substances, are often used to explore functions and metabolic pathways involved in the overlapping DEGs (Du et al. Citation2014). DAVID (http://david.ncifcrf.gov), an online bioinformatics resource, provides highly integrated gene-annotation and comprehensive data coverage (Jiao et al. Citation2012). It has covered a wealth of biological data and relevant analysis tools for the biological function annotation information of genes or proteins. P < 0.05 was considered as the cut-off criterion with a significant difference. Downloading the TXT file of the GO and KEGG pathway enrichment analysis for subsequent analysis. A visual network analysis of the KEGG analysis was performed using Cytoscape 3.7.2 software.
Pathway enrichment analysis of DEGs
The Kyoto Encyclopedia of Genes and Genomes (KEGG) database mapped genes and their respective pathways together (Du et al. Citation2014). ClueGO (Mlecnik et al. Citation2018), an app that selects Gene Ontology terms and pathways for a list of genes or proteins and visualizes them into functional networks, runs on Cytoscape (Otasek et al. Citation2019). The plug-in CluePedia (Mlecnik et al. Citation2018) is another Cytoscape tool for finding markers that may be related to pathways. Additionally, better results were achieved by combing ClueGO with CluePedia. In this study, DEG functions were studied using ClueGO and CluePedia toolkits through KEGG pathway enrichment analysis. A P value of <.05 and kappa coefficient of 0.4 were considered as threshold values.
Protein–protein interaction (PPI) network construction and module analysis
The STRING, a database of a customizable protein–protein network, and functional characterization of user-uploaded gene/measurement sets (STRING, https://string-db.org/) (Szklarczyk et al. Citation2021) aims to predict functional associations between proteins for a large number of organisms. The DEGs were imported to STRING to assess the interactive relationships, and a combined score > 0.4 was considered significant. Subsequently, the PPI network was visualized and further analyzed using Cytoscape software (www.cytoscape.org/) (Otasek et al. Citation2019). The MCODE (Molecular Complex Detection) plugin in was utilized to explore significant modules in the PPI network. The degree cutoff = 2, node score cutoff = 0.2, k-core = 2, and max depth = 100 were set as cutoff criteria for advanced options. Using the Cytoscape plugin cytoHubba (Chin et al. Citation2014), we determined the hub proteins in the PPI network.
Comparison of the hub genes expression level and validation of hub genes
GEPIA (http://gepia.cancer-pku.cn/detail.php) web server organizes cancer and normal gene expression data for analysis and provides online interactive analysis following standard methods (Tang et al. Citation2017). It provides customizable functions such as tumor and normal differential expression analysis. Then the relationship for hub genes was indicated in boxplots. We also analyzed the protein expression of the hub genes between CRC and normal tissues using the human protein atlas (HPA, www.proteinatlas.org) database, which is an online tool widely used for determining the protein level of genes in clinical samples.
Survival analysis of hub genes
Kaplan Meier-plotter (KM plotter, http://kmplot.com/analysis/) could assess the effect of 54675 genes on survival using 10,461 cancer samples, including 5143 breast, 1816 ovarian, 2437 lung and 1,065 gastric cancer patients with the average follow-up time was 69, 40, 49, and 33 months. The relapse-free and overall survival information was based on GEO (Affymetrix microarrays only), EGA, and TCGA database. The hazard ratio (HR) with 95% confidence intervals and log rank P value were calculated and displayed on the plot.
Identification of small molecules
We queried the Connectivity Map (CMap, http: //www. broadinstitute.org/cmap/) to detect the candidate small molecule drugs based on the gene signature of CRC. CMap is a gene transcription-expression profiling database that links disease, genes, and drugs by similar or opposite gene expression profiles. First, these overlapping DEGs were divided into upregulated and down-regulated groups. Then the probesets from each group were utilized to query the CMap database (Subramanian et al. Citation2017). Finally, the enrichment scores ranging from −1 to +1 were calculated, which represented the similarity. A positive connectivity value (closer to +1) demonstrated that a small molecule can induce the gene expression of CRC cells, whereas a negative connectivity value (closer to −1) demonstrated that a small molecule can imitate the status of normal cells.
Results
Identification of DEGs in CRC
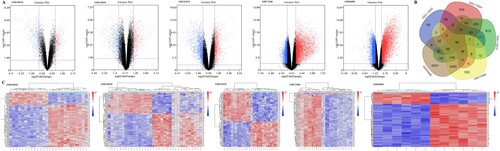
In the aggregate, 90 colorectal adenocarcinoma samples and 69 matched normal mucosa samples from 5 datasets 2019 were analyzed. The major characters of the qualified studies were shown in Table . After the colorectal cancer chip expression datasets GSE110223, GSE110224, GSE113513, GSE84984, and GSE73360 were normalized, we then applied the GEO2R online analysis tool to screen the DEGs, using adjust P value < 0.05 and logFC ≤ −1 or logFC ≥ 1 as the cut-off criteria. We captured 90 DEGs including 54 upregulated DEGs and 36 downregulated DEGs. The GSE110223 dataset contained 727 differential genes, including 285 upregulated genes and 442 downregulated genes. The GSE110224 dataset contained 1086 differential genes, including 469 upregulated genes and 617 downregulated genes. The GSE113513 dataset contained 2866 differential genes, including 1155 upregulated expression genes and 1711 downregulated expression genes. The GSE73360 dataset contained 4621 differential genes, including 3000 upregulated expression genes and 1621 downregulated expression genes. In addition, the GSE84984 dataset contained 8723 differential genes, including 4184 upregulated genes and 4539 downregulated genes. The volcano plot showed the up-regulated and down-regulated genes in each dataset (Figure A). The Venn diagram from the five datasets summarizng results was shown in Figure (B and C) shows the heat map of the top 100 genes grouped by clusters.
Figure 1. (A)Volcano plot of gene expression profile data between clcorectal cancer and normal tissues in each dataset. Red dots: significantly up-regulated genes in CRC; Blue dots: significantly down-regulated genes in CRC; Black dots: non-differentially expressed genes. P < 0.05 and |log2 FC| >1 were considered as significant.(B) The Venn diagram of 172 overlapping DEGs among five datasets.(C) Cluster heat map of the top 100 DEGs in five GEO databases. Red indicates relative upregulation of gene expression; blue indicates the relative down-regulation of gene expression; gray indicates no significant change in gene expression; and white indicates that the signal intensity is not high enough to detect.
GO functionenrichment analysis of DEGs
Based on GO analysis, the uDEGs exhibited distinct differences in regulation of neutrophil chemotaxis, chemokine-mediated signaling pathway, and extracellular matrix disassembly in biological processes (BPs) (Figure A, Table ); the dDEGs are mainly in bicarbonate transport, regulation of intracellular pH, and one-carbon metabolic process (Figure B, Table ). For molecular function (MF), the uDEGs are enriched in CXCR chemokine receptor binding, growth factor activity, and chemokine activity (Figure A, Table ); and the dDEGs are enriched in carbonate dehydratase activity, chloride channel activity, and zinc ion binding (Figure B, Table ). Cellular component (CC) analysis revealed that the uDEGs are concentrated in the extracellular region, extracellular space, and extracellular exosome (Figure A, Table ); and the dDEGs are concentrated in the basolateral plasma membrane, plasma membrane, and extracellular exosome (Figure B, Table ).
Figure 2. (A) GO analysis of upregulated DEGs. (B) GO analysis of downregulated DEGs.(C) KEGG pathway of DEGs. (D) Function annotation of DEGs. Each node is a Kyoto Encyclopedia of Genes and Genomes pathway item. The node size reflects pathway significance (fdr): the smaller the fdr value, the larger the node size is. Edge between nodes reflects shared or common genes: the wider the edge, the larger the overlap is. Different node colors represent different functional groups.
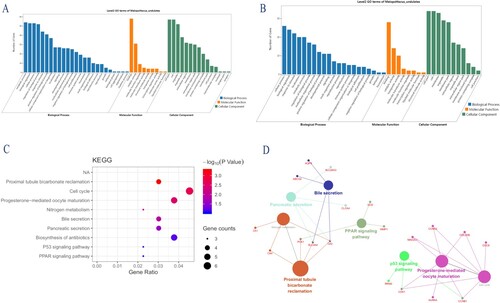
Table 2. Gene ontology analysis of DEGs related to colorectal cancer.
KEGG signal pathway analysis of DEGs
A KEGG pathway analysis of the integrated DEGs is shown in Table and Figure (C). The significantly enriched pathways, by DEGs, included the Proximal tubule bicarbonate reclamation pathway, Cell cycle pathway, Progesterone-mediated oocyte maturation pathway, Nitrogen metabolism pathway, Bile secretion pathway, Pancreatic secretion pathway, and Oocyte meiosis pathway. Additionally, cyclin-dependent kinase 1 (CDK1) was found to participate in the cell cycle pathway, Progesterone-mediated oocyte maturation pathway, Oocyte meiosis pathway and p53 signaling pathway, while in the cell cycle pathway, cell division cycle 6 (CDC6) was enriched and in the Pancreatic secretion pathway, mitotic arrest deficient-like 1 (yeast) (MAD2L1) was enriched, respectively. The network diagram was drawn using Cytoscape software (Figure D).
Table 3. Kyoto Encyclopedia of Genes and Genomes (KEGG) pathway analysis of integrated DEGs.
PPI network construction and module selection.
Considering the critical role of protein interactions in protein function, we used the STRING database and Cytoscape software to generate PPI network once we had identified the 90 DEGs. The results showed that there were dense regions in PPI, that is, genes closely related to colorectal cancer (HUB genes) modules.
A total of 77 nodes and 300 edges were selected to plot the PPI network, which consisted of 54 up-regulated genes and 36 down-regulated genes (Figure A). Subsequently, a pivotal module of 19 genes (CDK1,TPX2, DLGAP5, UBE2C and so on) was identified with the degree≧2 as the cut-off value by using MCODE (Figure C). Another important module of 9 genes including only up-regulated genes was also identified (Figure D). The top 10 HUB genes were identified by cytoHubba (Top 10 genes ranked in Degree) and the PPI net work was established as well (Figure B), the details of which were showed in Table .
Figure 3. PPI and MCODE analyses of DEGs. (A) Protein–protein interaction network of 90 DEGs. (B) The protein-protein interaction(PPI) network of top 10 hub genes.(C) A signifcant module, containing 19 up-regulated proteins, was selected from PPI network. (C) Another module selected from PPI network. For (A, C, D), red nodes are up-regulated proteins, and blue nodes are down-regulated proteins. Circles represent genes, lines represent interactions between gene-encoded proteins and line colors represent evidence of interactions between proteins.
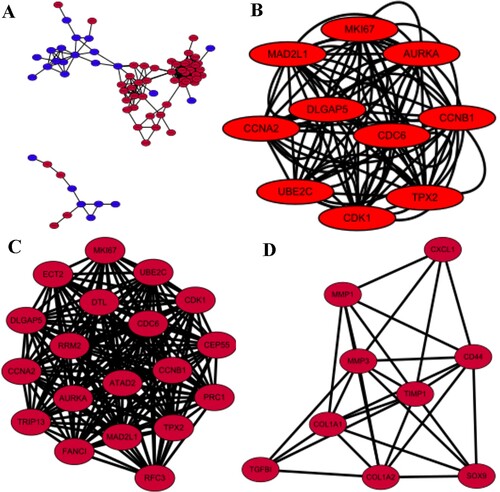
Table 4. The degree values of the top 10 hub genes.
KEGG analysis of the top 2 most important modules were conducted. The results showed that an apparent enrichment of genes in module 1 was observed in the Cell cycle, Progesterone-mediated oocyte maturation, p53 signaling pathway, and Oocyte meiosis, while genes in Module 2 are mainly enriched in ECM-receptor interaction (Table ).
Table 5. KEGG enrichment of genes in the top 2 modules.
Expression levels and prognostic analysis of hub genes
GEPIA is an interactive online server for exploring large data sets from the TCGA and GTEx projects. To confirm the reliability of the top 10 identified hub genes, we used GEPIA to verify the correlation between them, the results obtained from the GEPIA demonstrated that the levels of CDK1, MKI67, CDC6, and MAD2L1 were significantly differentially expressed between tumor (include colonic adenocarcinoma, COAD, and rectum adenocarcinoma, READ) and normal tissues (Figure A), the overexpression of which in CRC tissues were also confirmed in the above 5 GEO datasets (Figure ). Since gene expression does not always correlate with the level of a protein encoded by the corresponding gene, we further measured the protein level of CDK1, MKI67, CDC6, and MAD2L1 in clinical CRC tissues from the HPA database. The results of immunohistochemical indicated that the protein expression level of CDK1, MKI67, CDC6, and MAD2L1 exhibited a significant difference between CRC tissues and normal tissues (Figure B).
Figure 4. The expression level of CDK1, MKI67, CDC6 and MAD2L1 between CRC and normal tissues in five datasets.
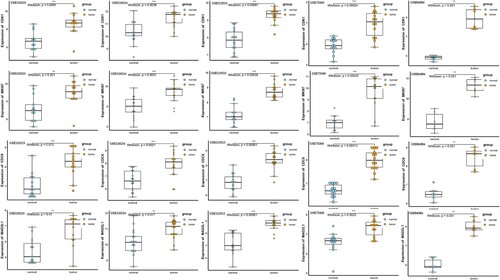
Figure 5. (A) The expression level of CDK1, MKI67, CDC6 and MAD2L1 hub genes between CRC and normal in COAD and READ in GEPIA database. (B) Representative immunohistochemistry staining results reveal the protein level expression of CDK1, MKI67, CDC6 and MAD2L1 in colorectal cancer. (C) The top 20 candidate small molecules targeting the gene expression of CRC.(D) The prognostic value of hub genes according to the Kaplan Meier-plotter online database. Abbreviations: COAD:colon adenocarcinoma; READ:rectal adenocarcinoma; CRC: colorectal cancer.
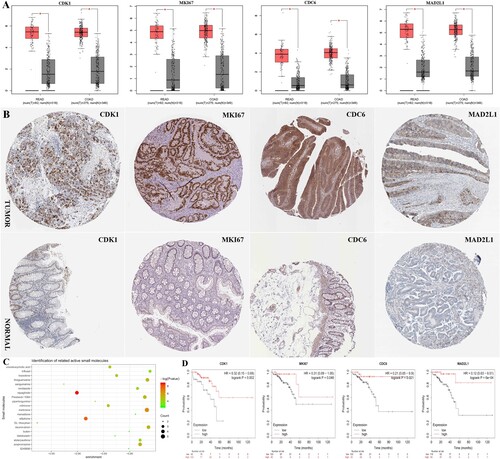
To assess the prognostic value of 10 hub genes, we used Kaplan Meier-plotter online database for prognostic analysis. The results showed that high expression levels of CDK1, MKI67, CDC6, and MAD2L1 may correlate with a better prognosis in patients with CRC (P < 0.05) (Figure D).
Identification of related active small molecules
To screen out candidate small molecule drugs, the CMap database was utilized to analyze consistent differently expressed probesets between CRC tissues and normal tissues. Table and Figure (C) showed the predicted small molecules that could inhibit CRC-associated gene expression. Among these small molecules, DL-thiorphan (enrichment score = −0.977) and blebbistatin (enrichment score = −0.828) showed a higher negative correlation between the gene expression of CRC and the small molecules, which could be the most promising small molecules to reverse the tumoral status of CRC. The prediction of small molecule drugs aims to exploit the potential drugs targeting CRC and make existing drugs fully utilized. However, further studies were urgently needed to validate the above results.
Table 6. List of the 20 most significant small molecule drugs that can reverse the tumoral status of colorectal cancer.
Discussion
The failure to early screening and diagnosis in CRC patients results in poor overall survival rates and prognosis. Therefore, sensitive and specific biomarkers for CRC are urgently needed to be detected.
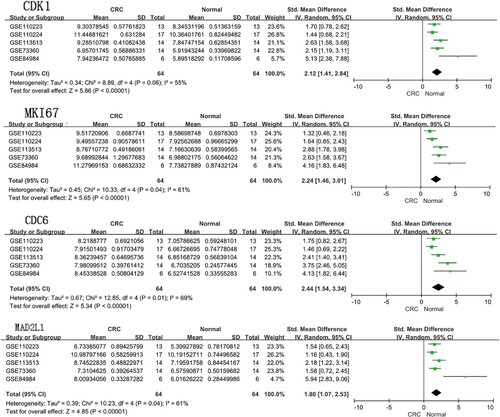
In the present study, a total of 90 DEGs, including 54 upregulated and 36 downregulated genes, were identified in CRC tissues compared to in-paired adjacent normal tissues. Our results showed that AURKA, CDK1, MKI67, TPX2, CCNB1 and so on were the hub proteins with higher degrees in the PPI network. Furthermore, the proximal tubule bicarbonate reclamation, the cell cycle, Progesterone-mediated oocyte maturation, and Nitrogen metabolism signaling pathways were significantly enriched by DEGs. In addition, CDK1 was enriched in the cell cycle pathway, progesterone-mediated oocyte maturation pathway, Oocyte meiosis pathway, and p53 signaling pathway, CDC6 was enriched in the cell cycle pathway and MAD2L1 was enriched in the pancreatic secretion signaling pathway. We performed a prognostic analysis of these 10 hub genes using the Kaplan Meier-plotter online database. The results demonstrated that the prognosis of colorectal cancer patients with high expression levels of CDK1, MKI67, CDC6, and MAD2L1 is better than that with low expression of theirs’. Of the identified differentially expressed hub genes, we found that they were generally involved in the regulation of the cell cycle and were closely associated with the prognosis of colorectal cancer. AURKA is a cell cycle-regulated kinase and is involved in colon carcinogenesis through promoting genomic instability. In addition, AURKA could connect deregulated genes in the Wnt and Ras-MAPK signal pathways, which promots the proliferation, invasion, and migration of CRC cells (Jacobsen et al. Citation2018). One previous study indicated that CDK1 upregulation was linked to BRAFV600E mutation in a subset of colorectal cancer patients (Barras et al. Citation2017). Zhang et al (Citation2018b) suggested that BRAFV600E colorectal cancer cell lines expressing CDK1 were sensitized to apoptosis upon siRNA knockdown or small-molecule inhibition with RO-3306 (CDK1 inhibitor) or dinaciclib (CDK1, 2, 5, 9 inhibitors). Combination of RO-3306 or dinaciclib with cobimetinib (MEK inhibitor) cooperatively enhanced apoptosis and reduced clonogenic survival versus monotherapy. MKI67 is a nuclear non-histone protein required for cell proliferation and is widely used as a biomarker to quantify the proportion of cleavage cells to grade tumors (Miller et al. Citation2018). Ki67 expression is a marker for cells that have enter the cell cycle and is also proven to be correlated with many associated genes in CRC. Deletion of SNRPA1 can down-regulate the expression of MKI67 as an upstream molecule in CRC cells (Zeng et al. Citation2019). Through its cooperation with MYC, TPX2 is a driver gene which promotes colorectal adenoma to carcinoma (Takahashi et al. Citation2015). Cancer cells overexpressing CCNB1 grow and proliferate more rapidly in CRC (Fang et al. Citation2014). UBE2C is an E2 ubiquitin-conjugating enzyme that catalyzes the degradation of APC/C substrates through polyubiquitination in the regulation of the cell cycle. A growing body of evidence suggests that UBE2C could be connected to colorectal cancer progression and to drug resistance in breast cancer (Zhang et al. Citation2018). A specific cell-cycle-associated gene associated with poor prognosis for CRC patients is CCNA2 (Gan et al. Citation2018). CDC6 functions as a regulator at the early steps of DNA replication and is reported as a promising target for overcoming oxaliplatin resistance for CRC (Cai et al. Citation2019). MAD2L1 participates in triggering the spindle assembly checkpoint (SAC) and its hetero-tetramer complex, mitotic arrest deficient-like 1 (MAD1L1), to promote the cell cycle checkpoint signal (Zhong et al. Citation2015). DLGAP5, DLG associated protein 5, encoded DLG7 (disc large homolog 7), which is a microtubule-associated protein (MAP), and has a crucial role during spindle assembly, kinetochore fibers (K-fibers) stabilization, and chromosomal segregation during mitosis. DLGAP5 overexpression has been found in many malignancies such as CRC, breast cancer, hepatocellular carcinoma, urinary bladder cancer, meningioma, and adrenocortical cancer. These previous studies have already described an association between DLGAP5 deregulation and genomic instability (Branchi et al. Citation2019; Sinha et al. Citation2019). Thus, DLGAP5 overexpression may contribute to carcinogenesis. Meanwhile, we performed a meta-analysis to pool the 4 hub genes expression levels in different datasets. Our meta-analysis also revealed CDK1, MKI67, CDC6, and MAD2L1 were significantly elevated in CRC tissues as compared to normal tissue (Figure ).
Figure 6. Meta-analysis of the expression amount of CDK1, MKI67, CDC6 and MAD2L1 among the five datasets. Abbreviations: CRC: colorectal cancer.
In addition, based on the overlapping DEGs, we obtained several potential small molecule drugs for the treatment of CRC from the CMap database. These small molecules had the potential to alter the gene expression of CRC, thereby controlling the progression of tumors. For example, repaglinide (enrichment score = − 0.901) has cytotoxic effects against hepatic, breast, and cervical carcinoma cells in previous researches and has been clinically used for the treatment of glioblastoma multiforme. In the meantime, it is still unknown whether it is effective or safe on CRC (El Sharkawi et al. Citation2014; Xiao et al. Citation2017). Therefore, further studies are urgently demanded to confirm the huge potential of these candidate small molecules in treating CRC. Summary, the top 10 hub genes identified in the PPI network are closely associated with tumorigenesis and tumor progression, which suggests that they can be prognostic factors or therapeutic targets in CRC.
Ontologies of gene products are an important way to describe and integrate biological processes, cellular components, and molecular functions across species. In our study, Based on GO and KEGG enrichment analysis, DEGs were especially enriched in processes related to extracellular matrix disassembly, positive regulation of neutrophil chemotaxis, cell proliferation, and growth factor expression. Genes which regulate growth factors secretion cause tumorigenesis, migration, invasion, and metastasis of cancer cells by stimulating the release of large amounts of TGF-β, HGF, and FGF (Erdogan and Webb Citation2017). Extracellular matrix (ECM) regulates the development and maintains tissue homeostasis. The loss of ECM's homeostasis is generally regarded as defining the transitional phases of cancer progression and metastasis (Rigoglio et al. Citation2020). Alterations in tumor ECM actively promote tumor growth, survival, invasion, and metastasis, as well as angiogenesis and immune function (Varol and Sagi Citation2018). As well, DEGs are mapped on major colorectal cancer pathways, including cell cycle signaling pathways, chemokine-mediated signaling pathways, and MAPK cascades. Signal transduction pathways are involved in the regulation of cell growth, survival, adhesion, movement, and invasion. Our study showed that cell cycle signaling pathways were significantly enriched by DEGs. Cell cycle control is crucial for the maintenance of genomic integrity. Many tumors rely on bypassing physiological checkpoints in cell cycle control as a central component of uncontrolled cellular proliferation. Targeting these cell-cycle dysregulation mechanisms is an attractive method to inhibit tumorigenesis. It is well established that cell cycle control has remained essentially constant throughout evolution, from simple unicellular eukaryotes to complex mammals, including humans. A crucial transition in the cell cycle is driven by the dynamic interplay between cyclins and their associated cyclin-dependent kinases (CDKs) (Xu and McArthur Citation2016). CDKs are serine/threonine kinases that regulate the cell cycle by interacting with specific cell-cycle–regulatory cyclins. Among the CDKs, CDK1 is necessary for G2–M transition as well as the progression of G1 and the transition from G1 to S (Haneke et al. Citation2020; Kalous et al. Citation2020). The non-selective CDK inhibitor dinaciclib inhibits tumor growth in multiple types of cancer in preclinical studies by arresting cell-cycle progression and triggering caspase-8, −9, and related apoptosis (Buzzetti et al. Citation2021; Howard et al. Citation2021), cyclins are abnormally expressed in colorectal cancer cells, resulting in increased proliferation, greater viability, and longer survival times (Shen et al. Citation2019). The results of this study are largely consistent with findings reported for prostate cancer, urinary bladder, and hepatocellular carcinoma (Chang et al. Citation2015; Wang et al. Citation2018; Ji et al. Citation2021). Chemokines and their receptors also function in the development and function of multiple tissues. Chemokine expression has prognostic significance in several cancers apparently due to chemokine-mediated growth and metastatic spread. Endocytosis is required for CXC chemokine receptor type 4 (CXCR4)-mediated Akt activation and antiapoptotic signaling. This mechanism whereby compartmentalized chemokine-mediated Akt signaling from endosomes suppresses the cancer-related process known as anoikis. CXCR4 receptors may be targets of this signaling pathway for the treatment of metastatic cancer (English et al. Citation2018). In other words, studying these pathways can help elucidate the mechanisms of proliferation and invasion of colorectal cancer and predict its progression.
In this study, we also performed a module analysis on the constructed PPI network and selected the two most important modules, and we then performed a KEGG pathway analysis of the genes in these modules. All the 2 identified modules with hub nodes were involved in the important biological function and tumor pathways. The results showed that Module 1 genes are primarily associated with the cell cycle, progesterone-mediated oocyte maturation, p53 signaling pathway and Oocyte meiosis, and Module 2 genes are mainly involved in the ECM-receptor interaction. This indicates that cancer development and metastasis are closely related to these signal transduction pathways, and that blocking the cell cycle and blocking these pathways can provide a beneficial treatment for cancer.
However, there were a few limitations in our study. First, the analysis of the 5 datasets from GEO will result in partial bias, and too few samples in each dataset will not lead to new findings. Although we perform normalization of each dataset individually, the heterogeneity of scientific dissimilarity within every single study cannot be disentangled, result in the meta-analysis is still unclear. Second, most of the included gene expression studies come from Western countries and may pose geographical bias. Therefore further studies based on the information from ongoing trials are required to verify potential biomarkers of CRC.
Conclusion
In conclusion, this study provides some perspectives on potential biomarkers linked to the prognosis of CRC patients. In addition, this study highlights the importance of PPI and modules analysis as a potent framework to gain insight into the key hub nodes underlying the prognosis of CRC and to recognize potential biomarkers of CRC. We also found DL-thiorphan was the most promising small molecule to reverse the gene expression of CRC. These findings could provide new sights about the future genomic individualized treatment of CRC and survival prediction.
Acknowledgements
We express our cordial thanks to all those who participated in this study. Rui Chen, Shoucheng Ma and Fei Su: Conception, design, data analysis, and manuscript writing, Hui Qiao and Lina Wang: Data collection, Quanlin Guan: Guide, supervise, and review.
Disclosure statement
No potential conflict of interest was reported by the author(s).
Data availability
The following information was supplied regarding data availability: The data is available at NCBI GEO: GSE110223, GSE1110224, GSE113513, GSE84984 and GSE73360. The GEO database is available at the following websites: https://www.ncbi.nlm.nih.gov/geoprofiles/
Additional information
Funding
References
- Barras D, Missiaglia E, Wirapati P, et al. 2017. BRAF v600e Mutant colorectal cancer subtypes based on gene expression. Clin Cancer Res. 23(1):104–115.
- Benard F, Barkun AN, Martel M, et al. 2018. Systematic review of colorectal cancer screening guidelines for average-risk adults: summarizing the current global recommendations. World J Gastroenterol. 24(1):124–138.
- Boussios S, Ozturk MA, Moschetta M, et al. 2019. The developing story of predictive biomarkers in colorectal cancer. J Pers Med. 9(1):12.
- Branchi V, Garcia SA, Radhakrishnan P, et al. 2019. Prognostic value of DLGAP5 in colorectal cancer. Int J Colorectal Dis. 34(8):1455–1465.
- Buzzetti M, Morlando S, Solomos D, et al. 2021. Pre-therapeutic efficacy of the CDK inhibitor dinaciclib in medulloblastoma cells. Sci Rep. 11(1):5374.
- Cai J, Wang H, Jiao X, et al. 2019. The RNA-binding protein HuR confers oxaliplatin resistance of colorectal cancer By upregulating CDC6. Mol Cancer Ther. 18(7):1243–1254.
- Canzoneri R, Lacunza E, Abba MC. 2019. Genomics and bioinformatics as pillars of precision medicine in oncology. Medicina (B Aires). 79(Spec 6/1):587–592.
- Chang IW, Lin VC, He HL, et al. 2015. CDCA5 overexpression is an indicator of poor prognosis in patients with urothelial carcinomas of the upper urinary tract and urinary bladder. Am J Transl Res. 7(4):710–722.
- Chin CH, Chen SH, Wu HH, et al. 2014. Cytohubba: identifying hub objects and sub-networks from complex interactome. BMC Syst Biol. 8(Suppl 4):S11.
- Condorelli DF, Spampinato G, Valenti G‚ et al. 2018. Positive Caricature Transcriptomic Effects Associated with Broad Genomic Aberrations in Colorectal Cancer. Scientific Reports. 8(1):14826.
- Du J, Yuan Z, Ma Z, et al. 2014. KEGG-PATH: Kyoto encyclopedia of genes and genomes-based pathway analysis using a path analysis model. Mol BioSyst. 10(9):2441–2447.
- El Sharkawi FZ, El Shemy HA, Khaled HM. 2014. Possible anticancer activity of rosuvastatine, doxazosin, repaglinide and oxcarbazepin. Asian Pacific Journal of Cancer Prevention: APJCP. 15(1):199–203.
- English EJ, Mahn SA, Marchese A. 2018. Endocytosis is required for CXC chemokine receptor type 4 (CXCR4)-mediated Akt activation and antiapoptotic signaling. J Biol Chem. 293(29):11470–11480.
- Erdogan B, Webb DJ. 2017. Cancer-associated fibroblasts modulate growth factor signaling and extracellular matrix remodeling to regulate tumor metastasis. Biochem Soc Trans. 45(1):229–236.
- Fang Y, Yu H, Liang X, et al. 2014. Chk1-induced CCNB1 overexpression promotes cell proliferation and tumor growth in human colorectal cancer. Cancer Biol Ther. 15(9):1268–1279.
- Gan Y, Li Y, Li T, et al. 2018. CCNA2 acts as a novel biomarker in regulating the growth and apoptosis of colorectal cancer. Cancer Manag Res. 10:5113–5124.
- Haneke K, Schott J, Lindner D, et al. 2020. CDK1 couples proliferation with protein synthesis. J Cell Biol. 219(3):e201906147.
- Hinderer 3rd EW, Flight RM, Dubey R, et al. 2019. Advances in gene ontology utilization improve statistical power of annotation enrichment. PloS one. 14(8):e0220728.
- Howard D, James D, Murphy K, et al. 2021. Dinaciclib, a bimodal agent effective against endometrial cancer. Cancers (Basel. 13(5):1135.
- Jacobsen A, Bosch LJW, Martens-de Kemp SR, et al. 2018. Aurora kinase A (AURKA) interaction with Wnt and Ras-MAPK signalling pathways in colorectal cancer. Sci Rep. 8(1):7522.
- Ji J, Shen T, Li Y, et al. 2021. CDCA5 promotes the progression of prostate cancer by affecting the ERK signalling pathway. Oncol Rep. 45(3):921–932.
- Jiang P, Liu XS. 2015. Big data mining yields novel insights on cancer. Nat Genet. 47(2):103–104.
- Jiao X, Sherman BT, Huang da W, et al. 2012. DAVID-WS: a stateful web service to facilitate gene/protein list analysis. Bioinformatics. 28(13):1805–1806.
- Kalous J, Jansova D, Susor A. 2020. Role of cyclin-dependent kinase 1 in translational regulation in the M-phase. Cells. 9(7):1568.
- Keum N, Giovannucci E. 2019. Global burden of colorectal cancer: emerging trends, risk factors and prevention strategies. Nature Reviews Gastroenterology & Hepatology. 16(12):713–732.
- Miller I, Min M, Yang C, et al. 2018. Ki67 is a graded rather than a binary marker of proliferation versus quiescence. Cell Rep. 24(5):1105–1112. e5.
- Mlecnik B, Galon J, Bindea G. 2018. Comprehensive functional analysis of large lists of genes and proteins. J Proteomics. 171:2–10.
- Otasek D, Morris JH, Boucas J, et al. 2019. Cytoscape automation: empowering workflow-based network analysis. Genome Biol. 20(1):185.
- Rigoglio NN, Rabelo ACS, Borghesi J, et al. 2020. The tumor microenvironment: focus on extracellular matrix. Adv Exp Med Biol. 1245:1–38.
- Shen A, Liu L, Chen H, et al. 2019. Cell division cycle associated 5 promotes colorectal cancer progression by activating the ERK signaling pathway. Oncogenesis. 8(3):19.
- Siegel RL, Miller KD, Jemal A. 2019. Cancer statistics, 2019. CA Cancer J Clin. 69(1):7–34.
- Sinha D, Duijf PHG, Khanna KK. 2019. Mitotic slippage: an old tale with a new twist. Cell Cycle. 18(1):7–15.
- Subramanian A, Narayan R, Corsello SM, et al. 2017. A next generation Connectivity Map: L1000 platform and the First 1,000,000 profiles. Cell. 171(6):1437–1452. e17.
- Sung H, Ferlay J, Siegel RL. 2021. Global Cancer Statistics 2020: GLOBOCAN Estimates of Incidence and Mortality Worldwide for 36 Cancers in 185 Countries. CA: A Cancer Journal for Clinicians. 71(3):209–249.
- Szklarczyk D, Gable AL, Nastou KC, et al. 2021. The STRING database in 2021: customizable protein-protein networks, and functional characterization of user-uploaded gene/measurement sets. Nucleic Acids Res. 49(D1):D605–d612.
- Takahashi Y, Sheridan P, Niida A, et al. 2015. The AURKA/TPX2 axis drives colon tumorigenesis cooperatively with MYC. Annals of Oncology: Official Journal of the European Society for Medical Oncology. 26(5):935–942.
- Tang Z, Li C, Kang B, et al. 2017. GEPIA: a web server for cancer and normal gene expression profiling and interactive analyses. Nucleic Acids Res. 45(W1):W98–W102.
- Varol C, Sagi I. 2018. Phagocyte-extracellular matrix crosstalk empowers tumor development and dissemination. FEBS J. 285(4):734–751.
- Vlachavas EI, Pilalis E, Papadodima O‚ et al. 2019. Radiogenomic Analysis of F-18-Fluorodeoxyglucose Positron Emission Tomography and Gene Expression Data Elucidates the Epidemiological Complexity of Colorectal Cancer Landscape. Computational and Structural Biotechnology Journal. 17:177–185.
- Wang J, Xia C, Pu M, et al. 2018. Silencing of CDCA5 inhibits cancer progression and serves as a prognostic biomarker for hepatocellular carcinoma. Oncol Rep. 40(4):1875–1884.
- Xiao ZX, Chen RQ, Hu DX, et al. 2017. Identification of repaglinide as a therapeutic drug for glioblastoma multiforme. Biochem Biophys Res Commun. 488(1):33–39.
- Xu W, McArthur G. 2016. Cell cycle regulation and melanoma. Curr Oncol Rep. 18(6):34.
- Yao S, Liu T. 2018. Analysis of differential gene expression caused by cervical intraepithelial neoplasia based on GEO database. Oncol Lett. 15(6):8319–8324.
- Zeng Q, Lei F, Chang Y, et al. 2019. An oncogenic gene, SNRPA1, regulates PIK3R1, VEGFC, MKI67, CDK1 and other genes in colorectal cancer. Biomedicine & Pharmacotherapy = Biomedecine & Pharmacotherapie. 117:109076.
- Zhang P, Kawakami H, Liu W, et al. 2018a. Targeting CDK1 and MEK/ERK overcomes apoptotic resistance in BRAF-Mutant Human colorectal cancer. Molecular Cancer Research: Mcr. 16(3):378–389.
- Zhang Y, Tian S, Li X‚ et al. 2018b. UBE2C promotes rectal carcinoma via miR-381. Cancer Biology & Therapy. 19(3):230–238.
- Zhong R, Chen X, Chen X, et al. 2015. MAD1L1 arg558his and MAD2L1 Leu84Met interaction with smoking increase the risk of colorectal cancer. Sci Rep. 5:12202.