
Abstract
Insulin resistance (IR) is type 2 diabetes’ hallmark. MiRNAs regulate many target genes that makes them attractive candidates for regulating insulin production, secretion and action. Therefore, we anticipate a change in the circulatory profile of miRNAs in IR subjects compared to normal glucose tolerance subjects. In the present study, we sought to identify the circulating miRNAs associated with IR as biomarkers in Qatari population. The circulating miRNA profile was assessed in a pilot study of healthy volunteers (n = 22) whose insulin sensitivity was quantitated by euglycemic hyperinsulemic clamp. Moreover, in the validation phase (n = 40) subjects were added including lean and obese T2D. MiR-186 showed a consistent significant increase in insulin resistance subjects compared to NGT in the discovery and validation phase analysis. In addition, intergroup comparison of circulating miRNA pinpointed 2 miRNAs: MiR-122 increased substantially in obese T2D subjects, with diagnostic value to predict obesity in T2D subjects, and let-7b increased significantly in lean T2D subjects. Our results suggest that circulating miRNAs serve as biomarkers for IR, T2D and obesity in Qatari population. Further functional studies are warranted to better identify the targets of these miRNAs and understand the underlying molecular and cellular mechanisms.
Background
The worldwide incidence of insulin-resistance (IR) ranges between 15.5% and 46.5% among adults, and it varies across countries (Fahed et al. Citation2020). The epidemiologic evaluation of IR is assessed in association with the metabolic syndrome prevalence (Jaber et al. Citation2004). Previous studies have shown that IR is estimated to be 15.5% in European countries (Friedrich et al. Citation2012), while higher rates, 23.3%, are reported in Thailand (Do et al. Citation2010), 39.1% in the USA (Qu et al. Citation2011), and 46.5% in Venezuela (Bermudez et al. Citation2016). The Middle East Region is reported to have the highest rate of IR, reaching 44.6% (Naja et al. Citation2012).
IR is a major risk factor of a myriad of metabolic diseases including T2D, CVD, NAFLD characterized by an inadequate response of insulin’s target cells of at physiological insulin concentrations (Ralph A. DeFronzo and Tripathy Citation2009), compensated by insulin hypersecretion resulting in hyperinsulinemia (Shanik et al. Citation2008). In addition, IR is strongly associated with obesity since most individuals with IR are overweight or obese, and it is a central element in type 2 diabetes’s pathophysiology, which associates a lack of insulin sensitivity and secretion (Taylor Citation2012; H. Ye Citation2013; Wu and Ballantyne Citation2020). More importantly, IR can precede the onset of diabetes by 5–7 years (Freeman et al. Citation2021). So far, there is no diagnostic method of IR. The search for precise biomarkers of IR would enable us to confirm the development of IR and the efficiency of lifestyle changes at the earliest time point when β-cell function is still functioning. IR is mainly manifested by a lack of action of insulin on target tissues, which are the insulin-sensitive organs, including muscle heart, skeletal muscle, fatty tissue, and liver (Beale Citation2013). IR is caused by several factors, including genetic (Brown and Walker Citation2016), inflammatory (de Luca and Olefsky Citation2008), endoplasmic reticulum (ER) stress (Flamment et al. Citation2012), and epigenetic factors (C. Ling and Rönn Citation2016). Though a meticulous understanding of some mechanisms, positively or negatively regulating IR, has been already investigated, new classes of epigenetic factors are emerging as regulators of multiple pathways and processes in individuals with IR (Chakraborty et al. Citation2014; La Sala et al. Citation2018).
MicroRNAs (miRNAs) have emerged as potential biomarkers in diseases (Roser et al. Citation2018). MiRNAs are small non-coding RNAs of approximately 22 nucleotides, capable of binding to complementary mRNAs and forming an RNA double-stranded, which will be degraded by the cell, thereby inhibiting translation of the targeted mRNA (Felekkis et al. Citation2010; H. Wahid et al. Citation2010; Ling et al. Citation2013). Moreover, miRNAs isolated from biofluids, including blood, urine, and saliva exhibit much higher stability than mRNAs (Weber et al. Citation2010; Mall et al. Citation2013; Glinge et al. Citation2017). MiRNAs are involved in many physiological processes, including proliferation, apoptosis, and differentiation (Hwang and Mendell Citation2006; Schickel et al. Citation2008; Othman and Nagoor Citation2014; Tüfekci et al. Citation2014). Each cell type has a specific repertoire of miRNAs contributing to the cell’s functionality according to the tissue context (Juzenas et al. Citation2017). Therefore, it is not surprising that specific miRNAs’ deregulation is associated with the development of specific pathologies in humans (Dongiovanni et al. Citation2018; Elemeery et al. Citation2019; A. Jones et al. Citation2017; F. J. Ortega et al. Citation2013; Yan et al. Citation2020). Several studies revealed miRNA deregulation related to metabolic disorders such as T2DM and obesity (A. Jones et al. Citation2017; Yan et al. Citation2020). The assay of miRNAs in body fluids can reflect the molecular changes in the cells from which they are derived and thus provide information to aid diagnosis and therapeutic decision-making. The same miRNA is not always specific to a cell or a tissue; consequently, the best approach is to assay a miRNA panel, which can constitute a sort of ‘signature’ characteristic of a given pathology.
The present study aims to identify differentially expressed miRNAs in the plasma of IR subjects compared to normal glucose tolerant (NGT) individuals in the Qatari Arab population. A distinct circulatory profile of miRNAs in IR versus NGT subjects could provide a signature for identifying IR subjects among the Arab population. Moreover, differentially expressed miRNA molecules in IR subjects could serve as signaling molecules, which convey messages between IR tissues, i.e. liver, skeletal muscle and adipocytes, and the β-cell. The evaluation of insulin resistance was performed using the euglycemic clamp procedure, and the identification of differentially-expressed miRNA was carried out using next-generation sequencing and quantitative real-time PCR analyses. The results revealed a role of miR-186 in IR, elevated circulating miR-122 as a biomarker candidate for obesity, and let-7b as a T2D biomarker in the Qatari population.
Materials and methods
Study subjects’ characteristics
Discovery phase
Twenty-two samples collected from young, healthy volunteers received a euglycemic insulin clamp to quantitate whole-body insulin sensitivity (Kim Citation2009). The clinical characteristics of the individuals are presented in (Table ). We divided the samples into two groups according to their insulin sensitivity. Insulin resistance subjects (N = 12; mean age = 38 ± 2 years; mean BMI = 31.5 ± 1.8 kg/m2; Fasting Glucose = mean 5.5 ± 0.2 mM/L; 2h-Plasma Glucose = 7.4 ± 0.5 mM/L; GIR = 3.4 ± 0.2 mg/min) and normal glucose tolerance subjects (N = 10; age = 33 ± 2 years; BMI = 26.9 ± 2.1 kg/m2; FPG = 5.5 ± 0.2 mM/L; 2h-PG = 6.3 ± 0.5 mM/L; GIR = 9.2 ± 0.5 mg/min).
Table 1. Clinical characteristics of the participants included in the NGS discovery study and in the validation.
Validation phase
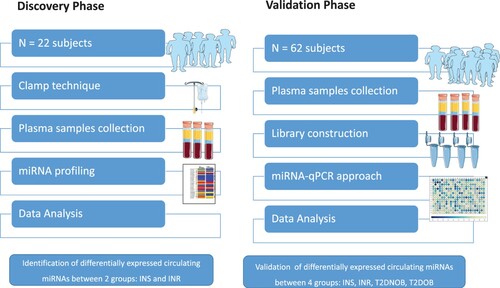
The most relevant significant circulating miRNAs for IR were validated in 62 subjects. 62 subjects include 20 lean T2D and 20 T2D Obese patients, and 22 individuals recruited in the discovery phase. The detailed characteristics of the 40 individuals included in the validation study are presented in (Table ). A total of 20 T2D non-obese patients (BMI mean ± SD BMI 24.2 ± 1.68 kg/m2), and another 20 T2D obese (mean BMI 40.69 ± 4.94 kg/m2), were collected from the specialized outpatient clinic for diabetes in Hamad Hospital Corporation HMC, Doha-Qatar (Figure ).
Figure 1. The experimental study design. Abbreviations: NGT (Normal Glucose Tolerance), IR (Insulin resistance), Lean T2D (lean Type 2 diabetes), obese T2D (obese Type 2 diabetes).
Insulin sensitivity evaluation
Insulin sensitivity (IS) is assessed with a sophisticated technique known as the hyperinslunemic–euglycemic clamp (R. A. DeFronzo et al. Citation1979; Kim Citation2009). Briefly, the subject’s admission to the research clinic unit is at 7 am. Catheters infixed in the back of the hand’s veins in the antecubital fossa enable the infusion of insulin and dextrose. To direct dextrose's infusion rate, a small blood volume is withdrawn at 5 min interval from the catheter. The blood is later analyzed by HemoCue Glucose 201+ (HemoCue AB, Angelholm, Sweden) for the glucose level. Keeping the insulin infusion rate constant (100 IU/ml insulin solution, Actrapid) during the clamp technique test at [80 mU/body surface area (m2)/min]. The body surface is calculated. The blood glucose level was regulated by infusing 20% dextrose, adjusted every 5 min to reach the desired stable blood glucose target of 90 mg/dL (5 mmol/L) for 120 min under the hyperinsulinemic-euglycemic clamp. The hyperinsulinemia euglycemic clamp technique duration was 2 h. The metabolized glucose is calculated during the second hour of insulin clamp from the infusion rate of exogenous glucose (M-value) (milligrams of infused glucose per kilogram of body mass per minute [mg/kg/min]) (Uwaifo et al. Citation2002; Tam et al. Citation2012; Zhang et al. Citation2018).
Sample collection
After blood collection, plasma samples were obtained by immediate centrifugation at 1500 × g for 15 min. The samples were stored in aliquot polypropylene test tubes and kept frozen at −80°C, avoiding thawing/refreezing cycles before experimental analysis (Tuck et al. Citation2009). The study protocol was approved by the Board of the Ethical Committee of Hamad Medical Corporation (HMC ethical committee) with MRC study ID 15-00002, and informed written consent was obtained from participants prior to enrollment.
MiRNA extraction
For deep micro-RNA sequencing, circulating RNA species were extracted from plasma samples using the miRNeasy Serum/Plasma Kit (Qiagen, Germany). For RT–PCR investigations, total RNA was isolated from plasma utilizing the miRCURY RNA isolation kit – biofluids (Exiqon, Vedbaek, Denmark). All assays were carried out as per the manufacturers’ recommendations. The RNA concentration and quality were first quantified using the NanoDrop ND-2000 spectrophotometer (NanoDrop Technologies, DE) and Qubit RNA HS assay (ThermoFisher, USA). RNA purity and integrity were estimated with the Bioanalyzer 2100 (Agilent Technologies, CA) using Agilent small RNA kit and small RNA chips (Agilent, CA) (Masotti and Preckel Citation2006); RNA quality ratio was between 1.8–2. The RNA samples were aliquoted and stored at −80°C until assayed.
Library construction and deep sequencing
A small RNA library was constructed from a purified sample using the Illumina Truseq Small RNA Preparation kit according to Illumina’s TruSeq Small RNA Sample Preparation Guide by LC Sciences (www.lcsciences.com) (Dard-Dascot et al. Citation2018). The purified cDNA libraries were pooled and used for cluster generation on Illumina’s Cluster Station and then sequenced on Illumina GAIIx following Illumina’s instruction for running the platform. Raw sequencing reads (40 nts) were obtained using Illumina’s Sequencing Control Studio software version 2.8 (SCS v2.8) following real-time sequencing image analysis and base-calling by Illumina's Real-Time Analysis version 1.8.70 (RTA v1.8.70). Then, a proprietary pipeline script, ACGT101-miR v4.2 (LC Sciences), was utilized for sequencing data analysis. Library construction and sequencing were performed at LC Sciences (Houston, USA).
Data analysis
After the raw sequence files base call files (BCL files) were extracted from image data and converted to Fastq, a series of digital filters (LC Sciences) were performed to remove various unmappable sequencing reads. Various alignments were performed on unique seqs against pre-miRNA (mir) and mature miRNA (miR) sequences listed in the latest release of miRBase database or genome based on the public releases of appropriate species. Aligned fastq was also done on miRs of interest against genome sequence. Methods and criteria used for various mappings were documented in the ACGT-101 User’s Manual. Functional annotation, enrichment analyses and miRNA target filter were conducted using Ingenuity Pathways Analysis (IPA) software (Ingenuity Systems; www.ingenuity.com/) as previously described (Shaath et al. Citation2019).
Statistical analysis
The amplification efficiency was calculated using algorithms similar to the LinReg software. All assays were inspected for distinct melting curves and the Tm was checked to be within known specifications for the assay. Furthermore, assays must be detected with 5 Cqs less than the negative control, and with Cq < 37 to be included in the data analysis. Data that did not pass these criteria were omitted from any further analysis. Cq was calculated as the second derivative. Using NormFinder the best normalizer was found to be the average of assays detected in all samples. All data were normalized to the average of assays detected in all samples (average – assay Cq). Statistical analyses and graphing were performed using Microsoft excel 2016 and GraphPad Prism 8.0 software (GraphPad, San Diego, CA, USA). For comparative qRT-PCR analysis, p-values ≤ 0.05 (t-test) were considered significant.
Results
Clinical characteristics showed significant changes among insulin resistance and normal glucose tolerant volunteers
The clinical characteristics of the individuals included in the study are summarized in Table . There were no significant differences in age or gender between the groups. As expected, body mass index (BMI) was significantly higher in the obese subjects. When comparing NGT group and IR group, no significant difference was observed in FPG. However, the GIR and GD were significantly lower in IR patients and 2H-PG was significantly higher in IR subjects.
MiRNAs profiling in insulin-resistant subjects revealed a significant increase in hsa-miR-186 in Qatari population.
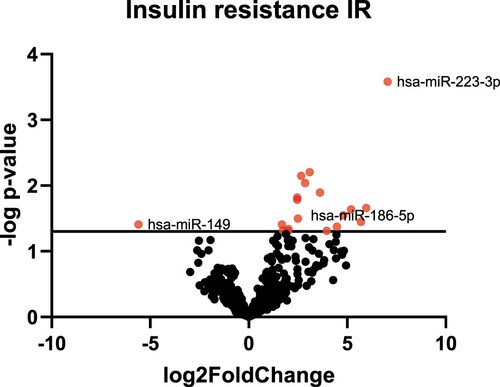
To identify circulating miRNAs involved in the regulation of insulin resistance and insulin sensitivity, we first performed miRNA profiling analysis with plasma samples from insulin-sensitive individuals and insulin-resistance subjects. Sequencing of the small circulating RNA isolated from IR and NGT subjects produced 69,559,764 raw reads. Primary analysis revealed 251 miRNAs with number of reads > 0. We pooled samples within NGT and IR subjects, which reduced sample variation and enriched for miRNAs most likely to change between groups. Fold changes >2 or below −2 with significant p-value were considered for further analyses. Accordingly, 17 circulating miRNAs were found to be differentially expressed between NGT and IR individuals, in which 16 were upregulated, and one miRNA was downregulated (Figure ) (Table S1).
Figure 2. Global circulating miRNA expression profile. The volcano plot shows the results of differentially expressed circulating miRNAs. NGT: Normal Glucose Tolerance group, IR: Insulin Resistance Group.
Insulin resistance deregulated miRNAs expression is associated with downregulated metabolic and endocrine molecular profile
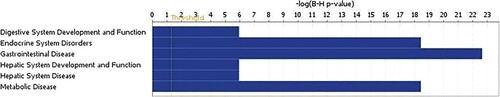
To gain more insight into plausible roles for deregulated miRNAs in IR pathology, differentially expressed miRNAs were subjected to Ingenuity Pathway Analysis (IPA) and downstream effect analysis (DEA). Affected functional categories are illustrated as a heat tree map, which clusters functionally associated categories together, depicting a high-level outlook of upregulated and downregulated functional categories. Data presented revealed several metabolic diseases that were under presented (Figure ).
Figure 3. Pathway analysis of the differentially expressed circulating miRNAs in IR groups.
Validation analysis identifies hsa-miR-186 as a potential biomarker for IR in Qatari population
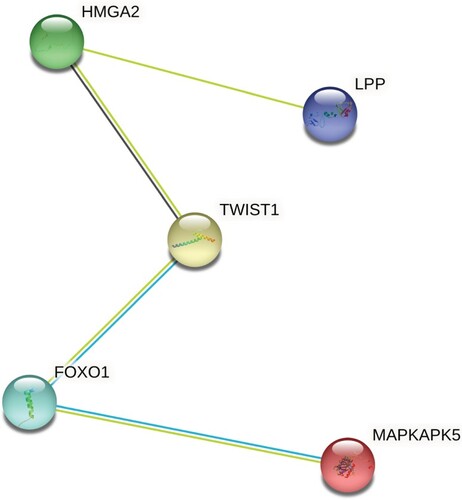
To validate the possibility of using miRNAs as a biomarker for insulin resistance, plasma miRNAs levels were individually determined by qRT-PCR. Several miRNAs previously reported in the literature in insulin resistance pathology and type 2 diabetes were added to the validation phase study. For normalization of the data, the average of the assays detected in all samples (n = 62 samples) was applied, as this was found to be the most stable normalizer. Consistent with miRNA sequencing profiling, we found that the hsa-miR-186 relative expression levels were markedly higher in IR groups; with a 2.8-fold increase compared to NGT subjects (Figure ). To further explore the association of circulating miRNAs to IR, we added two groups 20 non-obese T2D diabetics and 20 obese T2D patients. We aimed to identify those mRNAs targeted by miR-186 and serve as its potential effectors in disease progression. Using a stringent bioinformatics approach, we identified a group of putative miR-186 targets (Figure ) (Table S2). Interestingly, the targets were involved in insulin receptor signaling pathway, including transcription factor FOXO1 signaling (Figure ).
Figure 4. hsa-miR-186 significantly overexpressed in IR subjects. No significant difference in expression between NGT and lean type 2 diabetes. No significant difference in expression between NGT and Obese type 2 diabetes.
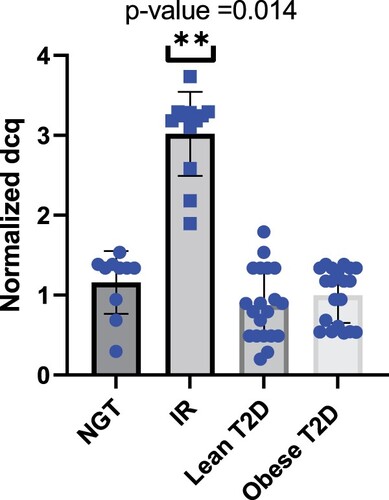
Figure 5. Hsa-miR-186 targets network analysis.
Elevated circulating hsa-miR-122 is associated with obesity in Qatari population
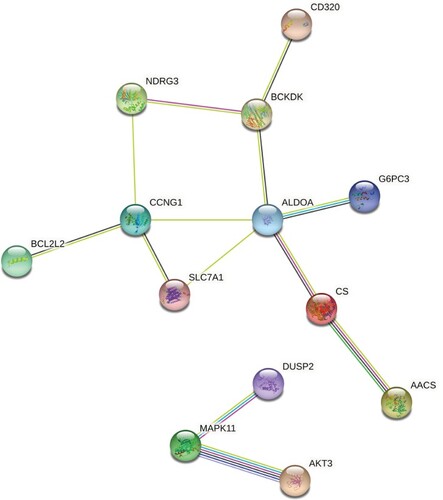
To investigate whether the levels of circulating miR-122 exhibited deregulation in plasma of patients with T2D and obesity, we measured the levels of hsa-miR-122 in the validation phase in cohort subjects including NGT, IR, lean T2D and obese T2D. As shown in Figure , there was no statistical significance change between insulin resistance and NGT groups. However, circulating miR-122 showed a tendency to increase with 2.7 fold change in lean type 2 diabetics and even higher increase with fold change of 5.11 in accordance with the degree of obesity. In addition, ROC curve analyses were performed to evaluate the diagnostic value of miR-122 as the best candidate biomarker for obesity. The AUC generated equals 0.9 with a standard error of 0.05734, confidence interval 95% = 0.7902–1.01 for discriminating T2D-Ob from healthy control (Figure ). Network analysis was performed using the STRING (Search Tool for the Retrieval of Interacting Genes/Proteins) and IPA (ingenuity pathway analysis) databases. According to the IPA database, miR-122 targets are more than 618 predicted genes. However, to be able to manage this huge network of predicted genes interactions, we focused on the experimentally validated miRNA targets reported on TarBase, miRecords, TargetScan and Ingenuity Expert Findings. The targets of miR-122 are involved in important cellular pathways in relation to obesity such as insulin receptor signaling, Apelin Adipocyte Signaling Pathway, and PI3K/AKT Signaling (Figure ) (Table S3).
Figure 6. miR-122 expression in the plasma samples of subjects with the normal glucose tolerance NGT, insulin resistance IR, lean type 2 diabetes (lean T2D) and obese type 2 diabetes (obese T2D). Lean T2D had significant higher expression when compared to healthy controls and even higher expression in obese T2D.
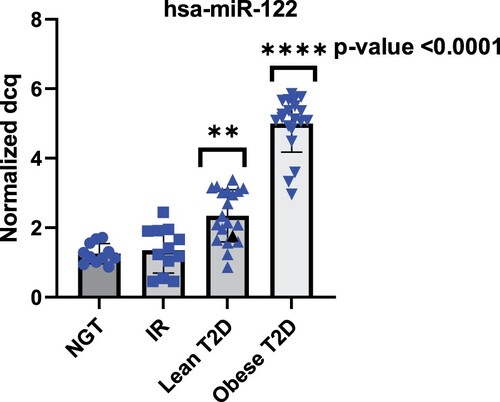
Figure 7. ROC curve showing performance of miR-122 in diagnosing obesity in T2D patients.
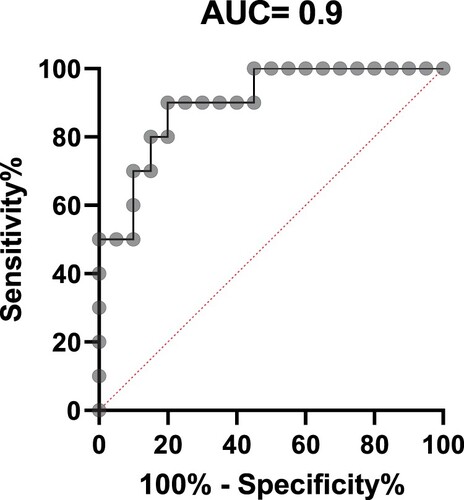
Figure 8. Hsa-miR-122 network analysis with experimentally observed targets.
Let7b-5p is upregulated in the plasma of Qatari subjects with lean type 2 diabetes
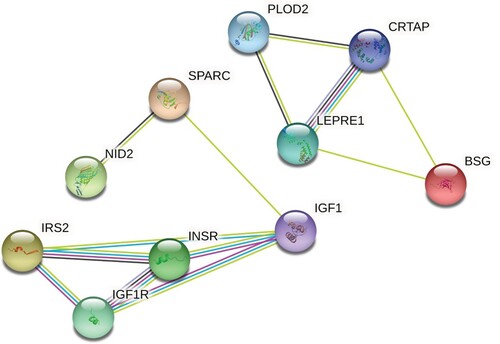
According to the literature, there is a significant increase in circulating let-7b in type 2 diabetes patients (Taheri et al. Citation2020) (Jones et al. 2017). To gain insight into the expression pattern of let-7b in Qatari population, we measured the expression of let-7b in NGT, IR, lean T2D and obese T2D subjects. Hsa-let-7b showed significant increase in lean T2D with (p-value = 0.0221) (Figure ). Network of interactions among the proteins encoded by the set of genes targets of hsa-let-7b focusing on molecular pathways involved in T2D pathogenesis was performed using the STRING (Search Tool for the Retrieval of Interacting Genes/Proteins) and IPA (ingenuity pathway analysis) databases. Different genes are involved in different (one or more) T2D-related pathways. IPA generated reports the pathways and the name of the target genes observed in each pathway (Figure ) (Table S4).
Figure 9. Hsa-let-7b expression increases in lean T2D subjects.
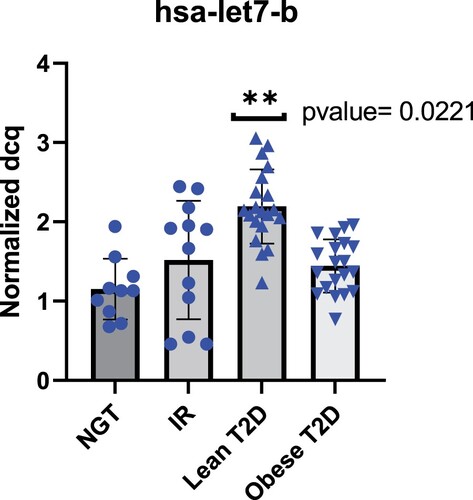
Figure 10. Hsa-let-7b network analysis with experimentally observed targets, T2D pathogenesis related.
Discussion
Recent studies have demonstrated miRNAs play an essential role in many human complex diseases, including diabetes (Y. Li and Kowdley Citation2012; Yaribeygi et al. Citation2018; Deng and Guo Citation2019). In addition, circulating miRNAs are now considered as potential biomarkers because they are stable and resistant and are modified under disease conditions (Allegra et al. Citation2012; H. Wang et al. Citation2018). The ability of miRNAs simultaneously regulates many target genes makes them attractive candidates for regulating insulin production/secretion and action (Nigi et al. Citation2018; Aghaei et al. Citation2020). MiRNAs are secreted to the circulation and are taken up from several tissues, making them an attractive mechanism for inter-tissue signaling molecules (Mori et al. Citation2019). Consequently, if microRNA plays role in the pathogenesis of insulin resistance or insulin resistance inter-tissues communication to regulate the level of β-cell function in concert with the prevailing level of insulin resistance. A change in the microRNA level in insulin resistance individuals compared to insulin sensitive individuals is anticipated (Jiménez-Lucena et al. Citation2018; Francisco J. Ortega et al. Citation2014). Few studies on the effect of circulating miRNAs in insulin resistance have involved Arab population. Among these studies, none used a clamp technique to assess insulin resistance (Alzaman and Ali Citation2016). In our study, we have utilized the gold standard method to assess insulin sensitivity; this technique is extensively used to understand the etiology and pathogenesis of type 2 diabetes (Muniyappa et al. Citation2008; Kim Citation2009). In addition, this study sought to explore the changes of circulating miRNAs as a fingerprint for Insulin resistance in Qatari population using a combination of next-generation sequencing discovery phase and miRNA-qPCR validation platform.
Herein, we identified several circulating miRNAs associated with IR in the discovery phase. Our initial investigation included two groups (n = 22), NGT and IR. We have applied miRNA deep sequencing to understand the dynamic relationship between circulating miRNAs and IR subjects. The non-targeted analysis was used in the discovery cohort to determine how insulin resistance may influence miRNA profile. Interestingly, hsa-miR-186 was the only miRNA, which is upregulated in the IR group with a fold change of 2.8 in the discovery phase, and gave consistent results in the validation phase. A few reports identified the favorable diagnostic performance of circulating miR-186-5p for predicting the presence of insulin resistance at early stages of metabolic dysregulation (Jiang et al. Citation2018; Z. Li et al. Citation2019). Analysis of the changes in serum miR-186-5p levels in different groups (NGT, IR, lean T2D and Obese T2D) showed that miR-186 was significantly increased in IR subjects and decrease in lean T2D subjects. This emphasizes the importance of circulating hsa-miR-186 as a diagnostic biomarker during the first development phase of type 2 diabetes, when signs of insulin resistance have not emerged yet. Previous studies outlined the role of hsa-miR-186 across different diseases (Z. Wang et al. Citation2019), miR-186 dysregulation in blood, plasma, and urine samples propose it as a good diagnostic biomarker. It plays different roles in biological processes such as intracellular metabolism, cell cycle regulation, apoptosis, angiogenesis, and proliferation (Cai et al. Citation2013; R. Wang et al. Citation2018; S. Wu et al. Citation2019). Network analysis of hsa-miR-186 revealed targets that are directly involved in insulin signaling. One of the known miR-186 targets includes transcription factor Foxo1 (Myatt et al. Citation2010) involved in insulin receptor signaling (Martinez et al. Citation2006). It is also regulated by insulin and has been associated with insulin resistance (O-Sullivan et al. Citation2015). Concurrent with our results, a previous study revealed SIRT1 as an important player in hepatic insulin resistance along with Rictor, Akt, and Foxo1 through gluconeogenesis regulation. SIRT1 regulates Rictor which triggers phosphorylation cascade of Akt and Foxo1, eventually results in decreasing G6pase and Pepck leading to glucose overproduction and chronic hyperglycemia. The disruption of the mTorc2/Akt signaling pathway leads to insulin resistance (R. H. Wang et al. Citation2011). Noteworthy, bioinformatics prediction tools miRDB (http://mirdb.org/) revealed SIRT1 as a target of miR-186.
On the other hand, studies of T2D patients from the Middle East showed a younger age at onset, a higher prevalence of family history, and a more rapid decline in pancreatic β-cell function and high prevalence of severe obesity, suggesting that they may have a different form of T2D and that the pathogenesis of T2D may be ethnicity specific (Mirmiran et al. Citation2010; Gagliardino et al. Citation2017; Meo et al. Citation2019; Kalan Farmanfarma et al. Citation2020). This urged us to included 40 subjects classified as 20 lean T2D and 20 obese T2D. We also included the samples of the previously recruited individuals from the discovery phase. Circulating miR-122 analysis conferred moderate diagnostic accuracy for obesity, with AUC of 0.82. MiR-122 is considered a good biomarker candidate of obesity in the studied population (Angela Jones et al. Citation2017). Our results revealed a significant increase in lean T2D, and showed a substantial upregulation in obese T2D with 5.11-fold change compared to NGT subjects. Previous findings from experimental studies investigating the association of circulating miRNAs levels with obesity indicated overexpression of circulating miR-122 and its positive correlation with obese IR young adults (R. Wang et al. Citation2015). In addition, circulating miR-122 showed a strong association with insulin resistance, obesity, type 2 diabetes, and metabolic syndrome (Willeit et al. Citation2017; Hess et al. Citation2020). Furthermore, elevated miR-122 in serum is related to non-alcoholic fatty liver disease in Type 2 diabetes mellitus (Yamada et al. Citation2013). Accumulating evidence indicates miR-122 regulatory role in various physiological and pathological processes, such as lipid metabolism (Hu et al. Citation2012). The first miRNA linked to metabolic control, miR-122, is primarily expressed in the liver and is initially shown to affect hepatic cholesterol and fatty-acid metabolism in mice (Rottiers and Näär Citation2012). The network analysis of miR-122 revealed many targets; therefore, we mainly focused on the experimentally validated targets. IPA revealed a link to inflammation and immunity and well-known complications of obesity such as type 2 diabetes. AKT3 is particularly interesting since this gene inhibits adipogenesis and protects from diet-induced obesity via WNK1/SGK1 signaling (Ding et al. Citation2017).
Moreover, it is well established that population differences observed for complex traits such as T2D may be attributed to the combined effect of environmental, genetic, and epigenetic factors (Huang et al. Citation2011). For a better understanding of the differences in Qatari population, we included hsa-let-7b in the validation phase and analyzed expression level among all groups. Hsa-let-7b revealed a significant positive association to lean T2D subjects. It is well established that let-7 miRNA family is one of the top expressed miRNAs in human islets implicated in glucose homeostasis (Frost and Olson Citation2011). In line with our results, a study done in Emirati patients showed serum levels of let7b-5p are significantly (p < 0.05) higher in T2DM-patients or T2DM with complications compared to control subjects (Aljaibeji et al. Citation2020). Let-7b targets pathway analysis also revealed its involvement in type 2 diabetes-related pathway.
Overall, this study represents the first analysis associating circulating miRNAs and insulin resistance with results proposing unique miRNA signature as new biomarkers for IR in the Qatari Arab population. This study supports the hypothesis of the potential implication of miRNA in the regulation of insulin action in targeted tissues, particularly in Arab ethnicity. It also provides clinical evidence revealing dysregulated miRNAs in insulin resistance, obesity and type 2 diabetes. Our findings suggest that circulating miR-186, miR-122, and let-7b act as a promising biomarker of insulin resistance, obesity and type 2 diabetes, respectively.
Future studies would be to unravel the mechanisms through which changes in miR-186, miR-122 and let-7b lead to insulin resistance.
Supplemental Material
Download MS Excel (37.6 KB)Acknowledgements
Open Access funding provided by the Qatar National Library.
Disclosure statement
No potential conflict of interest was reported by the author(s).
Data availability
Due to the nature of this research, participants of this study did not agree for their data to be shared publicly, so supporting data is not available.
Additional information
Funding
References
- Aghaei M, Khodadadian A, Elham K-N, Nazari M, Babakhanzadeh E. 2020. Major miRNA involved in insulin secretion and production in beta-cells. Int J Gen Med. 13:89.
- Aljaibeji H, Elemam NM, Mohammed AK, Hasswan H, Thahyabat MA, Alkhayyal N, Sulaiman N, Taneera J. 2020. Let7b-5p is upregulated in the serum of Emirati patients with type 2 diabetes and regulates insulin secretion in INS-1 cells. Exp Clin Endocrinol Diabetes. doi:10.1055/a-1261-5282.
- Allegra A, Alonci A, Campo S, Penna G, Petrungaro A, Gerace D, Musolino C. 2012. Circulating microRNAs: New biomarkers in diagnosis, prognosis and treatment of cancer (review). Int J Oncol. 41(6):1897–1912. doi:10.3892/ijo.2012.1647.
- Alzaman N, Ali A. 2016. Obesity and diabetes mellitus in the Arab world. J Taibah Univ Med Sci. 11(4):301–309. doi:10.1016/j.jtumed.2016.03.009.
- Beale EG. 2013. Insulin signaling and insulin resistance. J Invest Med. 61(1):11. doi:10.2310/JIM.0b013e3182746f95.
- Bermudez V, Salazar J, Martínez MS, Chávez-Castillo M, Olivar LC, Calvo MJ, Palmar J, Bautista J, Ramos E, Cabrera M, et al. 2016. Prevalence and associated factors of insulin resistance in adults from Maracaibo City, Venezuela. Adv Prev Med. 2016:9405105. doi: 10.1155/2016/9405105.
- Brown AE, Walker M. 2016. Genetics of insulin resistance and the metabolic syndrome. Curr Cardiol Rep. 18(8):75. doi:10.1007/s11886-016-0755-4.
- Cai J, Wu J, Zhang H, Fang L, Huang Y, Yang Y, Zhu X, Li R, Li M. 2013. miR-186 downregulation correlates with poor survival in lung adenocarcinoma, where it interferes with cell-cycle regulation. Cancer Res. 73(2):756–766.
- Chakraborty C, Doss CG, Bandyopadhyay S, Agoramoorthy G. 2014. Influence of miRNA in insulin signaling pathway and insulin resistance: micro-molecules with a major role in type-2 diabetes. Wiley Interdiscip Rev RNA. 5(5):697–712. doi:10.1002/wrna.1240.
- Dard-Dascot C, Naquin D, d’Aubenton-Carafa Y, Alix K, Thermes C, van Dijk E. 2018. Systematic comparison of small RNA library preparation protocols for next-generation sequencing. BMC Genomics. 19(1):118. doi:10.1186/s12864-018-4491-6.
- DeFronzo RA, Tobin JD, Andres R. 1979. Glucose clamp technique: a method for quantifying insulin secretion and resistance. Am J Physiol. 237(3):E214–E223. doi:10.1152/ajpendo.1979.237.3.E214.
- DeFronzo RA, Tripathy D. 2009. Skeletal muscle insulin resistance Is the Primary defect in type 2 diabetes. Diabetes Care. 32(suppl 2):S157. doi:10.2337/dc09-S302.
- de Luca C, Olefsky JM. 2008. Inflammation and insulin resistance. FEBS Lett. 582(1):97–105. doi:10.1016/j.febslet.2007.11.057.
- Deng J, Guo F. 2019. MicroRNAs and type 2 diabetes. ExRNA. 1(1):36. doi:10.1186/s41544-019-0038-5.
- Ding L, Zhang L, Biswas S, Schugar RC, Brown JM, Byzova T, Podrez E. 2017. Akt3 inhibits adipogenesis and protects from diet-induced obesity via WNK1/SGK1 signaling. JCI Insight. 2:22. doi:10.1172/jci.insight.95687.
- Do HD, Lohsoonthorn V, Jiamjarasrangsi W, Lertmaharit S, Williams MA. 2010. Prevalence of insulin resistance and its relationship with cardiovascular disease risk factors among Thai adults over 35 years old. Diabetes Res Clin Pract. 89(3):303–308.
- Dongiovanni P, Meroni M, Longo M, Fargion S, Fracanzani AL. 2018. miRNA signature in NAFLD: A turning point for a Non-invasive diagnosis. Int J Mol Sci. 19:12. doi:10.3390/ijms19123966.
- Elemeery MN, Mohamed MA, Madkour MA, Shamseya MM, Issa NM, Badr AN, Ghareeb DA, Pan CH. 2019. MicroRNA signature in patients with hepatocellular carcinoma associated with type 2 diabetes. World J Gastroenterol. 25(42):6322–6341. doi:10.3748/wjg.v25.i42.6322.
- Fahed M, Abou Jaoudeh MG, Merhi S, Mosleh JMB, Ghadieh R, Al Hayek S, Fares JEEH. 2020. Evaluation of risk factors for insulin resistance: a cross sectional study among employees at a private university in Lebanon. BMC Endocr Disord. 20(1):1–14.
- Felekkis K, Touvana E, Stefanou C, Deltas C. 2010. microRNAs: a newly described class of encoded molecules that play a role in health and disease. Hippokratia. 14(4):236–240.
- Flamment M, Hajduch E, Ferré P, Foufelle F. 2012. New insights into ER stress-induced insulin resistance. Trends Endocrinol Metab. 23(8):381–390. doi:10.1016/j.tem.2012.06.003.
- Freeman AM, Pennings N. 2021. Insulin resistance. In: StatPearls [internet]. Treasure Island (FL): StatPearls Publishing.
- Friedrich N, Thuesen B, Jørgensen T, Juul A, Spielhagen C, Wallaschofksi H, Linneberg A. 2012. The association between IGF-I and insulin resistance: a general population study in Danish adults. Diabetes Care. 35(4):768–773.
- Frost RJA, Olson EN. 2011. Control of glucose homeostasis and insulin sensitivity by the Let-7 family of microRNAs. Proc Natl Acad Sci USA. 108(52):21075–21080.
- Gagliardino JJ, Atanasov PK, Chan JCN, Mbanya JC, Shestakova MV, Leguet-Dinville P, Annemans L. 2017. Resource use associated with type 2 diabetes in Africa, the Middle East, South Asia, Eurasia and Turkey: results from the International Diabetes Management Practice Study (IDMPS). BMJ Open Diabetes Res Care. 5(1):e000297. doi:10.1136/bmjdrc-2016-000297.
- Glinge C, Clauss S, Boddum K, Jabbari R, Jabbari J, Risgaard B, Tomsits P, Hildebrand B, Kääb S, Wakili R, et al. 2017. Stability of circulating blood-based microRNAs – Pre-analytic methodological considerations. PloS one. 12(2):e0167969. doi:10.1371/journal.pone.0167969.
- Hess AL, Larsen LH, Udesen PB, Sanz Y, Larsen TM, Dalgaard LT. 2020. Levels of circulating miR-122 are associated with weight loss and metabolic syndrome. Obesity. 28(3):493–501.
- Hu J, Xu Y, Hao J, Wang S, Li C, Meng S. 2012. MiR-122 in hepatic function and liver diseases. Protein Cell. 3(5):364–371.
- Huang RS, Gamazon ER, Ziliak D, Wen Y, Im HK, Zhang W, Wing C, Duan S, Bleibel WK, Cox NJ, Dolan ME. 2011. Population differences in microRNA expression and biological implications. RNA Biol. 8(4):692–701. doi:10.4161/rna.8.4.16029.
- Hwang HW, Mendell JT. 2006. MicroRNAs in cell proliferation, cell death, and tumorigenesis. Br J Cancer. 94(6):776–780. doi:10.1038/sj.bjc.6603023.
- Jaber LA, Brown MB, Hammad A, Zhu Q, Herman WH. 2004. The prevalence of the metabolic syndrome among Arab Americans. Diabetes Care. 27(1):234–238.
- Jiang J, Mo H, Liu C, Wu B, Wu Z, Li X, Li T, He S, Li S, You Q, et al. 2018. Inhibition of miR–186–5p contributes to high glucose–induced injury in AC16 cardiomyocytes. Exp Ther Med. 15(1):627–632. doi:10.3892/etm.2017.5445.
- Jiménez-Lucena R, Camargo A, Alcalá-Diaz JF, Romero-Baldonado C, Luque RM, van Ommen B, Delgado-Lista J, Ordovás JM, Pérez-Martínez P, Rangel-Zúñiga OA, López-Miranda J. 2018. A plasma circulating miRNAs profile predicts type 2 diabetes mellitus and prediabetes: from the CORDIOPREV study. Exp Mol Med. 50(12):1–12. doi:10.1038/s12276-018-0194-y.
- Jones A, Danielson KM, Benton MC, Ziegler O, Shah R, Stubbs RS, Das S, Macartney-Coxson D. 2017a. miRNA signatures of insulin resistance in obesity. Obesity (Silver Spring). 25(10):1734–1744. doi:10.1002/oby.21950.
- Juzenas S, Venkatesh G, Hübenthal M, Hoeppner MP, Du ZG, Paulsen M, Rosenstiel P, Senger P, Hofmann-Apitius M, Keller A, et al. 2017. A comprehensive, cell specific microRNA catalogue of human peripheral blood. Nucleic Acids Res. 45(16):9290–9301. doi:10.1093/nar/gkx706.
- Kalan Farmanfarma KH, Ansari-Moghaddam A, Zareban I, Adineh HA. 2020. Prevalence of type 2 diabetes in middle–east: Systematic review& meta-analysis. Prim Care Diabetes. 14(4):297–304. doi:10.1016/j.pcd.2020.01.003.
- Kim JK. 2009. Hyperinsulinemic-euglycemic clamp to assess insulin sensitivity in vivo. Methods Mol Biol. 560:221–238. doi:10.1007/978-1-59745-448-3_15.
- La Sala L, Micheloni S, De Nigris V, Prattichizzo F, Ceriello A. 2018. Novel insights into the regulation of miRNA transcriptional control: implications for T2D and related complications. Acta Diabetol. 55(10):989–998. doi:10.1007/s00592-018-1149-4.
- Li Y, Kowdley KV. 2012. MicroRNAs in common human diseases. Genomics Proteomics Bioinformatics. 10(5):246–253. doi:10.1016/j.gpb.2012.07.005.
- Li Z, Wu J, Wei W, Cai X, Yan J, Song J, Wang C, Wang J. 2019. Association of serum miR-186-5p with the prognosis of acute coronary syndrome patients after percutaneous coronary intervention [original research]. Front Physiol. 10:686. doi:10.3389/fphys.2019.00686.
- Ling C, Rönn T. 2016. Epigenetic markers to further understand insulin resistance. Diabetologia. 59(11):2295–2297. doi:10.1007/s00125-016-4109-y.
- Ling H, Fabbri M, Calin GA. 2013. MicroRNAs and other non-coding RNAs as targets for anticancer drug development. Nat Rev Drug Discov. 12(11):847–865. doi:10.1038/nrd4140.
- Mall C, Rocke DM, Durbin-Johnson B, Weiss RH. 2013. Stability of miRNA in human urine supports its biomarker potential. Biomark Med. 7(4):623–631. doi:10.2217/bmm.13.44.
- Martinez SC, Cras-Méneur C, Bernal-Mizrachi E, Permutt MA. 2006. Glucose regulates foxo1 through insulin receptor signaling in the pancreatic islet β-cell. Diabetes. 55(6):1581–1591. doi:10.2337/db05-0678.
- Masotti A, Preckel T. 2006. Analysis of small RNAs with the Agilent 2100 bioanalyzer. Nat Methods. 3(8):658–658. doi:10.1038/nmeth908.
- Meo SA, Sheikh SA, Sattar K, Akram A, Hassan A, Meo AS, Usmani AM, Qalbani E, Ullah A. 2019. Prevalence of type 2 diabetes mellitus among men in the Middle East: a retrospective study. Am J Mens Health. 13(3):1557988319848577.
- Mirmiran P, Sherafat Kazemzadeh R, Jalali Farahani S, Azizi F. 2010. Childhood obesity in the Middle East: a review. EMHJ-Eastern Mediterranean Health J. 16(9):1009–1017.
- Mori MA, Ludwig RG, Garcia-Martin R, Brandão BB, Kahn CR. 2019. Extracellular miRNAs: from biomarkers to mediators of physiology and disease. Cell Metab. 30(4):656–673. doi:10.1016/j.cmet.2019.07.011.
- Muniyappa R, Lee S, Chen H, Quon MJ. 2008. Current approaches for assessing insulin sensitivity and resistance in vivo: advantages, limitations, and appropriate usage. Am J Physiol Endocrinol Metab. 294(1):E15–E26. doi:10.1152/ajpendo.00645.2007.
- Myatt SS, Wang J, Monteiro LJ, Christian M, Ho K-K, Fusi L, Dina RE, Brosens JJ, Ghaem-Maghami S, Lam EWF. 2010. Definition of microRNAs that repress expression of the tumor suppressor gene FOXO1 in endometrial cancer. Cancer Res. 70(1):367–377.
- Naja F, Nasreddine L, Hwalla N, Moghames P, Shoaib H, Fatfat M, Sibai A, Gali-Muhtasib H. 2012. Association of H. pylori infection with insulin resistance and metabolic syndrome among Lebanese adults. Helicobacter. 17(6):444–451.
- Nigi L, Grieco GE, Ventriglia G, Brusco N, Mancarella F, Formichi C, Dotta F, Sebastiani G. 2018. MicroRNAs as regulators of insulin signaling: Research updates and potential therapeutic perspectives in type 2 diabetes. Int J Mol Sci. 19:12. doi:10.3390/ijms19123705.
- Ortega FJ, Mercader JM, Catalán V, Moreno-Navarrete JM, Pueyo N, Sabater M, Gómez-Ambrosi J, Anglada R, Fernández-Formoso JA, Ricart W, et al. 2013. Targeting the circulating microRNA signature of obesity. Clin Chem. 59(5):781–792. doi:10.1373/clinchem.2012.195776.
- Ortega FJ, Mercader JM, Moreno-Navarrete JM, Rovira O, Guerra E, Esteve E, Xifra G, Martínez C, Ricart W, Rieusset J. 2014. Profiling of circulating microRNAs reveals common microRNAs linked to type 2 diabetes that change with insulin sensitization. Diabetes Care. 37(5):1375–1383.
- O-Sullivan I, Zhang W, Wasserman DH, Liew CW, Liu J, Paik J, DePinho RA, Stolz DB, Kahn CR, Schwartz MW, Unterman TG. 2015. Foxo1 integrates direct and indirect effects of insulin on hepatic glucose production and glucose utilization. Nat Commun. 6(1):7079. doi:10.1038/ncomms8079.
- Othman N, Nagoor NH. 2014. The role of microRNAs in the regulation of apoptosis in lung Cancer and Its application in Cancer treatment. BioMed Res Int. 2014:318030. doi:10.1155/2014/318030.
- Qu H-Q, Li Q, Rentfro AR, Fisher-Hoch SP, McCormick JB. 2011. The definition of insulin resistance using HOMA-IR for Americans of Mexican descent using machine learning. PloS one. 6(6):e21041.
- Roser AE, Caldi Gomes L, Schünemann J, Maass F, Lingor P. 2018. Circulating miRNAs as diagnostic biomarkers for Parkinson’s disease [mini review]. Front Neurosci. 12:625. doi:10.3389/fnins.2018.00625.
- Rottiers V, Näär AM. 2012. MicroRNAs in metabolism and metabolic disorders. Nat Rev Mol Cell Biol. 13(4):239–250. doi:10.1038/nrm3313.
- Schickel R, Boyerinas B, Park SM, Peter ME. 2008. MicroRNAs: key players in the immune system, differentiation, tumorigenesis and cell death. Oncogene. 27(45):5959–5974. doi:10.1038/onc.2008.274.
- Shaath H, Toor SM, Nair VS, Elkord E, Alajez NM. 2019. Transcriptomic analyses revealed systemic alterations in gene expression in circulation and tumor microenvironment of colorectal cancer patients. CancerS (Basel. 11:12. doi:10.3390/cancers11121994.
- Shanik MH, Xu Y, Skrha J, Dankner R, Zick Y, Roth J. 2008. Insulin resistance and hyperinsulinemia: is hyperinsulinemia the cart or the horse? Diabetes Care. 31(Suppl 2):S262–S268. doi:10.2337/dc08-s264.
- Taheri M, Eghtedarian R, Ghafouri-Fard S, Omrani MD. 2020. Non-coding RNAs and type 2 diabetes mellitus. Arch Physiol Biochem. 1–10. doi:10.1080/13813455.2020.1843498.
- Tam CS, Xie W, Johnson WD, Cefalu WT, Redman LM, Ravussin E. 2012. Defining insulin resistance from hyperinsulinemic-euglycemic clamps. Diabetes Care. 35(7):1605–1610. doi:10.2337/dc11-2339.
- Taylor R. 2012. Insulin resistance and type 2 diabetes. Diabetes. 61(4):778. doi:10.2337/db12-0073.
- Tuck MK, Chan DW, Chia D, Godwin AK, Grizzle WE, Krueger KE, Rom W, Sanda M, Sorbara L, Stass S, et al. 2009. Standard operating procedures for serum and plasma collection: early detection research network consensus statement standard operating procedure integration working group. J Proteome Res. 8(1):113–117. doi:10.1021/pr800545q.
- Tüfekci KU, Meuwissen RL, Genç S. 2014. The role of microRNAs in biological processes. Methods Mol Biol. 1107:15–31. doi:10.1007/978-1-62703-748-8_2.
- Uwaifo GI, Parikh SJ, Keil M, Elberg J, Chin J, Yanovski JA. 2002. Comparison of insulin sensitivity, clearance, and secretion estimates using euglycemic and hyperglycemic clamps in children. J Clin Endocrinol Metab. 87(6):2899–2905. doi:10.1210/jcem.87.6.8578.
- Wahid F, Shehzad A, Khan T, Kim YY. 2010. MicroRNAs: synthesis, mechanism, function, and recent clinical trials. Biochim Biophys Acta Mol Cell Res. 1803(11):1231–1243. doi:10.1016/j.bbamcr.2010.06.013.
- Wang H, Peng R, Wang J, Qin Z, Xue L. 2018a. Circulating microRNAs as potential cancer biomarkers: the advantage and disadvantage. Clin Epigenetics. 10:59. doi:10.1186/s13148-018-0492-1.
- Wang R, Bao H, Zhang S, Li R, Chen L, Zhu Y. 2018b. miR-186-5p promotes apoptosis by Targeting IGF-1 in SH-SY5Y OGD/R model. Int J Biol Sci. 14(13):1791–1799. doi:10.7150/ijbs.25352.
- Wang R, Hong J, Cao Y, Shi J, Gu W, Ning G, Zhang Y, Wang W. 2015. Elevated circulating microRNA-122 is associated with obesity and insulin resistance in young adults. Eur J Endocrinol. 172(3):291–300. doi:10.1530/eje-14-0867.
- Wang RH, Kim HS, Xiao C, Xu X, Gavrilova O, Deng CX. 2011. Hepatic Sirt1 deficiency in mice impairs mTorc2/Akt signaling and results in hyperglycemia, oxidative damage, and insulin resistance. J Clin Invest. 121(11):4477–4490. doi:10.1172/jci46243.
- Wang Z, Sha HH, Li HJ. 2019. Functions and mechanisms of miR-186 in human cancer. Biomed Pharmacother. 119:109428. doi:10.1016/j.biopha.2019.109428.
- Weber JA, Baxter DH, Zhang S, Huang DY, Huang KH, Lee MJ, Galas DJ, Wang K. 2010. The microRNA spectrum in 12 body fluids. Clin Chem. 56(11):1733–1741. doi:10.1373/clinchem.2010.147405.
- Willeit P, Skroblin P, Moschen AR, Yin X, Kaudewitz D, Zampetaki A, Barwari T, Whitehead M, Ramírez CM, Goedeke L. 2017. Circulating microRNA-122 is associated with the risk of new-onset metabolic syndrome and type 2 diabetes. Diabetes. 66(2):347–357.
- Wu H, Ballantyne CM. 2020. Metabolic Inflammation and insulin resistance in obesity. Circ Res. 126(11):1549–1564. doi:10.1161/CIRCRESAHA.119.315896.
- Wu S, Han M, Zhang C. 2019. Overexpression of microRNA-186 inhibits angiogenesis in retinoblastoma via the hedgehog signaling pathway by targeting ATAD2. J Cell Physiol. 234(10):19059–19072.
- Yamada H, Suzuki K, Ichino N, Ando Y, Sawada A, Osakabe K, Sugimoto K, Ohashi K, Teradaira R, Inoue T. 2013. Associations between circulating microRNAs (miR-21, miR-34a, miR-122 and miR-451) and non-alcoholic fatty liver. Clin Chim Acta. 424:99–103.
- Yan LN, Zhang X, Xu F, Fan YY, Ge B, Guo H, Li ZL. 2020. Four-microRNA signature for detection of type 2 diabetes. World J Clin Cases. 8(10):1923–1931. doi:10.12998/wjcc.v8.i10.1923.
- Yaribeygi H, Katsiki N, Behnam B, Iranpanah H, Sahebkar A. 2018. MicroRNAs and type 2 diabetes mellitus: molecular mechanisms and the effect of antidiabetic drug treatment. Metabolism. 87:48–55. doi:10.1016/j.metabol.2018.07.001.
- Ye J. 2013. Mechanisms of insulin resistance in obesity. Front Med. 7(1):14–24. doi:10.1007/s11684-013-0262-6.
- Zhang Y, Xu L, Liu X, Wang Y. 2018. Evaluation of insulin sensitivity by hyperinsulinemic-euglycemic clamps using stable isotope-labeled glucose. Cell Discov. 4(1):17. doi:10.1038/s41421-018-0016-3.