
 ?Mathematical formulae have been encoded as MathML and are displayed in this HTML version using MathJax in order to improve their display. Uncheck the box to turn MathJax off. This feature requires Javascript. Click on a formula to zoom.
Abstract
We aimed to determine the role of thyroid-stimulating hormone (TSH) of postmenopausal type 2 diabetes mellitus (T2DM) women with normal thyroid function in identifying ultrasound-diagnosed nonalcoholic fatty liver disease (NAFLD). The association between ultrasound-diagnosed NAFLD and biochemical parameters of 376 patients was analyzed among overall patients and in different age groups (≤60 years; 60–70 years; >70 years). The receiver operating characteristic curve (ROC) was used to analyze the diagnostic ability of TSH for ultrasound-diagnosed NAFLD. The prevalence of ultrasound-diagnosed NAFLD in postmenopausal T2DM women was 44.1%. Multivariate logistic regression analysis showed that the levels of BMI (OR = 0.843, 95%CI: 0.779–0.913), HbA1c (OR = 0.836, 95%CI: 0.738–0.946), TG (OR = 0.539, 95%CI: 0.408–0.712), ALT (OR = 0.979, 95%CI: 0.962–0.995) were independent risk factors of NAFLD. BMI and TG were related to the NFALD risk of patients in the three age groups. HOMA-IR and HbA1c were independent risk factors of NAFLD among patients aged ≤60 years and 60–70 years, respectively. The TSH with the best diagnostic ability was among ≤60 years old patients (sensitivity = 0.486; specificity = 0.730). Higher BMI, abnormal glucose and lipid metabolism had a higher risk for developing NFALD, and TSH diagnosis is more meaningful in relatively young patients.
Highlights
BMI, HbA1c, TG, and ALT were independent risk factors of NAFLD.
BMI, TG, and HOMA-IR were related to NFALD risk among patients aged ≤60.
BMI, TG, and HbA1c were related to NFALD risk among patients aged 60–70.
The TSH with the best diagnostic ability was among patients aged ≤60 years.
Introduction
Non-alcoholic fatty liver disease (NAFLD) included various conditions, such as nonalcoholic steatohepatitis and cirrhosis, and the estimated incidences of NAFLD in recent years keep increasing (Farthing et al. Citation2020). NAFLD was recognized as the most common liver illness, with the occurrence of 30% in the US and Europe and 25% in Asia (De Roza and Goh Citation2019). Traditionally, T2DM was the main factor of NAFLD, and the incidence of NAFLD among T2DM patients was over 70% (Tuong et al. Citation2020). Furthermore, a higher risk of death was usually found among T2DM patients than non-diabetic individuals (Yang et al. Citation2020). Therefore, it is important to screen risk factors of NAFLD among T2DM patients.
Previous evidence showed that NAFLD was more prevalent among postmenopausal women than premenopausal women (Setroame et al. Citation2020). Tada et al. also demonstrated that in middle-aged NAFLD patients, progression to advanced fibrosis usually occurred among T2DM individuals (Citation2019). The association between clinical and biochemical parameters of T2DM and NAFLD incidence has been widely researched. For example, the potential ability of ALT has been identified to predict NAFLD among T2DM with an AUC of 0.701 (Al Humayed et al. Citation2020). Prominent effects of thyroid hormones on hepatic fatty acid metabolism have been previously focused on, which was recommended as the treatment target for NAFLD (Sinha et al. Citation2018). Thyroid-stimulating hormone (TSH), as the key regulator of thyroid function, is accepted as one of the most sensitive indicators of thyroid function (Hattori et al. Citation2015). The level of TSH was demonstrated as an essential factor for assessing the condition of patients and an independent risk factor of NAFLD (Tahara et al. Citation2020). Notably, previous evidence also put forward that the significance of TSH on the diagnosis of NAFLD among asymptomatic individuals only occurred when the levels of TSH were high (Tahara et al. Citation2020). Age is a confounding factor for developing NAFLD, and it seems that these relationships remained in conflict in different age groups (Mcpherson et al. Citation2017). Meanwhile, the role of clinical and biochemical parameters of patients in NAFLD development remained unknown.
Liver biopsy is the widely accepted ‘gold standard’ for identifying NAFLD. However, it is invasive and might lead to life-threatening complications and is hard to be accepted by patients (Castera et al. Citation2019). Due to its convenience and low cost, ultrasound is regarded as the first-line examination to detect steatosis and has been widely used for diagnosing NAFLD in clinical practice (Zhang et al. Citation2019; Soleimani et al. Citation2020). In this study, we aimed to explore the role of clinical and biochemical parameters of postmenopausal T2DM women with normal thyroid function in identifying ultrasound-diagnosed NAFLD in different age groups and determine the diagnosis role of TSH. Overall, we enrolled 376 postmenopausal T2DM women with normal thyroid function. The association between ultrasound-diagnosed NAFLD and clinical and biochemical parameters of postmenopausal T2DM patients with normal thyroid function in different age groups was analyzed. Our data showed higher BMI, abnormal sugar and lipid metabolism had a higher risk for developing NFALD among postmenopausal T2DM women, and TSH diagnosis was more meaningful in relatively young postmenopausal T2DM patients.
Subjects and methods
Study population
This study was reviewed and approved by the Medical Research Ethics Committee of the Second Affiliated Hospital of Anhui Medical University (No.YX2020-011), and all included subjects provided informed consent. The female T2DM patients hospitalized from January 2016 to February 2019 in the Endocrinology Department of the Second Affiliated Hospital of Anhui Medical University (Hefei, Anhui, China) were enrolled in the present study. They were inquired of their menstrual history and their willingness to participate in this study.
Inclusion and exclusion criteria
The patients who meet the following inclusion criteria were enrolled in this study: (1) the subjects were T2DM patients; (2) the subjects were postmenopausal women aged between 46 and 85 years; (3) the subjects had normal thyroid function. Exclusion criteria were listed as follows: (1) the subjects had severe acute complications of diabetes; (2) the subjects were long-term heavy drinkers (≥ 70 g/w); (3) the subjects had drug-induced liver disease, viral hepatitis, autoimmune liver disease; (4) the subjects had thyroid dysfunction previously; (5) the subjects had taken antithyroid drugs, glucocorticoids and other drugs previously; 6) thyroid dysfunction was first diagnosed during hospitalization (including those with subclinical thyroid dysfunction); (7) the subjects had severe liver and kidney function abnormalities and severe systemic diseases.
Diagnosis criteria
T2DM was diagnosed according to the recommendations of the American Diabetes Association (ADA) in 2010 (American Diabetes Citation2010). The reference range of normal thyroid function was as follows: T3 ranged from 1.30 to 3.10 nmol/l, T4 ranged from 66.0 to 181.0 nmol/l, and TSH ranged from 0.27 to 4.20 mIU/L.
Doppler ultrasound
All patients underwent abdominal color Doppler ultrasound (Aplio 500, Toshiba Medical System Corporation, Tochigi, Japan) examination without monitoring hemodynamics. NAFLD was diagnosed based on the following manifestations: diffusely enhanced liver echotexture compared with kidney (a bright liver); deep attenuation of the liver and blurring blood vessels after excluding other causes of chronic liver disease, such as significant alcohol consumption (> 210 g/week in men and > 140 g/week in women), hepatitis B virus infection, hepatitis C infection, autoimmune hepatitis, inflammatory bowel disease, etc. (Fan et al. Citation2019). Patients were divided into the NAFLD group and the non-NAFLD group. Based on age distribution, all included subjects were divided into three subgroups: ≤ 60 years old group, 60–70 years old group, and > 70 years old group.
The clinical and biochemical parameters
The clinical characteristics, including age, height, weight, diastolic blood pressure (DBP), the history of T2DM, and systolic blood pressure (SBP) were all recorded on admission. Body mass index (BMI) was calculated as follows: BMI = weight (kg)/height2 (m2).
All subjects fasted for 12 h, and the blood was drawn from fasting veins in the morning of the next day. The factors, including fasting blood glucose (FBG), aspartate aminotransferase (AST), alanine aminotransferase (ALT), alkaline phosphatase (ALP), triacylglycerol (TG), glutamyl transpeptidase (GGT), total cholesterol (TCH), low-density lipoprotein cholesterol (LDL-C), high-density lipoprotein cholesterol (HDL-C), creatinine (Cr), uric acid (UA), blood calcium, blood phosphorus, and intravenous blood sampling 2 h after a meal to detect blood glucose after a meal (2 hBG), were all detected using Beckman automatic biochemical analyzer AU5831 (Beckman-Coulter, AU5831, USA). Glycosylated hemoglobin (HbA1c) was detected using ARKray Glycohemoglobin Analyzer HA-8180 (Arkray, HA-8180, Japan).
Fasting C-peptide (FCP) and thyroid function indicators, including total triiodothyronine (TT3), total thyroxine (TT4), and TSH, were detected using Roche electrochemiluminescence analyzer E601 (Roche, E601, Switzerland). Random urine was collected, and the urine albumin/creatinine (UACR) was determined using siemens-specific protein analyzer BN-II (Siemens, BN-II, Germany).
The glomerular filtration rate (eGFR) for females was estimated using the modified and simplified MDRD formula in China: eGFR = 175 × (SCr) − 1.234 × (age) − 0.179 × 0.79. Since most included subjects have received insulin therapy, FCP (instead of insulin-modified HOMA formula) was used to evaluate insulin resistance. C-peptide (CP) is substituted for insulin resistance (IR) index of the insulin-modified homeostasis model: HOMA-IR (CP) = 1.5 + FBG (mmol/L) × FCP (pmol/L)/2800.
Statistical analysis
The sample size was calculated by PASS. The incidence of NAFLD in T2DM was around 30% in our early study (unpublished). Based on α = 0.05 (two-sided) and power = 0.95 (β = 0.05), a confidence interval width of 0.10, the estimated sample size was 341. Considering the dropout, the sample size was set at 376. The difference and association of data were all calculated using SPSS25.0. If the measurement data followed the normal distribution, the data would be expressed as . The independent-sample t test would be used to compare the difference between groups, and the comparison of the group means over time or after intervention was calculated by paired t-test. If the measurement data did not normally distribute, the data would be shown as M (P25 -P75). Then, the Wilcoxon rank-sum test would be used to assess the difference between groups. The count data were shown by n (%). The chi-square (χ2) test or Fisher's exact test would be used to compare groups. Multivariate analysis was performed by the two-class logistic regression analysis. The diagnostic ability of each index was calculated by the receiver operating characteristic curve (ROC). The threshold for statistical significance was set as P < 0.05.
Results
Comparison of clinical and biochemical indicators between groups
A total of 376 T2DM patients were enrolled in this study. Of them, 166 cases (44.1%) were diagnosed as NAFLD and 210 cases (55.9%) were non-NAFLD. Subgroup analysis identified 163 cases in the ≤60-year-old group, of which 74 were NAFLD (45.4%) and 89 were non-NAFLD. A total of 143 cases were in the 60–70-year-old group, of which 61 were NAFLD (42.7%) and 82 were non-NAFLD. A total of 70 cases were in the 70-year-old group, including 31 NAFLD (44.3%) and 39 cases non-NAFLD.
Compared with the non-NFALD group, significantly higher levels of TSH, BMI, SBP, FBG, HbA1c, TG, TCH, LDL, UA, ALT, AST, GGT, ALP, and HOMA-IR were observed in the NFALD group. Notably, a significantly lower HDL level was observed in the NFALD group compared with the non-NFALD group (Table ).
Table 1. General information comparison between the two groups in the general population.
Logistic regression analysis of NAFLD and clinical factors
Binary logistic regression analysis showed the factors, including TSH, BMI, SBP, FBG, HbA1c, TG, TCH, LDL, HDL-C, UA, ALT, GGT, ALP, and HOMA-IR that were significantly relate to NAFLD. Then, the results of multivariate logistic regression showed that the levels of BMI (OR = 0.843, 95%CI: 0.779–0.913), HbA1c (OR = 0.836, 95%CI: 0.738–0.946), TG (OR = 0.539, 95%CI: 0.408–0.712), ALT (OR = 0.979, 95%CI: 0.962–0.995) were independently related to the risk of NAFLD (Table ).
Table 2. Multivariate logistic regression analysis of the total population.
Subgroup analysis stratified by age
To further explore whether age affects the role of clinical and biochemical indicators in NAFLD risk among postmenopausal T2DM women, all study subjects were divided into three subgroups: ≤ 60 years old, 60–70 years old, and > 70 years old.
Comparison of clinical and biochemical indicators between groups divided by age
In the ≤ 60-year-old subgroup, the subjects with NFALD had significantly higher levels of TSH, BMI, TG, TCH, LDL, UA, ALT, GGT, ALP, HOMA-IR, while HDL-C in the NFALD group showed significantly lower level in the non-NAFLD group (all P < 0.05). In the 60–70-year-old subgroup, higher levels of BMI, HbA1c, TG, GGT, and ALP were observed in patients in NFALD than the non-NFALD group, while HDL-C was lower than that in the non-NAFLD group (all P < 0.05). In the > 70-year-old subgroup, BMI, HbA1c, TG, and ALT in the NFALD group were significantly higher than those in the non-NFALD group (all P < 0.05, Table ).
Table 3. General information comparison between different age subgroups.
Logistic regression analysis of NAFLD and clinical factors divided by age
The logistic regression analysis of NAFLD and clinical factors divided by age are shown in Table . Among ≤ 60-year-old patients, binary logistic regression analysis showed the factors, including TSH, BMI, FBG, TG, TCH, LDL, HDL, ALT, GGT, ALP, and HOMA-IR that were significantly related to NFALD (all P < 0.05). Then, the association between these factors and NFALD was further analyzed by multivariate logistic regression analysis, and the results showed that the levels of BMI (OR = 0.807, 95%CI:0.703–0.926), TG (OR = 0.456, 95%CI:0.281–0.738), and HOMA-IR (OR = 0.687, 95%CI:0.531–0.887) were all related to NFALD risk.
Table 4. Multivariate logistics regression analysis between different age subgroups.
Among patients aged 60–70 years, a significant difference between the NFALD group and the non-NFALD group was found on BMI, HbA1c, TG, HDL, GGT, and ALP by binary logistic regression analysis (all P < 0.05). Further multivariate logistic regression analysis showed that the factors, such as BMI (OR = 0.851, 95%CI:0.762–0.951), HbA1c (OR = 0.777, 95%CI:0.641–0.943), and TG (OR = 0.715, 95%CI:0.497–1.03), were significantly related to the risk of NFALD.
Among patients aged >70 years, the levels of BMI, HbA1c, and TG in the NFALD group were significantly different from that in the non-NFALD group (all P < 0.05). Further multivariate logistic regression analysis showed that the factors BMI (OR = 0.786, 95%CI:0.628–0.983), TG (OR = 0.295, 95%CI:0.118–0.74) were significantly related to the risk of NFALD (Table ).
Diagnostic ability of TSH for NFALD assessed by ROC
The area under the curve (AUC) values of TSH for diagnosing NFALD among postmenopausal T2DM women with normal thyroid function aged ≤ 60 years old, 60–70 years old, > 70 years old were 0.602 (95% CI: 0.515–0.689), 0.545 (95% CI: 0.449–0.642), 0.525 (95% CI: 0.385–0.665), 0.564(95% CI: 0.506–0.623), respectively. The TSH with the best diagnostic ability was among ≤60 years old (sensitivity = 0.486; specificity = 0.730), followed by total population (sensitivity = 0.500; specificity = 0.667, Table ). The ROC is shown in Figure .
Figure 1. Receiver operating characteristic curve for evaluating the predictive of thyroid-stimulating hormone among postmenopausal type 2 diabetes mellitus women with normal thyroid function. A: all included subjects; B: subjects aged ≤ 60 years old; C: subjects aged 60–70 years; D: subjects aged >70 years.
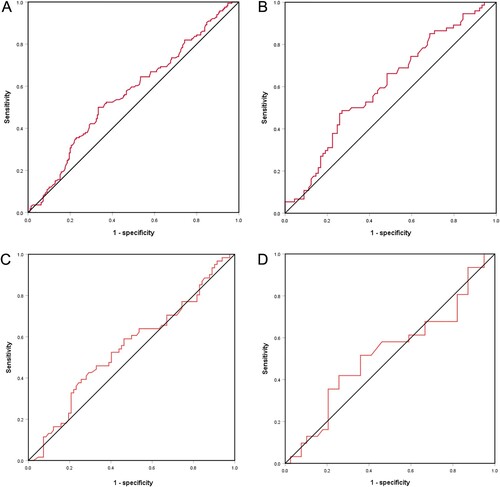
Table 5. Receiver operating characteristics for Thyroid-stimulating hormone diagnosis of NAFLD among postmenopausal T2DM patients.
Discussion
T2DM and NAFLD are the most common public health problem worldwide, and the high prevalence of NAFLD among patients with T2DM promoted us to explore the relationship involved in the two kinds of diseases, especially among postmenopausal women (Zhang et al. Citation2020). Our study showed significantly higher levels of TSH, BMI, SBP, HbA1c, TG, TCH, LDL, UA, ALT, AST, GGT, ALP, HOMA-IR, and significantly lower HDL levels in the NFALD group compared with the non-NFALD group. In line with our data, Ma et al. reported among the elderly Chinese population, the serum HbA1c level was positively related to the prevalence of NAFLD (Ma et al. Citation2013). Similarly, Chen et al. also showed the positive predictive value of elevated levels of HbA1c for the occurrence of NAFLD (Citation2018). It is widely accepted that insulin resistance and the metabolic syndrome are very important in the pathogenesis of NAFLD (Borai et al. Citation2017). Previous data supported the role of various factors in NAFLD, such as BMI (Fierbinteanu-Braticevici et al. Citation2011), ALT (Al Humayed et al. Citation2020). Meanwhile, our data showed that the levels of BMI, HbA1c, TG, ALT were independent risk factors of NAFLD, suggesting the postmenopausal T2DM subjects with the clinical features, such as significant weight gain, elevated blood sugar levels, increased lipid metabolism disorders, and increased insulin resistance had a higher risk of NAFLD.
Furthermore, we assessed the association between NAFLD and clinical and biochemical parameters of postmenopausal T2DM patients with normal thyroid function in different age groups. BMI and TG were related to NAFLD in all three age groups. Notably, HOMA-IR was only related to NAFLD among patients less than 60 years, and HbA1C was only related to NAFLD among patients aged 60–70 years. Previous evidence showed that lipid accumulation was significantly associated with the presence and severity of NAFLD, especially among the younger age group (Dai et al. Citation2017). HOMA-IR and HbA1c are commonly recognized as an index of detecting insulin resistance. The relationship between the occurrence and advanced NAFLD and the levels of HbA1c (Bae et al. Citation2010; Chen et al. Citation2020) and HOMA-IR (Fujii et al. Citation2019) were all demonstrated previously. Notably, among older patients, the relationship between the two factors and the risk of NAFLD should be further researched. Thyroid hormones are accepted as one of the critical regulators associated with metabolism, which could regulate a variety of anabolism or catabolism of macromolecules activities, including proteins, lipids and carbohydrates. High TSH levels were the primary reason for metabolic abnormalities (Maratou et al. Citation2010). Meanwhile, metabolic abnormalities were significantly related to the development of NAFLD. Thus, we further evaluate the predictive role of TSH in NAFLD among postmenopausal T2DM subjects. Previous evidence confirmed that a higher proportion of patients would develop NAFLD than subjects with normal thyroid function (Kim et al. Citation2018). Some of the control points involved in triglyceride and cholesterol levels regulation involved in the liver and serum could be regulated by thyroid hormones and thus participate in the development of NAFLD.
However, in the general population with normal functioning thyroid, the association between TSH levels and NAFLD remains conflict (Tao et al. Citation2015; Gokmen et al. Citation2016). A prospective study by Gu et al. showed low-normal TSH was independently associated with a higher incidence of NAFLD in middle-aged and elderly euthyroid subjects (Gu et al. Citation2022). However, Hu et al. showed that patients with high-normal TSH levels had a greater prevalence of NAFLD (Hu et al. Citation2020). In our study, the subjects were divided into three groups stratified by age, and TSH level had the best diagnostic ability among ≤60 years old. Similar to our study, a previous cross-sectional study showed that middle-aged subjects with NAFLD had significantly higher TSH and free triiodothyronine (FT3) levels, but not elderly subjects (Liu et al. Citation2018). Then, the different age distribution might be one reason for the previous conflict diagnosis role of TSH in NAFLD. Thus, further study with a larger sample size should be designed to verify the present conclusion.
There are some limitations . First, the study was designed as a cross-sectional study. Selection bias or information bias may affect the internal validity of the study. Second, various characteristics related to fatty liver risk, such as smoking status and diabetes, were not considered. Third, due to limited sample size or missing information, we only performed subgroups stratified by age, and the subgroup analysis stratified by other factors could not be performed. Last, the NAFLD is diagnosed by ultrasound. Although it is recommended as the first-line examination for NAFLD, its diagnostic capacity is limited precisely when fatty content is less than 30%.
Conclusion
NAFLD develops among postmenopausal T2DM women with normal thyroid function with a higher BMI, abnormal sugar and lipid metabolism. The correlation between TSH and NAFLD may be closely related to age. TSH is more closely related to NAFLD in relatively young postmenopausal T2DM women, and this correlation gradually weakens with age. However, its relationship and mechanism need to be further confirmed by prospective studies involving different races and populations.
Acknowledgement
The authors thank all staff at the Department of endocrinology, the Second Hospital of Anhui Medical University, for their contributions to this work.
Ethical approval
This study was reviewed and approved by the Medical Research Ethics Committee of the Second Affiliated Hospital of Anhui Medical University (No.YX2020-011), and all included subjects provided informed consent.
Disclosure statement
No potential conflict of interest was reported by the author(s).
Additional information
Funding
References
- Al Humayed SM, Sabaani A, Mahfouz AA, Awadalla NJ, Musa MJ, Patel A. 2020. Clinical and biochemical predictors of nonalcoholic fatty liver disease among Type 2 diabetes mellitus patients at primary health care level in south western Saudi arabia. Diagnostics. 10:809.
- American Diabetes A. 2010. Diagnosis and classification of diabetes mellitus. Diab Care. 33(Suppl 1):S62–S69.
- Bae JC, Cho YK, Lee WY, Seo HI, Rhee EJ, Park SE, Park CY, Oh KW, Sung KC, Kim BI. 2010. Impact of nonalcoholic fatty liver disease on insulin resistance in relation to HbA1c levels in nondiabetic subjects. Am J Gastroenterol. 105:2389–2395.
- Borai IH, Shaker Y, Kamal MM, Ezzat WM, Ashour E, Afify M, Gouda W, Elbrashy MM. 2017. Evaluation of biomarkers in Egyptian patients with different grades of nonalcoholic fatty liver disease. J Clin Transl Hepatol. 5:109–118.
- Castera L, Friedrich-Rust M, Loomba R. 2019. Noninvasive assessment of liver disease in patients With nonalcoholic fatty liver disease. Gastroenterology. 156:1264–1281.e1264.
- Chen C, Zhu Z, Mao Y, Xu Y, Du J, Tang X, Cao H. 2020. Hba1c may contribute to the development of non-alcoholic fatty liver disease even at normal-range levels. Biosci Rep. 40:BSR20193996.
- Chen CX, Du J, Xu YM, Han JX, Zhu ZW, Mao YS, Guo CY. 2018. [Predictive value of serum glycosylated hemoglobin for the onset of nonalcoholic fatty liver disease]. Zhonghua gan Zang Bing za zhi. 26:765–770.
- Dai H, Wang W, Chen R, Chen Z, Lu Y, Yuan H. 2017. Lipid accumulation product is a powerful tool to predict non-alcoholic fatty liver disease in Chinese adults. Nutr Metab (Lond). 14:49.
- De Roza MA, Goh GB. 2019. The increasing clinical burden of NAFLD in Asia. Lancet Gastroenterol Hepatol. 4:333–334.
- Fan JG, Wei L, Zhuang H. 2019. Guidelines of prevention and treatment of nonalcoholic fatty liver disease (2018, China). J Dig Dis. 20:163–173.
- Farthing M, Albonico M, Bisoffi Z, Bundy D, Buonfrate D, Chiodini P, Katelaris P, Kelly P, Savioli L, Mair AL. 2020. World gastroenterology organisation global guidelines: management of strongyloidiasis February 2018-compact version. J Clin Gastroenterol. 54:747–757.
- Fierbinteanu-Braticevici C, Baicus C, Tribus L, Papacocea R. 2011. Predictive factors for nonalcoholic steatohepatitis (NASH) in patients with nonalcoholic fatty liver disease (NAFLD). J Gastrointest Liver Diseases: JGLD. 20:153–159.
- Fujii H, Imajo K, Yoneda M, Nakahara T, Hyogo H, Takahashi H, Hara T, Tanaka S, Sumida Y, Japan Study Group of Nonalcoholic Fatty Liver D, et al. 2019. HOMA-IR: an independent predictor of advanced liver fibrosis in nondiabetic non-alcoholic fatty liver disease. J Gastroenterol Hepatol. 34:1390–1395.
- Gokmen FY, Ahbab S, Ataoglu HE, Turker BC, Cetin F, Turker F, Mamac RY, Yenigun M. 2016. FT3/FT4 ratio predicts non-alcoholic fatty liver disease independent of metabolic parameters in patients with euthyroidism and hypothyroidism. Clinics. 71:221–225.
- Gu Y, Wu X, Zhang Q, Liu L, Meng G, Wu H, Zhang S, Wang Y, Zhang T, Wang X, et al. 2022. High-normal thyroid function predicts incident non-alcoholic fatty liver disease among middle-aged and elderly euthyroid subjects. J Gerontol A Biol Sci Med Sci. 77:197–203.
- Hattori N, Ishihara T, Yamagami K, Shimatsu A. 2015. Macro TSH in patients with subclinical hypothyroidism. Clin Endocrinol (Oxf). 83:923–930.
- Hu DS, Zhu SH, Liu WY, Pan XY, Zhu PW, Li YY, Zheng KI, Ma HL, You J, Targher G, et al. 2020. PNPLA3 polymorphism influences the association between high-normal TSH level and NASH in euthyroid adults with biopsy-proven NAFLD. Diabetes Metab. 46:496–503.
- Kim D, Kim W, Joo SK, Bae JM, Kim JH, Ahmed A. 2018. Subclinical hypothyroidism and Low-normal thyroid function Are associated with nonalcoholic steatohepatitis and fibrosis. Clin Gastroenterol Hepatol: The Off Clin Pract J Am Gastroenterol Assoc. 16:123–131.e121.
- Liu Y, Wang W, Yu X, Qi X. 2018. Thyroid function and risk of non-alcoholic fatty liver disease in euthyroid subjects. Ann Hepatol. 17:779–788.
- Ma H, Xu C, Xu L, Yu C, Miao M, Li Y. 2013. Independent association of HbA1c and nonalcoholic fatty liver disease in an elderly Chinese population. BMC Gastroenterol. 13:3.
- Maratou E, Hadjidakis DJ, Peppa M, Alevizaki M, Tsegka K, Lambadiari V, Mitrou P, Boutati E, Kollias A, Economopoulos T, et al. 2010. Studies of insulin resistance in patients with clinical and subclinical hyperthyroidism. Eur J Endocrinol. 163:625–630.
- Mcpherson S, Hardy T, Dufour JF, Petta S, Romero-Gomez M, Allison M, Oliveira CP, Francque S, Van Gaal L, Schattenberg JM, et al. 2017. Age as a confounding factor for the accurate non-invasive diagnosis of advanced NAFLD fibrosis. Am J Gastroenterol. 112:740–751.
- Setroame AM, Kormla Affrim P, Abaka-Yawson A, Kwadzokpui PK, Eyram Adrah F, Bless H, Mohammed L, Bawah AT, Alidu HW. 2020. Prevalence of metabolic syndrome and nonalcoholic fatty liver disease among premenopausal and postmenopausal women in Ho municipality: a cross-sectional study. BioMed Res Int. 2020:2168381.
- Sinha RA, Singh BK, Yen PM. 2018. Direct effects of thyroid hormones on hepatic lipid metabolism. Nat Rev Endocrinol. 14:259–269.
- Soleimani D, Paknahad Z, Rouhani MH. 2020. Therapeutic effects of garlic on hepatic steatosis in nonalcoholic fatty liver disease patients: a randomized clinical trial. Diabetes Metab Syndr Obes. 13:2389–2397.
- Tada T, Toyoda H, Sone Y, Yasuda S, Miyake N, Kumada T, Tanaka J. 2019. Type 2 diabetes mellitus: a risk factor for progression of liver fibrosis in middle-aged patients with non-alcoholic fatty liver disease. J Gastroenterol Hepatol. 34:2011–2018.
- Tahara K, Akahane T, Namisaki T, Moriya K, Kawaratani H, Kaji K, Takaya H, Sawada Y, Shimozato N, Sato S, et al. 2020. Thyroid-stimulating hormone is an independent risk factor of non-alcoholic fatty liver disease. JGH Open: An Open Access Journal of Gastroenterology and Hepatology. 4:400–404.
- Tao Y, Gu H, Wu J, Sui J. 2015. Thyroid function is associated with non-alcoholic fatty liver disease in euthyroid subjects. Endocr Res. 40:74–78.
- Tuong TTK, Tran DK, Phu PQT, Hong TND, Dinh TC, Chu DT. 2020. Non-alcoholic fatty liver disease in patients with Type 2 diabetes: evaluation of hepatic fibrosis and Steatosis using fibroscan. Diagnostics. 10:159.
- Yang JD, Ahmed F, Mara KC, Addissie BD, Allen AM, Gores GJ, Roberts LR. 2020. Diabetes is associated with increased risk of hepatocellular carcinoma in patients with cirrhosis from nonalcoholic fatty liver disease. Hepatology. 71:907–916.
- Zhang JZ, Cai JJ, Yu Y, She ZG, Li H. 2019. Nonalcoholic fatty liver disease: an update on the diagnosis. Gene Expr. 19:187–198.
- Zhang Y, Shi R, Yu L, Ji L, Li M, Hu F. 2020. Establishment of a risk prediction model for non-alcoholic fatty liver disease in Type 2 diabetes. Diabetes Therapy: Res, Treat Educ Diabetes Relat Disord. 11:2057–2073.