
Abstract
Background: To evaluate the diagnostic effects of urine PCA-M (prostate cancer antigen-methylation) DNA level in patients with PSA from 4 to 20 ng/ml. Methods: We first explored the diagnostic value of PCAM (PRKY and TGIF2LY) based on prostate cancer samples from the TCGA database. Then ninety-five patients with PSA concentration of 4-20 ng/ml were collected as subjects. The level of urinary PCA-M DNA was detected by RT–PCR. The sensitivity and specificity of the diagnosis and the AUC were calculated and compared with f/t PSA, PSAD. Results: Bioinformatics analysis showed that the expression of PRKY in prostate cancer tissues was significantly higher than that in adjacent normal tissues, while the expression of TGIF2LY in normal prostate tissues was significantly higher than that in cancer tissues (P < 0.001). The results of RT–PCR showed that the level of urinary PCA-M protein kinase PRKY in patients diagnosed with PCA (P < 0.0001), while the level of urinary TGIF2LY in patients with PCA was on the contrary. The AUC value of urinary PRKY level was the highest compared with urinary TGIF2LY, f / tPSA and PSAD. Conclusions: PCA-M could be a biomarker for diagnosing patients with PSA from 4 to 20 ng/ml.
Introduction
Prostate cancer is one of the most common malignant tumors in the world, and it ranks first in the incidence of male malignant tumors in Europe and the United States (Siegel et al. Citation2016; Miller et al. Citation2019). In China, the incidence of PCa increases by an average of 4.7% a year, which is the fastest increase in male malignant tumors (Chen et al. Citation2016). Examination of serum prostate-specific antigen (PSA) is widely used as an early diagnostic index of PCa, but it is susceptible to inflammation, DRE, urinary retention and other factors (Cuzick et al. Citation2014; Kitagawa et al. Citation2014). And prostate biopsy positive rate is extremely low in the population of PSA in gray zone (total PSA = 4∼20 ng/ml). Therefore, it is of great significance to explore more sensitive and specific biomarkers of prostate cancer to improve the early diagnosis and screening of PCa.
PCA3 (prostate cancer antigen 3) is an oncogene discovered recently and it is specifically and highly expressed in patients with PCa as a noncoding mRNA (Day et al. Citation2011). However, PCA3 shows low superiority in the diagnosis of PCa in China due to the high cost of the determination and the poor stability of mRNA. Therefore, a new biomarker of DNA expression for PCa is in great need. Yao et al. (Citation2015) has reported that abnormal gene methylation is prevalent in prostate cancer tissues and several methylation-specific urinary biomarkers have been studied for the efficacy of the diagnosis of PCa (Goessl et al. Citation2001; Daniunaite et al. Citation2014). And the most studied gene GSTP1 and RASSF1 were resulted in moderate sensitivity, which were 73% and 84.4%, respectively (Goessl et al. Citation2001; Daniunaite et al. Citation2014). PCA-M (prostate cancer antigen -methylation) evaluates the risk of PCa by analyzing the methylation level of PRKY and TGIF2LY, which are specific DNA methylation sites on the Y-chromosome in prostate cancer (Yao et al. Citation2015). Our research is aimed at studying the application of PCA-M in the early screening of PCa.
Materials and methods
Patients and groups
Database data
The latest transcriptome data of 551 patients with prostate cancer were obtained from the UCSC Xena (https://xena.ucsc.edu/)TCGA database. Ensemble ID was converted into gene ID, and gene expression was extracted from transcriptome data. And Wilcoxon rank sum test was utilized to compare the methylation level of PRKY and TGIF2LY. Since all the data in this study are from the TCGA database, no moral consent is required.
Patient characteristics
A total of ninety-five patients were selected from the First Affiliated Hospital of Soochow University from 1 June 2018 to 30 September 2018. Patients were included due to the inclusion criteria: PSA ranged from 4 to 20 ng/ml, scheduled for prostate biopsy and had not received other any therapy. And patients were excluded if they met the exclusion criteria: with infectious diseases, accompanied by other malignant tumors and HIV positive. Clinical data of age, BMI, PSA, f/t PSA, PSAD, DRE and MRI were collected prior to prostate biopsy. All the patients were divided into two groups according to the pathological results, Group PCa and Group BPH. To note, all the patients participated in the research were signed the informed consent and all experimental protocols were approved by the Institutional Ethics Committee of the First Affiliated Hospital of Soochow University. Also, all methods were carried out in accordance with relevant guidelines and regulations.
Reagents and instruments
TaKaRa Taq™ Hot Start Version (Cat. No. R007A, TARAKA, Japan), PyroMark Q24PyroMark Gold Q24 Reagents (Cat. No. 970802, QIAGEN, Germany), QIAamp DNA Mini Kit (REF: 51306, QIAGEN, Germany), EZ DNA Methylation-Gold™ Kit (Cat. No. D5006, ZYMO Research, US), Pyromark Control Oligo (Cat. No. 979203, QIAGEN, Germany), real-time fluorescent quantitative PCR instrument (ABI, US), high-speed centrifuge (Beckman, US), Infinium Human Methylation 450 BeadChip array (Illumina Inc., US) and Pyrophosphate sequencer (Pyromark Q24, QIAGEN, Germany) were used in this study.
Specimen collection and treatment
A total of 50 ml of urine was collected and placed in a collection tube after DRE (digital rectal exam). And urine sediment was obtained and stored at −20°C after centrifugation.
DNA extraction and data generation
DNA was first extracted from the urine sediment samples using a QIAmp DNA Kit. Then the DNA samples were bisulfate converted through a Zymo EZ DNA Methylation Kit. The fragments were purified with ethanol precipitation and hybridized overnight to the Infinium Human Methylation 450 BeadChip array when the DNA was amplified and enzymatically fragmented. Finally, the BeadChips were imaged using an iScan system (Illumina, US).
Genome sequencing and pyrosequencing
Paired-end reads were produced using the Hiseq2000 system. And the operation was conducted by a PyroMark ID Sequencer according to the manufacturer’s instructions. The primers of the PCA-M genes used in pyrosequencing were: PRKY (5’-TTATATTTAYGTTAGGAAAAAAAAAATTTTT-3’) Forward: 5’-GGAAAGGGGTGATTAAATATTTAGTTA-3’, Reverse: 5’-BIOTIN- CAACCTAATAAAAAACTATACAAACACAT-3’, Sequencing primer: 5’-ATAAGTATGTTTAATTATTGTTTAAG-3’ and TGIF2LY (5’-GTYGATGTAGTAGTATAAAYGGTTGTYGAG-3’) Forward: 5’-GGAATAGTTTAGTTAAAGAAAAAGGTTAAGAT-3’,Reverse: 5’-AATTTACCACAATACACAAAAAACTAACTACTTA-3’, Sequencing primer: 5’-AGATTTTAGTAGTTTTTTGTCGTTA-3’ (Table ).
Table 1. General data of pyrophosphate sequencing.
Data processing
The Illumina Methylation Analyzer package in R language was to calculate the methylation level of each methylated site. The methylation level of each site is represented by its ratio with the mean methylation level of the tested sites.
Statistical analysis
Perl (version 10.0.18362.836) and R software (version 3.6.2) were used for TCGA data processing. All the Experiment data were expressed as mean ± standard deviation. The differences between Group PCa and Group BPH were assessed by the Mann–Whitney U test. And a receiver operating characteristic (ROC) curve was plot and a cutoff value was determined based on the optimal combination of sensitivity and specificity. The sensitivity and specificity of PCa analysis at the corresponding critical value were evaluated, and the area under the ROC curve (AUC) was calculated with Graphpad Prism 7. The statistical power of the test was set at α = 0.05.
Result
Bioinformatics analysis of PRKY and TGIF2LY expression in prostate cancer
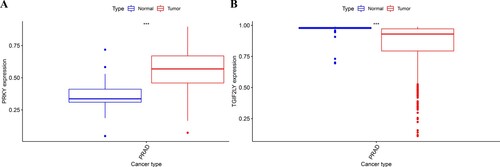
The results showed that there was a significant difference in the expression of, PRKY and TGIF2LY between prostate cancer cells and adjacent tissues (P < 0.001, Figure ). Through the difference analysis, it was found that there was a significant difference in the expression of PRKY between the high expression group and the low expression group. In patients with prostate cancer, the expression of PRKY was high in cancer tissues and low in normal tissues, and the difference was significant (P < 0.001, Figure (A)). On the other hand, the expression of TGIF2LY in prostate cancer tissues was significantly on the contrary, and the expression in cancer tissues was significantly lower than that in normal tissues (P < 0.001, Figure (B)). Differential expression diagrams are generated by the ‘ggpubr’ package.
Figure 1. Bioinformatics analysis of PRKY and TGIF2LY expression in prostate cancer. The expression of PRKY was high in cancer tissues and low in normal tissues, and the difference was statistically significant (P < 0.001, Figure (A)). The expression of TGIF2LY in prostate cancer tissues was significantly lower than that in normal tissues (P < 0.001, Figure (B)).
The level of urinary PCA-M DNA was detected by real-time polymerase chain reaction (RT–PCR)
According to the pathological results, there were forty-nine patients enrolled in the Group PCa and forty-six patients involved in the Group BPH. The characteristics of the two cohort were shown in Table . No significant difference was found in age ((68.50 ± 7.79)y vs. (67.29 ± 6.46)y, P = 0.1173), BMI (23.68 ± 2.69)kg/m2 vs. (23.10 ± 1.94)kg/m2, DRE ((positive: negative = 22:27) vs. (positive: negative = 27:19), P = 0.1787), MRI ((positive: negative = 24:25) vs. (positive: negative = 30:16), P = 0.1103) and TPSA ((9.86 ± 4.90)ng/ml vs. (9.67 ± 4.90)ng/ml, P = 0.9956) between Group PCa and Group BPH. Patients diagnosed with PCa demonstrated a lower value of f/t PSA ((0.12 ± 0.06) vs. (0.17 ± 0.16), P = 0.0185) and a higher value of PSAD ((0.26 ± 0.20) vs. (0.18 ± 0.10), P = 0.0167) in comparison with patients diagnosed with BPH. The methylation levels of gene PRKY ((3.96 ± 1.05) % vs. (2.47 ± 0.77) %, P < 0.0001) were higher in positive biopsies while the methylation levels of gene TGIF2LY ((71.13 ± 13.16) % vs. (91.96 ± 5.56), P < 0.0001) % were lower in PCa patients.
Table 2. The clinical characteristics of the two groups of patients.
Evaluation of diagnostic performance of PRKY and TGIF2LY methylation sites.
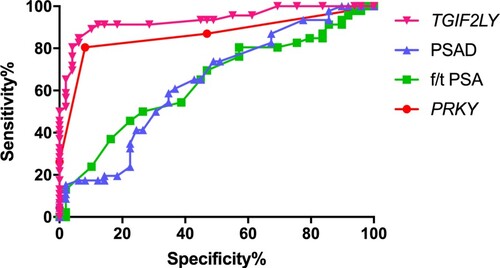
We used the AUC-ROC to evaluate and compare the diagnostic performance of f/t PSA, PSAD, methylation sites of PRKY and TGIF2LY (Figure ). The AUC of PRKY was the highest compared with TGIF2LY, f/t PSA and PSAD (AUC = 0.8636, 0.9352, 0.6395, 0.6417, respectively). When the cutoff value of urine PRKY level was 3.5, the sensitivity and specificity were 89.47% and 88.00%. The sensitivity and specificity of urine TGIF2LY level were 89.47% and 64.00% with the cutoff value of 93.5.
Figure 2. The ROC for urine PCA-M DNA in diagnosis of PCa. The AUC of PRKY, TGIF2LY, f/t PSA, PSAD was 0.8636, 0.9352, 0.6395, 0.6417, respectively.
Discussion
The morbidity and lethality of PCa are high over the world (Jemal et al. Citation2011; Siegel et al. Citation2016). And when PCa accelerated growth or spread to other parts, the disease will be aggravated and the late metastasis rate and mortality rate are higher (Sebesta and Anderson Citation2017). PSA is now widely used to screen individuals at high risk of PCa. However, PSA is easily affected by inflammation, DRE, BPH and other factors (Nguyen-Nielsen and Borre Citation2016; Kretschmer and Tilki Citation2017; Eapen et al. Citation2019). As a result, the specificity of PSA detection is low, especially in the gray area (total PSA = 4∼20 ng/ml). It was reported that the positive rate was only 26% with PSA ranged from 4 to 10 ng/ml and 35% with PSA ranged from 10 to 20 ng/ml (Lin et al. Citation2015; Zhu et al. Citation2015). And a number of patients with elevated PSA levels have experienced an unnecessary prostate biopsy, which carries significant morbidity (Fujita et al. Citation2009). In this case, it is necessary to explore more sensitive and specific biomarkers of PCa.
Substances or cellular contents can be secreted and released by prostate cancer cells or prostatic intraepithelial neoplasia arising from the prostate epithelium (Fujita and Nonomura Citation2018). And urine is a promising source for the development of new biomarkers for PCa. PCA3 is an oncogene discovered recently and researched widely. Previous studies demonstrated that the expression of mRNA of PCA3 was high in PCa while low in BPH and normal individuals (Li et al. Citation2018; Oderda et al. Citation2018). However, PCA3 shows low superiority in the diagnosis of PCa in China due to the high cost of the examination and the poor stability of mRNA. PCA-M is a new biomarker of PCa to detect the alteration of DNA methylation (Yao et al. Citation2015). And two DNA methylation sites of the Y-chromosome were selected (PRKY and TGIF2LY). Yao et al reported that the methylation level of PRKY was obviously higher in PCa and the methylation of TGIF2LY was significantly lower in BPH, which indicated that the methylation level of PRKY and TGIF2LY could considered as a potential diagnostic biomarker (Yao et al. Citation2015).
In this study, bioinformatics was used to analyze the data of 551 patients in the database, and it was found that there was a significant difference in the expression of PCA-M in prostate cancer. PRKY is highly expressed in prostate cancer tissues, while TGIF2LY is highly expressed in normal tissues (Figure ). Therefore, we consider whether the expression of PRKY and TGIF2LY can be used as a predictor for differential diagnosis of prostate cancer and benign prostatic hyperplasia. In order to verify our inference, we conducted a small sample experiment. There were ninety-five patients participated in the study. Forty-nine patients were pathological confirmed PCa and forty-six patients were diagnosed with BPH. It was illustrated that the f/t PSA and PSAD were superior to PSA in diagnosis of PCa because of the obvious difference between Group PCa and Group BPH. Our research certified that the methylation level of PRKY was higher in PCa and the methylation level of TGIF2LY was lower in PCa. ROC-AUC was applicated to compare the diagnostic performance of f/t PSA, PSAD, gene PRKY and gene TGIF2LY. The AUC of gene PRKY and gene TGIF2LY was higher than that of f/t PSA and PSAD, which demonstrated that the methylation level of gene PRKY and gene TGIF2LY was a better index for early screening of PCa. In this study, the ratio of the DNA methylation level of PRKY in PCa was (3.96 ± 1.05) %, which was higher than that in BPH (P < 0.0001). And the ratio of the DNA methylation level of TGIF2LY in PCa was (71.13 ± 13.16) %, which was lower than that in BPH (P < 0.0001). When the cutoff value of urine PRKY level was 3.5, the sensitivity and specificity were 89.47% and 88.00%. The sensitivity and specificity of urine TGIF2LY level were 89.47% and 64.00% with the cutoff value of 93.5.
However, our study was a single-center clinical study and experimental results may be affected by information bias and other factors. In this case, multicenter prospective studies are in great need to provide a sufficient basis for the clinical application of PCA-M as a biomarker in PCa screening.
Conclusion
The methylation level of PRKY was higher in PCa tissues than that in BPH tissues, while the methylation level of TGIF2LY was the opposite. The diagnostic performance of PRKY and TGIF2LY were superior to f/t PSA and PSAD in PSA from 4 to 20 ng/ml. Analyzing the ratio of the DNA methylation level of PCA-M in the urine of patients was a feasible method to screen PCa. However, more researches are in great need to further explore the application of PCA-M clinically.
Author contributions
Research idea and study design: Zhiyu Zhang, Qi Zhou; Data acquisition: Qi Zhou, Zhiyu Zhang, Jun Ouyang, Jiang-lei Zhang; Data analysis/interpretation: Zhiyu Zhang and Qi Zhou; Statistical analysis: Qi Zhou; Supervision or mentorship: Zhiyu Zhang. Zhiyu Zhang takes responsibility that this study has been reported honestly, accurately and transparently, and accepts accountability for the overall work by ensuring that questions pertaining to the accuracy or integrity of any portion of the work are appropriately investigated and resolved.
Ethics approval
The author is responsible for all aspects of the work to ensure that issues related to the accuracy or completeness of any part of the work are properly investigated and resolved. The study is based on the Helsinki Declaration (revised in 2013). The study was approved by the Ethics Committee of the first affiliated Hospital of Suzhou University and obtained the informed consent of all participants.
Disclosure statement
No potential conflict of interest was reported by the author(s).
Data availability statement
All the original data of this study can be accessed from https://figshare.com/s/b2786bd44a844ba9b9c5. Publicly available data was also obtained from the UCSC Xena (https://xena.ucsc.edu/) TCGA database, reference [GDC TCGA Prostate Cancer (PRAD)].
Additional information
Funding
References
- Chen W, Zheng R, Baade PD, Zhang S, Zeng H, Bray F, Jemal A, Yu XQ, He J. 2016. Cancer statistics in China, 2015. CA Cancer J Clin. 66(2):115–132. doi:10.3322/caac.21338. Epub 2016/01/26. PubMed PMID: 26808342.
- Cuzick J, Thorat MA, Andriole G, Brawley OW, Brown PH, Culig Z, Eeles RA, Ford LG, Hamdy FC, Holmberg L, et al. 2014. Prevention and early detection of prostate cancer. Lancet Oncol. 15(11):e484–e492. doi:10.1016/s1470-2045(14)70211-6. Epub 2014/10/05. PubMed PMID: 25281467; PubMed Central PMCID: PMCPMC4203149.
- Daniunaite K, Jarmalaite S, Kalinauskaite N, Petroska D, Laurinavicius A, Lazutka JR, Jankevicius F. 2014. Prognostic value of RASSF1 promoter methylation in prostate cancer. J Urol. 192(6):1849–1855. doi:10.1016/j.juro.2014.06.075. Epub 2014 Jun 26. PMID: 24980613.
- Day JR, Jost M, Reynolds MA, Groskopf J, Rittenhouse H. 2011. PCA3: from basic molecular science to the clinical lab. Cancer Lett. 301(1):1–6. doi:10.1016/j.canlet.2010.10.019. Epub 2010/11/26. PubMed PMID: 21093148.
- Eapen RS, Nzenza TC, Murphy DG, Hofman MS, Cooperberg M, Lawrentschuk N. 2019. PSMA PET applications in the prostate cancer journey: from diagnosis to theranostics. World J Urol. 37(7):1255–1261. doi:10.1007/s00345-018-2524-z. Epub 2018/10/31. PubMed PMID: 30374609.
- Fujita K, Landis P, McNeil BK, Pavlovich CP. 2009. Serial prostate biopsies are associated with an increased risk of erectile dysfunction in men with prostate cancer on active surveillance. J Urol. 182(6):2664–2669. doi:10.1016/j.juro.2009.08.044. Epub 2009/10/20. PubMed PMID: 19836757.
- Fujita K, Nonomura N. 2018. Urinary biomarkers of prostate cancer. Int J Urol. 25(9):770–779. doi:10.1111/iju.13734. Epub 2018/08/22. PubMed PMID: 30129068.
- Goessl C, Müller M, Heicappell R, Krause H, Straub B, Schrader M, Miller K. 2001. DNA-based detection of prostate cancer in urine after prostatic massage. Urology. 58(3):335–338. doi:10.1016/s0090-4295(01)01268-7. PMID: 11549474.
- Jemal A, Bray F, Center MM, Ferlay J, Ward E, Forman D. 2011. Global cancer statistics. CA Cancer J Clin. 61(2):69–90. doi:10.3322/caac.20107. Epub 2011/02/08. PubMed PMID: 21296855.
- Kitagawa Y, Ueno S, Izumi K, Kadono Y, Konaka H, Mizokami A, et al. 2014. Cumulative probability of prostate cancer detection in biopsy according to free/total PSA ratio in men with total PSA levels of 2.1-10.0 ng/ml at population screening. J Cancer Res Clin Oncol. 140(1):53–59. doi:10.1007/s00432-013-1543-9. Epub 2013/10/30. PubMed PMID: 24165867.
- Kretschmer A, Tilki D. 2017. Biomarkers in prostate cancer - current clinical utility and future perspectives. Crit Rev Oncol Hematol. 120:180–193. doi:10.1016/j.critrevonc.2017.11.007. Epub 2017/12/05. PubMed PMID: 29198331.
- Li M, Zhou D, Zhang W, Gao S, Zhou X. 2018. Urine PCA3 mRNA level in diagnostic of prostate cancer. J Cancer Res Ther. 14(4):864–866. doi:10.4103/jcrt.JCRT_734_17. Epub 2018/07/05. PubMed PMID: 29970667.
- Lin YR, Wei XH, Uhlman M, Lin XT, Wu SF, Diao PF, Xie HQ, Xie KJ, Tang P. 2015. PSA density improves the rate of prostate cancer detection in Chinese men with a PSA between 2.5-10.0 ng ml (-1) and 10.1-20.0 ng ml (-1): a multicenter study. Asian J Androl. 17(3):503–507. doi:10.4103/1008-682x.142129. Epub 2014/12/06. PubMed PMID: 25475661; PubMed Central PMCID: PMCPMC4430959.
- Miller KD, Nogueira L, Mariotto AB, Rowland JH, Yabroff KR, Alfano CM, Jemal A, Kramer JL, Siegel RL. 2019. Cancer treatment and survivorship statistics, 2019. CA Cancer J Clin. 69(5):363–385. doi:10.3322/caac.21565. Epub 2019/06/12. PubMed PMID: 31184787.
- Nguyen-Nielsen M, Borre M. 2016. Diagnostic and therapeutic strategies for prostate cancer. Semin Nucl Med. 46(6):484–490. doi:10.1053/j.semnuclmed.2016.07.002. Epub 2016/11/09. PubMed PMID: 27825428.
- Oderda M, Marra G, Albisinni S, Altobelli E, Baco E, Beatrici V, Cantiani A, Carbone A, Ciccariello M, Descotes JL, et al. 2018. Accuracy of elastic fusion biopsy in daily practice: results of a multicenter study of 2115 patients. Int J Urol. 25(12):990–997. doi:10.1111/iju.13796. Epub 2018/09/07. PubMed PMID: 30187529.
- Sebesta EM, Anderson CB. 2017. The surgical management of prostate cancer. Semin Oncol. 44(5):347–357. doi:10.1053/j.seminoncol.2018.01.003. Epub 2018/03/28. PubMed PMID: 29580436.
- Siegel RL, Miller KD, Jemal A. 2016. Cancer statistics, 2016. CA Cancer J Clin. 66(1):7–30. doi:10.3322/caac.21332. Epub 2016/01/09. PubMed PMID: 26742998.
- Yao L, Ren S, Zhang M, Du F, Zhu Y, Yu H, Zhang C, Li X, Yang C, Liu H, et al. 2015. Identification of specific DNA methylation sites on the Y-chromosome as biomarker in prostate cancer. Oncotarget. 6(38):40611–40621. doi:10.18632/oncotarget.6141. Epub 2015/10/21. PubMed PMID: 26485765; PubMed Central PMCID: PMCPMC4747356.
- Zhu Y, Han CT, Zhang GM, Liu F, Ding Q, Xu JF, Vidal AC, Freedland SJ, Ng CF, Ye DW. 2015. Development and external validation of a prostate health index-based nomogram for predicting prostate cancer. Sci Rep. 5:15341. doi:10.1038/srep15341. Epub 2015/10/17. PubMed PMID: 26471350; PubMed Central PMCID: PMCPMC4607975.