
 ?Mathematical formulae have been encoded as MathML and are displayed in this HTML version using MathJax in order to improve their display. Uncheck the box to turn MathJax off. This feature requires Javascript. Click on a formula to zoom.
Abstract
This study aimed to construct a potential prognostic model for the clinical prediction of esophageal squamous cell adenocarcinoma (ESCA), based on intestinal microbiota-related genes. Microbiome, transcriptome, and clinical phenotype data were downloaded from the TCMA, UCSC, and GEO databases. Intestinal microbiota-related prognostic genes were screened using differential- and univariate Cox regression analyses. The ESCA subtypes were explored based on prognostic genes, followed by infiltration analysis of immune cells in the different subtypes. Feature genes were identified using LASSO and multivariate regression analyses, and a prognostic model was established and validated. Univariate and multivariate Cox regression analyses were used to identify independent prognostic factors. The amount of Bacteroidetes and Proteobacteria differed significantly between the tumor and paracancerous samples. A total of 17 intestinal microbiota-related prognostic genes were also screened. We then identified three ESCA subtypes that exhibited significant differences in microbiota distribution and immune cell infiltration. Finally, we identified 10 gene signatures that were significantly associated with the survival status of ESCA patients. Furthermore, patients with no immunotherapy response presented a significantly higher risk score and prognostic risk. We constructed a prognostic model based on 10 characteristic genes related to intestinal microbiota, which could potentially predict the prognosis of ESCA patients.
Introduction
Esophageal squamous cell adenocarcinoma (ESCA) is a major esophageal cancer with a high incidence and mortality rate (Liang et al. Citation2017). It accounts for approximately 90% of the 456,000 yearly esophageal cancer cases (Abnet et al. Citation2018). The outcomes of ESCA are generally poor with five-year survival rates of only 13–18% (Napier et al. Citation2014). Therefore, in-depth scientific investigations of the pathogenesis of ESCA to identify medical interventions are needed (Holmes and Vaughan Citation2007). The human intestinal tract hosts various types of microbiota, especially in the oral cavity and gastrointestinal tract, which varies greatly and is host specific (Hooper et al. Citation2012). Alterations in the microbiota is an important cause of human diseases, such as inflammation and cancer (Di Pilato et al. Citation2016). Integrated intestinal microbiome and metabolome analyses has laid the foundation for revealing the detailed molecular mechanisms of the microbiome in human cancer (Yang et al. Citation2019). Thus, emphasizing the need to investigate the integration of microbiome data into the prevention, diagnosis, and therapy of ESCA is crucial.
The close association between intestinal microbiota and esophageal cancer risk was previously reported (Chen et al. Citation2021). The intestinal microbiota is involved in host physiological processes, including metabolism and immune defense, and the monitoring and intervention of intestinal microbiota may aid esophageal cancer screening and therapy, potentially improving the prognosis (Zhou et al. Citation2021). A previous study indicated that the bacterium, Fusobacterium nucleatum, contributes to the prognosis of esophageal cancer in humans (Yamamura et al. Citation2016). Additionally, obligate anaerobes in the gut are predominant in patients with esophageal tumors (Tanaka et al. Citation2012). Another study also identified characteristic intestinal flora in the stool samples of patients with advanced esophageal cancer (Motoori et al. Citation2017). Alteration of the intestinal microbiota contributes to the development of Barrett's esophagus and ESCA (Lv et al. Citation2019). Notably, certain differentially expressed genes (DEGs) have been linked with the alteration of intestinal microbiota in the progression of cancer (Sui et al. Citation2020). Long et al. demonstrated that the up-regulation of SLC52A3, which is associated with intestinal microbiota, can be used as a prognostic biomarker in esophageal cancer (Long et al. Citation2018). The potential mechanisms of microbiota in the progression of human cancer, through complicated interactions with the tumor microenvironment (TME) and signaling pathways, were previously reported (Qiu et al. Citation2021). A recent study demonstrated that the subtle interaction between microbiota and tumor cells is key to improving the clinical diagnosis and prognosis in human cancers (Sheetal et al. Citation2021). Differences in microbial composition was proven to be an effective clinical diagnostic marker for patients with ESCA (Deng et al. Citation2021). However, comprehensive research on the intestinal microbiota-associated biomarkers in the prognosis of ESCA is lacking.
In this study, the intestinal microbiota-related prognostic genes were identified based on data from the Cancer Microbiome Atlas (TCMA), University of California Santa Cruz (UCSC), and Gene Expression Omnibus (GEO) databases. This was followed by ESCA subtype identification and immune infiltration analysis on different subtypes. Subsequently, a microbiota-related feature gene-based prognostic model was established and the association of the prognostic model with survival prognosis was investigated. We hoped to develop a potential prognostic model based on prognostic feature genes of the intestinal microbiota for the clinical prognosis of ESCA.
Materials and methods
Microarray data and pre-processing
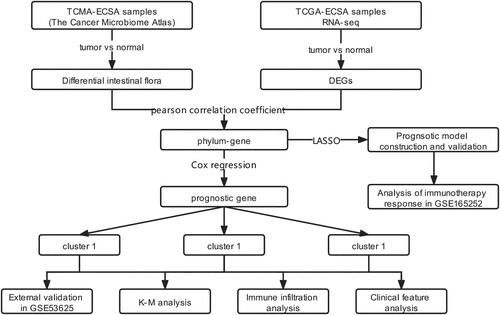
The RNA-seq data of 162 ESCA and 11 paracancerous samples were obtained from the UCSC Xene database (platform: Illumina HiSeq 2000 RNA Sequencing) (Tyner et al. Citation2017). The clinical information of these samples, including age, esophageal tumor location, neoplasm histologic grade, pathologic M, pathologic N, pathologic T, gender, tumor stage, and disease type, were also downloaded. The ESCA sample microbiome data (including 60 tumor and 22 paracancerous samples) were also acquired from the TCMA database (Dohlman et al. Citation2021). Among them, 50 samples were detected in both the Cancer Genome Atlas (TCGA) and TCMA databases. The microarray dataset, GSE53625, was acquired from the GEO database (Edgar et al. Citation2002) to externally validate the prognostic model. This dataset contains 179 ESCA tumor samples with clinical survival and prognostic information. Furthermore, GSE53625, which contains 132 ESCA samples, was used to validate genotyping based on gene clustering. Another immunotherapy dataset, GSE165252, which contains 71 esophageal adenocarcinoma samples (48 non-responders and 23 responders), was used to study the relationship between gene signatures and immunotherapy response. Dataset curation and study workflow are depicted in Figure .
Figure 1. Study flow chart.
Differential analysis of intestinal microbiota and genes
The relative abundance of intestinal microbiota at the phylum and genus levels of ESCA and normal samples was determined using TCMA. The t-test was used to compare the difference in intestinal microbiota abundance between patients with ESCA and normal subjects. The results were visualized using a box plot and the intestinal microbiota (P < 0.05) were considered differential intestinal microbiota involved in tumorigenesis. Moreover, the DEGs between tumor and normal samples were investigated with a false discovery rate of <0.05, and |log2fold change| >1, using the limma package in R software (version: 3.6.1) (Ritchie et al. Citation2015).
Analysis of intestinal microbiota-related DEGs
The Pearson correlation coefficient (PCC) was calculated between differential microbiota and DEGs by the sample correspondence, followed by a significance analysis using the t-test. Subsequently, the Benjamini and Hochberg adjusted P value <0.05, and |PCC| >0.4 were considered as the cut-off values for the selection of microbiota-associated DEGs. Furthermore, the gene ontology (GO)-biological process (BP) and the Kyoto encyclopedia of genes and genomes (KEGG) pathway analyses were performed on intestinal microbiota-related DEGs using the DAVID (version: 6.8) database (Sherman and Lempicki Citation2009). A P < 0.05 was selected as the cut-off value for this enrichment analysis.
Investigation of prognostic DEGs associated with intestinal microbiota
A univariate Cox regression analysis (Wang et al. Citation2016) was performed using R software (version: 3.6.1) based on clinical survival information (overall survival [OS] and OS time) and the expression value of microbiota-associated DEGs to screen the prognostic DEGs related to intestinal microbiota. Statistical significance was set at P < 0.05.
Identification of ESCA subtypes
Based on the expression of the prognostic DEGs related to intestinal microbiota in each tumor sample, the ConsensusClusterPlus package (Zhang et al. Citation2020) in R software (version: 3.6.1) was used for the tumor subgroup investigation. Kaplan-Meier (KM) survival analysis was then carried out using the Survival package (version 2.41-1) to evaluate the survival correlations between different tumor subtypes, followed by statistical analysis and comparison. ESCA subtypes were further verified using an independent validation set, GSE53625, based on candidate gene expression.
TME analysis on different subtypes
Based on the gene expression patterns in ESCA tumor samples, the proportions of six immune cell types (including B cells, CD4+ T cells, CD8+ T cells, neutrophils, macrophages, and myeloid dendritic cells) in each subgroup were calculated using the online database Timer2.0 (Li et al. Citation2017). The Wilcoxon test in R software (version 3.6.1) was used to investigate the proportions of immune cells between different subtypes.
Prognostic model construction
Based on the least absolute shrinkage and selection operator (LASSO) Cox regression analysis in R software (version 3.6.1), the optimal gene set was screened for the presence of intestinal microbiota-related prognostic DEGs in the TCGA training dataset, in which genes were analyzed with 50-fold (nfold = 50 s) cross-validation analysis using the glment package (version: 4.0-2) (Friedman et al. Citation2009). Genes in the optimal gene set were identified as gene signatures. Then, based on their expression and sample prognostic information, multivariate Cox regression analysis was performed to calculate the prognostic coefficient of each gene. Finally, the following prognostic model was constructed:
where Coefgenes refers to the multivariate Cox regression coefficient of the target gene and Expgenes refers to the expression levels of genes in the TCGA training dataset. The KM curve in R software (version 3.6.1) was used to evaluate the relationship between the expression of feature genes and the survival status of samples in the training set.
Prognostic model validation
Internal and external validation of the prognostic model was carried out based on the TCGA training set and the GSE53625 dataset, respectively. The median PS was calculated according to the prognostic coefficient of gene signatures and the samples were divided into high-risk and low-risk groups. The KM curve was used to analyze the survival prognosis of patients in the two groups. Furthermore, the GSE165252 dataset was used to explore the correlation between prognostic risk score and immunotherapy response in patients with esophageal adenocarcinoma. According to the above formula, the risk scores of samples in the GSE165252 dataset were calculated and compared between non-responders and responders, and the statistical significance was set at P < 0.05. Finally, to further observe the relationship between intestinal microbiota and different risk groups, a Sankey diagram was constructed to show the correlations between microbiota, gene signatures, and their prognostic effects.
Independent analysis of the prognostic model
Univariate and multivariate Cox regression analyses in the survival package (version 2.41-1) of R3.6.1 were used to screen independent prognostic factors. The log-rank P < 0.05, was selected as the threshold of significant correlation.
Results
Analyses of differential intestinal microbiota and DEGs between ESCA samples and controls
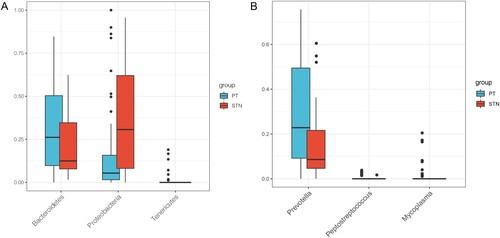
A total of three statistically significant differential intestinal microbiota were found at the phylum and genus levels each (Figure A-B). After eliminating the intestinal microbiota with low abundance, the Bacteroidetes and Proteobacteria with significant differences in abundance at phylum level were enrolled for the subsequent analysis to include more species. The abundance of Bacteroidetes was significantly higher and that of Proteobacteria was significantly lower in cancer tissues than in paracancerous tissues (Figure A). Furthermore, a total of 1438 DEGs, including 1063 upregulated and 375 downregulated genes, were identified between ESCA and paracancerous samples.
Figure 2. Box plot indicating the relative abundance of differential intestinal microbiota. A, relative abundance of differential intestinal microbiota between tumor samples and paracancerous samples at the phylum level. B, relative abundance of differential intestinal microbiota between tumor samples and paracancerous samples at the genus level. X- axis and Y-axis represent the different types of intestinal microbiota and expression levels, respectively. Blue and red bars represent the tumor and paracancerous samples, respectively.
Investigation of intestinal microbiota-related DEGs
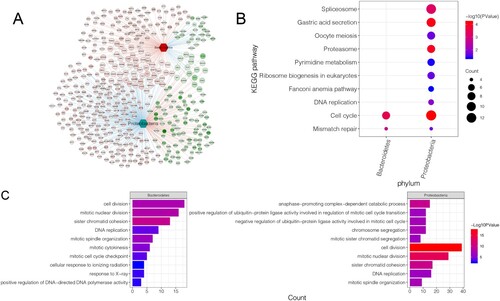
A network of interactions between intestinal microbiota and DEGs was constructed (Figure A), with 522 phylum-gene interactions, 174 Bacteroidetes-associated genes, and 348 Proteobacteria-associated genes. Enrichment analysis was then performed on DEGs associated with Bacteroidetes and Proteobacteria. These DEGs were mainly enriched in pathways including the cell cycle (hsa04110) and mismatch repair (hsa03430) (Figure B). Additionally, these DEGs were mainly assembled in GO functions (Figure C), such as cell division (GO:0051301) and mitotic nuclear division (GO:0007088).
Figure 3. Identification and enrichment analysis of intestinal microbiota-related DEGs: A, interaction network of intestinal microbiota and DEGs. Circles represent DEGs with darker colors indicating more significant P values. The hexagon represents differential intestinal microbiota. The red and blue lines between the two nodes represent positive and negative correlation, respectively. The red node represents up-regulation, while the green node represents down-regulation. B, significantly enriched KEGG pathways. C, assembled GO-BP. Darker colors indicate more significant P values. The larger the node, higher was the number of genes enriched.
Investigation of prognostic genes
The univariate Cox regression analysis was used to screen prognostic genes associated with intestinal microbiota. The results indicated that 17 genes were identified as prognostic genes. Detailed information for all these prognostic genes is shown in Supplementary Figure 1.
Investigation of the ESCA subtypes
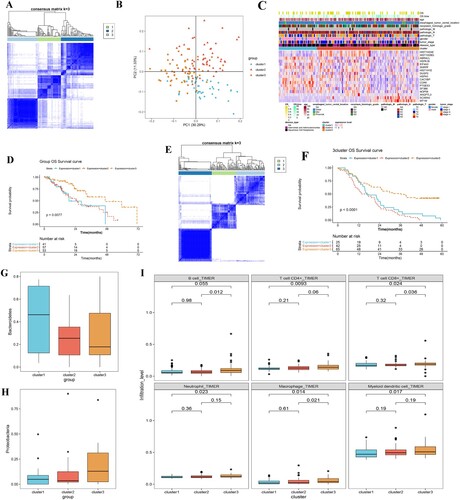
Based on the 17 prognostic genes identified, subtype analysis was performed on 151 tumor samples with prognostic information. The results identified three different subtypes, including cluster 1 (41 tumor samples), cluster 2 (57 tumor samples), and cluster 3 (53 tumor samples) (Figure A). Principal component analysis (PCA) (Figure B) and heatmap (Figure C) showed that all genes could be separated by different subtypes. The correlation analysis of prognosis among subtypes revealed a significant difference in survival status among the three subgroups (P = 0.0077). Cluster 3 had a better clinical survival prognosis, while clusters 2 and 1 had poorer clinical survival prognosis (Figure D). By validating the gene clusters in the GSE53625 dataset, we identified three subtypes (Figure E), of which, cluster 3 had a significantly favorable prognosis compared to clusters 1 and 2 (P < 0.0001, Figure F). Moreover, the distribution analysis of different intestinal microbiota in the three clusters showed that, compared with cluster 3, the relative abundance of Bacteroidetes was higher in clusters 1 and 2, suggesting that Bacteroidetes was a predictor of poor prognosis (Figure G). In addition, compared with clusters 1 and 2, the relative abundance of Proteobacteria was higher in cluster 3, indicating that Proteobacteria was a predictor of a favorable prognosis (Figure H).
Figure 4. Investigation of the three ESCA subtypes. A, consensus heatmap shows the three ESCA subtypes identified, including clusters 1, 2, and 3. B, PCA plot shows the distribution of samples in three subgroups. C, heat map shows the expressions of these 17 prognostic DEGs in different subgroups and stratified by different clinical information. D, the KM curve shows the difference in survival prognosis between different subtypes. X-axis and Y-axis represents survival time (months) and survival probability, respectively. E, genotyping based on gene clustering was validated in an independent validation dataset (GSE53625). F, survival status was compared between three clusters identified from GSE53625, using a KM curve. G, box plot shows Bacteroidetes distribution in the three subtypes. H, box plot shows Proteobacteria distribution in the three subtypes. I, box plots show the differences in the infiltrations of six immune cells between the three clusters.
TME analysis on different subtypes
The infiltration abundance of six types of immune cells in 151 cancer samples was calculated using the timer database. The results showed that, except for B cells, the other five types of immune cells, including CD4+ T cells, CD8+ T cells, neutrophil cells, macrophages, and myeloid dendritic cells, were significantly different between clusters 1 and 3, and their infiltration abundance was higher in cluster 3 than in cluster 1 and cluster 2 (Figure I).
Establishment and validation of the prognostic model
Based on the 17 prognostic genes obtained from the TCGA training set, 10 gene signatures were screened using LASSO Cox regression analysis (Table ). Survival analysis of these 10 genes showed that high expression of ABRACL, ANGPTL3, DUSP2, HIST1H1E, HIST1H2BG, HSPA1B, HSPH1, and PTGES3 was associated with decreased survival, whereas high expression of MT1M and SCARA5 was associated with favorable survival (Figure A). A prognostic model was established based on the regression coefficients and expression values of these 10 genes. Samples were assigned to two different risk groups, based on the median risk score, in which patients in the high-risk group showed adverse survival compared to those in the low-risk group in both the training and validation sets (Figure B-E). By considering the risk score in an immunotherapy dataset, we also found significant higher prognostic risk scores in non-responder patients with ESCA, compared with responders in the GSE165252 dataset (Figure F), indicating that patients without immunotherapy response may present increased prognostic risks. Moreover, heatmap results showed that the expression of these 10 characteristic genes differed significantly between the high- and low-risk groups (Figure A). To observe the relationship between the different risk groups and ESCA subtypes, the distribution proportions of different clusters in the high-risk and low-risk groups were investigated using a bar chart (Figure B). The samples in clusters 1 and 2 were mainly assembled in the high-risk group, which indicated a worse prognosis. Furthermore, the positive correlations between microbiota and feature genes, as well as their prognostic roles in ESCA, were visualized using a Sankey diagram (Figure C). Seven gene signatures were positively correlated with Bacteroidetes, while the protective factors, including MT1M and SCAR5, were positively correlated with Proteobacteria, which further indicated that Bacteroidetes suggested a poor prognosis, while Proteobacteria suggested a favorable prognosis.
Figure 5. Construction and validation of the prognostic model. A, KM survival curves show the relationships between the expression levels of the 10 gene signatures and survival status of ESCA patients. B and D, distributions of the PS in the TCGA training dataset (B) and GSE53625 validation set (D). C and E, KM survival curves show the survival differences between high-risk and low-risk groups in the TCGA training dataset (C) and GSE53625 validation set (E). F, risk scores of samples in the immunotherapy dataset (GSE165252) were calculated and compared between non-responder and responder ESCA patients.
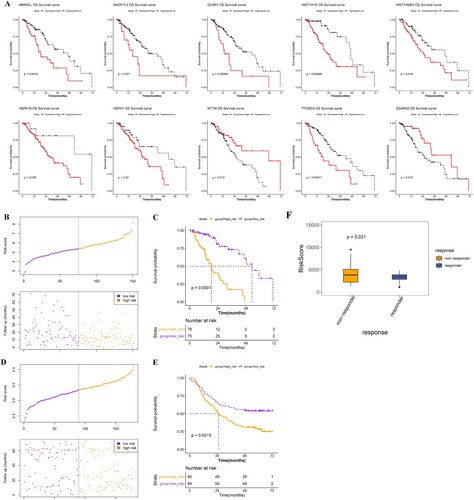
Figure 6. Correlation between gene signatures and the three clusters. A, heatmap shows the expression of the 10 gene signatures in the high- and low-risk groups. B, bar chart shows the distribution of samples of the three subtypes in high- and low-risk groups. C, Sankey diagram shows the relationships between microbiota, gene signature, and their prognostic effects.
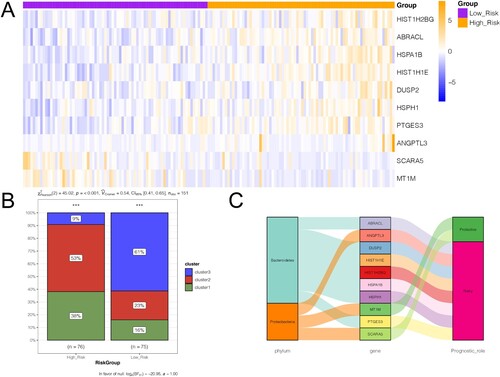
Table 1. Information of the 10-gene-signature.
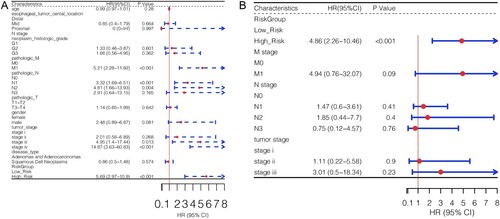
Independent analysis for the prognostic model
Results of the univariate Cox regression analysis on the clinical factors and risk groups showed that pathologic M, pathologic N, tumor stage, and risk group factors were significantly associated with ESCA prognosis (Figure A). Multivariate Cox regression analysis was used to screen for independent prognostic factors. The results showed that the risk group was a unique independent prognostic factor for ESCA (Figure B).
Figure 7. Analysis of independent prognostic factors. Univariate (A) and multivariate (B) Cox regression analyses were used to identify independent prognostic factors according to different clinical characteristics.
Discussion
ESCA is one of the most aggressive squamous cell carcinomas and is highly prevalent in Asia (Ohashi et al. Citation2015). In recent years, tumor immunotherapy research has been extensively carried out in the clinic and the intestinal microbiota has also been found to be related to immune checkpoint inhibitors in the treatment of tumors (Gopalakrishnan et al. Citation2018). However, the exact clinical value of intestinal microbiota in the pathogenesis of ESCA remains unclear. In this study, based on the microbiome data in TCMA, the abundance of Bacteroidetes and Proteobacteria differed significantly between tumor samples and paracancerous tissues. A total of 522 microbiota-associated DEGs were investigated based on the dataset in UCSC Xene. These DEGs were mainly enriched in the mismatch repair pathway. The microbial environments of ESCA tissues are primarily composed of Firmicutes, Bacteroidetes, and Proteobacteria (Shao et al. Citation2019). Recent studies indicated that the intestinal microbiota of Bacteroidetes is related to the occurrence and progression of human cancer (Flemer et al. Citation2017). Moreover, Proteobacteria levels are decreased in ESCA patients with positive lymphatic metastasis (He et al. Citation2020). Liu et al. showed that Bacteroidetes had significantly higher relative abundances among N+ (positive lymph node) esophageal squamous cell carcinoma patients than in N- (negative lymph node) controls, whereas Proteobacteria were less abundant in N+ patients (Liu et al. Citation2018b). However, in the current study, all risk factors were positively correlated with Bacteroidetes, indicating that Bacteroidetes strongly associated with poor prognosis in ESCA. Additionally, changes in the intestinal microbiota are realized through the participation of related genes in specific functions or pathways. Deficiency in mismatch repair is closely associated with tumor progression (Cahill et al. Citation2007). Mismatch repair is commonly targeted with homologues of Dam and MutH, which are related to Proteobacteria (Fishel Citation2021). A genomic analysis of DNA repair genes in the alpha-Proteobacterium indicated that the change of genes in Proteobacterium leads to DNA repair dysfunction (Martins-Pinheiro et al. Citation2007). These results suggest the importance of Bacteroidetes and Proteobacteria in human cancers. Thus, based on the results of this study, we speculated that Bacteroidetes and Proteobacteria might participate in the progression of ESCA via association with the mismatch repair pathway.
A total of 17 prognostic DEGs were identified in the current study, followed by three ESCA subtypes. A poor prognosis was observed in both clusters 1 and 2, with a high abundance of Bacteroidetes. In contrast, a favorable prognosis was observed in cluster 3, with a high abundance of Proteobacteria. Moreover, compared with clusters 1 and 2, the relative infiltration abundance of immune cells, including CD4+ T cells and CD8+ T cells, was higher in cluster 3, possibly explaining the differences among subtypes. Tumor-infiltrating lymphocytes are associated with a survival benefit in several tumor types and in response to immunotherapy (Deschoolmeester et al. Citation2010). Patients with tumor cells with higher CD8+ T cell infiltration tend to have a better prognosis (Schumacher et al. Citation2001). The relationship between high CD8+ T cell abundance and favorable prognosis was explained by Jansen et al.: the immune system established a mechanism of ‘forward operating bases’ in some tumors, and patients with well supported immune cells in tumors were more likely to control the growth of tumor cells over a longer period (Jansen et al. Citation2019). The different recruitment results of CD8+ T lymphocytes into ESCA tissue lead to different survival outcomes in patients with different ESCA subtypes (Liu et al. Citation2015). Notably, Cho et al. indicated that CD4+ and CD8+ T cells strongly correlate with ESCA prognosis (Cho et al. Citation2003). A previous study indicated that CD4+ lymphocytes can be used to predict the survival rate of ESCA patients after clinical surgery (Chen et al. Citation2017). Interestingly, polysaccharide A from the capsule of Bacteroidetes induces clonal CD4+ T cell expansion, indicating a close relationship between CD4+ T cell infiltration and the biological function of intestinal microbiota (Johnson et al. Citation2015). Thus, based on results of the current study, the difference in infiltration abundance of CD4+ and CD8+ T cells might explain the survival difference among the three subtypes. Additionally, Bacteroidetes and Proteobacteria may affect ESCA prognosis by mediating T cell infiltration.
A prognostic model was constructed based on 10 genes, including ABRACL, ANGPTL3, and MT1M. The distribution analysis of the three clusters in the high-risk and low-risk groups showed that samples from clusters 1 and 2 were mainly assembled in the high-risk group, which led to a poor outcome. It has been shown that miR-145-5p functions in the proliferation, migration, and invasion of ESCA cells by stimulating ABRACL (Fan et al. Citation2021). ANGPTL3 is an indicator of prognosis in esophageal cancer patients (Zhu et al. Citation2015; Bao et al. Citation2018; Chen et al. Citation2019). This study found that ESCA patients with high ANGPTL3 expression had a better prognosis. Thus, the overexpression of ANGPTL3 might be an important clinical indicator for favorable ESCA outcomes. In terms of intestinal flora, we found that Proteobacteria may also be a potential biomarker for favorable ESCA prognosis. Although Mennini et al. found an increase in the abundance of Proteobacteria in esophagitis, enterocolitis syndrome, and allergic proctocolitis (Mennini et al. Citation2020), the relationship between Proteobacteria and the prognosis of esophageal cancer has not been confirmed. This study initially found that increased Proteobacteria and ANGPTL3 overexpression may be related to the prognosis of ESCA, but their underlying regulatory mechanisms still require further investigation. Regarding MT1M, Li et al. found that the inhibition of MT1M expression was a negative impression factor for esophageal cancer, further supporting the prognosis value of MT1M in esophageal cancer (Liu et al. Citation2018a; Li et al. Citation2021). All these studies suggest that ABRACL, ANGPTL3, and MT1M are valuable predictors of the prognosis of ESCA. Thus, we speculated that the prognosis model constructed in this study could predict the overall survival of ESCA patients.
However, the current study had some limitations, such as small sample size and lack of experimental analysis to verify the relationship between gene signatures and intestinal microbiota, owing to difficulty in collecting stool and solid tumor tissue samples from ESCA patients. Therefore, we will consider including a larger sample size into the next research plan to study the relationship between gene signatures and intestinal microbiota in improving ESCA prognosis. We will also investigate the molecular regulatory mechanisms through experimentation.
In conclusion, Bacteroidetes and Proteobacteria are not only associated with the prognosis of ESCA, but are also involved in the progression of ESCC via the mismatch repair pathway. Three ESCA subtypes were investigated and the difference in ESCA prognosis might be associated with CD4+ and CD8+ T cells. Furthermore, a prognostic model was constructed based on 10 gene signatures, which could be used to predict the overall survival of ESCA patients.
Supplemental Material
Download TIFF Image (476.4 KB)Acknowledgements
None.
Disclosure statement
No potential conflict of interest was reported by the author(s).
Data availability statement
The data that support the findings of this study are available in UCSC Xene (http://xena.ucsc.edu/), TCMA (https://tcma.pratt.duke.edu/), and NCBI-GEO (https://www.ncbi.nlm.nih.gov/geo/).
References
- Abnet CC, Arnold M, Wei W-Q. 2018. Epidemiology of esophageal squamous cell carcinoma. Gastroenterology. 154:360–373.
- Bao Y, Yang F, Liu B, Zhao T, Xu Z, Xiong Y, Sun S, Qu L, Wang L. 2018. Angiopoietin-like protein 3 blocks nuclear import of FAK and contributes to sorafenib response. Br J Cancer. 119:450–461.
- Cahill DP, Levine KK, Betensky RA, Codd PJ, Romany CA, Reavie LB, Batchelor TT, Futreal PA, Stratton MR, Curry WT. 2007. Loss of the mismatch repair protein MSH6 in human glioblastomas is associated with tumor progression during temozolomide treatment. Clin Cancer Res. 13:2038–2045.
- Chen C, Chen L, Lin L, Jin D, Du Y, Lyu J. 2021. Research progress on gut microbiota in patients with gastric cancer, esophageal cancer, and small intestine cancer. Appl Microbiol Biotechnol. 11:4415–4425.
- Chen K, Zhu Z, Zhang N, Cheng G, Zhang F, Jin J, Wu J, Ying L, Mao W, Su D. 2017. Tumor-infiltrating CD4+ lymphocytes predict a favorable survival in patients with operable esophageal squamous cell carcinoma. Med Sci Monit. 23:4619–4632.
- Chen Y, Quan R, Bhandari A, Chen Z, Guan Y, Xiang J, You J, Teng L. 2019. Low metallothionein 1M (MT1M) is associated with thyroid cancer cell lines progression. Am J Transl Res. 11:1760–1770.
- Cho Y, Miyamoto M, Kato K, Fukunaga A, Shichinohe T, Kawarada Y, Hida Y, Oshikiri T, Kurokawa T, Suzuoki M. 2003. CD4+ and CD8+ T cells cooperate to improve prognosis of patients with esophageal squamous cell carcinoma. Cancer Res. 63:1555–1559.
- Deng Y, Tang D, Hou P, Shen W, Li H, Wang T, Liu R. 2021. Dysbiosis of gut microbiota in patients with esophageal cancer. Microb Pathog. 150:104709.
- Deschoolmeester V, Baay M, Van Marck E, Weyler J, Vermeulen P, Lardon F, Vermorken JB. 2010. Tumor infiltrating lymphocytes: an intriguing player in the survival of colorectal cancer patients. BMC Immunol. 11:1–12.
- Di Pilato V, Freschi G, Ringressi MN, Pallecchi L, Rossolini GM, Bechi P. 2016. The esophageal microbiota in health and disease. Ann N Y Acad Sci. 1381:21–33.
- Dohlman AB, Mendoza DA, Ding S, Gao M, Dressman H, Iliev ID, Lipkin SM, Shen X. 2021. The cancer microbiome atlas: a pan-cancer comparative analysis to distinguish tissue-resident microbiota from contaminants. Cell Host Microbe. 29:281–298. e285.
- Edgar R, Domrachev M, Lash AE. 2002. Gene expression omnibus: NCBI gene expression and hybridization array data repository. Nucleic Acids Res. 30:207–210.
- Fan S, Chen P, Li S. 2021. miR-145-5p overexpression inhibits the proliferation, migration and invasion of esophageal carcinoma cells by targeting ABRACL. Biomed Res Int. 2021:6692544.
- Fishel R. 2021. Mismatch repair: choreographing accurate strand excision. Curr Biol. 31:R293–R296.
- Flemer B, Lynch DB, Brown JM, Jeffery IB, Ryan FJ, Claesson MJ, O’Riordain M, Shanahan F, O’Toole PW. 2017. Tumour-associated and non-tumour-associated microbiota in colorectal cancer. Gut. 66:633–643.
- Friedman J, Hastie T, Tibshirani R. 2009. glmnet: Lasso and elastic-net regularized generalized linear models. R package version.1:1–24.
- Gopalakrishnan V, Helmink BA, Spencer CN, Reuben A, Wargo JA. 2018. The influence of the gut microbiome on cancer, immunity, and cancer immunotherapy. Cancer Cell. 33:570–580.
- He S, Liu X-b, Gao Z-y, Jin S, Pandey S, Gao B, Tong Q. 2020. Characteristics of esophagus flora in patients with esophageal squamous cell carcinoma in central China. Research Square. 6:3973–3985.
- Holmes RS, Vaughan TL. 2007. Epidemiology and pathogenesis of esophageal cancer. Proceedings of the Seminars in radiation oncology; Elsevier.
- Hooper LV, Littman DR, Macpherson AJ. 2012. Interactions between the microbiota and the immune system. Science. 336:1268–1273.
- Jansen CS, Prokhnevska N, Master VA, Sanda MG, Carlisle JW, Bilen MA, Cardenas M, Wilkinson S, Lake R, Sowalsky AG. 2019. An intra-tumoral niche maintains and differentiates stem-like CD8 T cells. Nature. 576:465–470.
- Johnson JL, Jones MB, Cobb BA. 2015. Polysaccharide A from the capsule of bacteroides fragilis induces clonal CD4+ T cell expansion. J Biol Chem. 290:5007–5014.
- Li D, Peng W, Wu B, Liu H, Zhang R, Zhou R, Yao L, Ye L. 2021. Metallothionein MT1M suppresses carcinogenesis of esophageal carcinoma cells through inhibition of the epithelial-mesenchymal transition and the SOD1/PI3 K axis. Mol Cells. 44:267–278.
- Li T, Fan J, Wang B, Traugh N, Chen Q, Liu JS, Li B, Liu XS. 2017. TIMER: a web server for comprehensive analysis of tumor-infiltrating immune cells. Cancer Res. 77:e108–e110.
- Liang H, Fan J-H, Qiao Y-L. 2017. Epidemiology, etiology, and prevention of esophageal squamous cell carcinoma in China. Cancer Biol Med. 14:33–41.
- Liu H, Hu J, Wei R, Zhou L, Pan H, Zhu H, Huang M, Luo J, Xu W. 2018a. SPAG5 promotes hepatocellular carcinoma progression by downregulating SCARA5 through modifying β-catenin degradation. J Exp Clin Cancer Res. 37:1–14.
- Liu J, Li F, Ping Y, Wang L, Chen X, Wang D, Cao L, Zhao S, Li B, Kalinski P. 2015. Local production of the chemokines CCL5 and CXCL10 attracts CD8+ T lymphocytes into esophageal squamous cell carcinoma. Oncotarget. 6:24978.
- Liu Y, Lin Z, Lin Y, Chen Y, Peng X-e, He F, Liu S, Yan S, Huang L, Lu W. 2018b. Streptococcus and prevotella are associated with the prognosis of oesophageal squamous cell carcinoma. J Med Microbiol. 67:1058–1068.
- Long L, Pang X-X, Lei F, Zhang J-S, Wang W, Liao L-D, Xu X-E, He J-Z, Wu J-Y, Wu Z-Y. 2018. SLC52A3 expression is activated by NF-κB p65/Rel-B and serves as a prognostic biomarker in esophageal cancer. Cell Mol Life Sci. 75:2643–2661.
- Lv J, Guo L, Liu J-J, Zhao H-P, Zhang J, Wang J-H. 2019. Alteration of the esophageal microbiota in Barrett’s esophagus and esophageal adenocarcinoma. World J Gastroenterol. 25:2149–2161.
- Martins-Pinheiro M, Marques RC, Menck CF. 2007. Genome analysis of DNA repair genes in the alpha proteobacterium Caulobacter crescentus. BMC Microbiol. 7:1–14.
- Mennini M, Fierro V, Di Nardo G, Pecora V, Fiocchi A. 2020. Microbiota in non-IgE-mediated food allergy. Curr Opin Allergy Clin Immunol. 20:323–328. Epub 2020/04/07.
- Motoori M, Yano M, Miyata H, Sugimura K, Saito T, Omori T, Fujiwara Y, Miyoshi N, Akita H, Gotoh K, et al. 2017. Randomized study of the effect of synbiotics during neoadjuvant chemotherapy on adverse events in esophageal cancer patients. Clin Nutr. 36:93–99. Epub 2015/12/09.
- Napier KJ, Scheerer M, Misra S. 2014. Esophageal cancer: a review of epidemiology, pathogenesis, staging workup and treatment modalities. World J Gastrointest Oncol. 6:112–120.
- Ohashi S, Miyamoto S, Kikuchi O, Goto T, Amanuma Y, Muto M. 2015. Recent advances from basic and clinical studies of esophageal squamous cell carcinoma. Gastroenterology. 149:1700–1715.
- Qiu Q, Lin Y, Ma Y, Li X, Liang J, Chen Z, Liu K, Huang Y, Luo H, Huang R, Luo L. 2021. Exploring the emerging role of the gut microbiota and tumor microenvironment in cancer immunotherapy. Front Immunol. 11:612202.
- Ritchie ME, Phipson B, Wu D, Hu Y, Law CW, Shi W, Smyth GK. 2015. Limma powers differential expression analyses for RNA-sequencing and microarray studies. Nucleic Acids Res. 43:e47–e47.
- Schumacher K, Haensch W, Röefzaad C, Schlag PM. 2001. Prognostic significance of activated CD8+ T cell infiltrations within esophageal carcinomas. Cancer Res. 61:3932–3936.
- Shao D, Vogtmann E, Liu A, Qin J, Chen W, Abnet CC, Wei W. 2019. Microbial characterization of esophageal squamous cell carcinoma and gastric cardia adenocarcinoma from a high-risk region of China. Cancer. 125:3993–4002.
- Sheetal S, Pal S, Chandan G, Saini V, Chakrabarti S, Saini NK, Mittal A, Thakur VK, Saini AK, Saini RV. 2021. Understanding the cross-talk between human microbiota and gastrointestinal cancer for developing potential diagnostic and prognostic biomarkers. Proceedings of the Seminars in Cancer Biology; Elsevier.
- Sherman BT, Lempicki RA. 2009. Systematic and integrative analysis of large gene lists using DAVID bioinformatics resources. Nat Protoc. 4:44–57.
- Sui X, Chen Y, Liu B, Li L, Huang X, Wang M, Wang G, Gao X, Zhang L, Bao X. 2020. The relationship between KRAS gene mutation and intestinal flora in tumor tissues of colorectal cancer patients. Ann Transl Med. 8:1085.
- Tanaka K, Yano M, Motoori M, Kishi K, Miyashiro I, Ohue M, Ohigashi H, Asahara T, Nomoto K, Ishikawa O. 2012. Impact of perioperative administration of synbiotics in patients with esophageal cancer undergoing esophagectomy: a prospective randomized controlled trial. Surgery. 152:832–842. Epub 2012/04/17.
- Tyner C, Barber GP, Casper J, Clawson H, Diekhans M, Eisenhart C, Fischer CM, Gibson D, Gonzalez JN, Guruvadoo L. 2017. The UCSC genome browser database: 2017 update. Nucleic Acids Res. 45:D626–D634.
- Wang P, Wang Y, Hang B, Zou X, Mao J-H. 2016. A novel gene expression-based prognostic scoring system to predict survival in gastric cancer. Oncotarget. 7:55343.
- Yamamura K, Baba Y, Nakagawa S, Mima K, Miyake K, Nakamura K, Sawayama H, Kinoshita K, Ishimoto T, Iwatsuki M. 2016. Human microbiome Fusobacterium nucleatum in esophageal cancer tissue is associated with prognosis. Clin Cancer Res. 22:5574–5581.
- Yang Y, Misra BB, Liang L, Bi D, Weng W, Wu W, Cai S, Qin H, Goel A, Li X. 2019. Integrated microbiome and metabolome analysis reveals a novel interplay between commensal bacteria and metabolites in colorectal cancer. Theranostics. 9:4101–4114.
- Zhang X, Ren L, Yan X, Shan Y, Liu L, Zhou J, Kuang Q, Li M, Long H, Lai W. 2020. Identification of immune-related lncRNAs in periodontitis reveals regulation network of gene-lncRNA-pathway-immunocyte. Int Immunopharmacol. 84:106600.
- Zhou J, Sun S, Luan S, Xiao X, Yang Y, Mao C, Chen L, Zeng X, Zhang Y, Yuan Y. 2021. Gut microbiota for esophageal cancer: role in carcinogenesis and clinical implications. Front Oncol. 11:717242. Epub 2021/11/05.
- Zhu L, Jiang L, Wang W, Jia W, Liu F, Jiao X, Zhu X, Bao J, Yu H. 2015. Angiopoietin-like protein 3 is an indicator of prognosis in esophageal cancer patients. Int J Clin Exp Med. 8:16101–16106.