
Abstract
Long non-coding RNAs (lncRNAs) are actively involved in various carcinomas. The purpose of this experiment is to explore the function of long intergenic non-protein coding RNA 01106 (LINC01106) in non-small cell lung cancer (NSCLC). LINC01106 expression in NSCLC was determined by RT-qPCR. Next, the distribution of LINC01106 in A549 cells was observed using subcellular fractionation. Subsequently, functional assays were performed to access NSCLC cell biological behaviors, with epithelial–mesenchymal transition detected by the western blot analysis. After that xenograft tumors were established in nude mice to analyze the inhibitory role of LINC01106 knockdown in NSCLC. In addition, gain-of-function and loss-of-function assays were carried out to confirm the interaction between LINC01106 and microRNA (miR)-765 and between miR-765 and collagen type III (COL3A1) in NSCLC cells. LINC01106 was overexpressed in NSCLC cells, and it existed in both cytoplasm and nuclei in A549 cells. Then, it was further discovered that LINC01106 knockdown greatly reduced NSCLC cell expansion and tumor growth in vivo. Furthermore, it was identified that LINC01106 could serve as a sponge of miR-765 to promote COL3A1 expression. miR-765 overexpression inhibited A549 cell activities. This study unmasked that LINC01106 knockdown suppressed NSCLC progression by serving as a sponge of miR-765 to downregulate COL3A1 expression.
Introduction
Lung cancer (LC) is the most malignant tumor in the world, of which non-small cell LC (NSCLC) takes up to 85% patients suffering from LC (Chen et al. Citation2014). NSCLC is considered as one of the most crucial reasons of the high mortality rate induced by cancer around the world (Rafei et al. Citation2017; Tandberg et al. Citation2018). The aged ones are the most vulnerable population to NSCLC, and the morbidity and death rates are rapidly growing among people over 65 (Elias et al. Citation2017). Insufficiently dependable screening tools to predict early stage of NSCLC emerges as the considerable quantity of death number of this neoplasm (Goebel et al. Citation2019). According to the state of clinical stages, patient performance and pathological diagnosis, the treatment of NSCLC can be classified as the extensive progress and practical application of targeted therapies and immunotherapies (Skrickova et al. Citation2018 ; Osmani et al. Citation2018). Still and all, the curative and survival rates of individuals with NSCLC had shown slight improvement (Herbst et al. Citation2018). Up to now, biomarkers are increasingly involved in the prediction, regulation and alleviation of NSCLC (Pennell et al. Citation2019). Under this circumstance, the detection of effective biomarkers is a major part for NSCLC progression. To develop an intimate acquaintance of NSCLC mitigation, we performed a long non-coding RNA (lncRNA)-based approach to apprehend the possible crosstalk in NSCLC, with the purpose to find brand-new intervention management.
LncRNAs are identified as sanguine biomarkers by serving as the oncogenes or tumor suppressors in tumors as their dysregulation is found to be the necessary mediators in tumor growth and metastasis (Bhan et al. Citation2017). Furthermore, latest advance has found that lncRNAs play an essential role in NSCLC via participating epithelial–mesenchymal transition (EMT), cell biological activities, dissemination, and stem cell existence (Lu et al. Citation2018). It was documented that long intergenic non-protein coding RNA 01106 (LINC01106) is responsible for the alteration in colorectal cancer (CRC) patient clinical performance and overall survival rate (Gu et al. Citation2020). On the other hand, LINC01106 depletion could lead to the suppression of endometrial cancer (Gao et al. Citation2020). Collectively, LINC01106 plays a stimulatory role in cancer. A previous research has pointed out that lncRNAs exert their functions via serving as the sponges of microRNAs (miRNAs) (Paraskevopoulou and Hatzigeorgiou Citation2016). LINC01116 promoted the growth, migration and invasion of bladder cancer cells by targeting the miR-3612 (Meng et al. Citation2020). Besides, LINC01116 competitively binds to miR-449b-5p to augment CRC development (Guo et al. Citation2020). Altogether, LINC01116 is a putative player in the ceRNA network. miRNAs are another popular topic in cancer researches as they mediate the possesses of cellular growth, differentiation and apoptosis, DNA repair, EMT and neoplasm metastasis (Liu et al. Citation2018). Likewise, miRNAs are frequently abnormally expressed in NSCLC, making them profound biological tools in NSCLC prediction and prognosis (Du et al. Citation2018). Copious reports have suggested that miR-765 underexpression deteriorates multiple human cancers, embracing ovarian cancer and prostate cancer (Leung et al. Citation2014; Salinas-Vera et al. Citation2019). Therefore, miR-765 can be a productive factor in neoplasm reduction. While there is no literature describing the interaction between LINC01106 and miR-765 in NSCLC, some previous studies have introduced that miR-765 acted as a hub gene to promote different tumors by sponging LINC RNA (Yuan et al. Citation2019; Zhu et al. Citation2019 ). As a downstream target gene, collagen type III (COL3A1) is implicated in several cancers (Li et al. Citation2020; Lin et al. Citation2020) ). COL3A1 is evidently upregulated in NSCLC (Yu et al. Citation2020b). Here, we attempt to discuss the possible role of LINC01106 in NSCLC. Generally speaking, it may be safely assumed that LINC01106 could make a difference in NSCLC by regulating the miR-765/COL3A1 axis.
Materials and methods
Ethics statement
This study was approved and supervised by the ethics committee of the First Affiliated Hospital of Gannan Medical University. The protocol was also approved by the Institutional Animal Care and Use Committee of First Affiliated Hospital of Gannan Medical University and Guidelines for the Care and Use of Laboratory Animals proposed by the National Institutes of Health, USA. Significant efforts were made in order to minimize both the number of animals used as well as their respective suffering.
Cell cultivation
Human normal lung epithelial cells BEAS-2B and human NSCLC cell lines H460 (cell line of large CLC), H520 (cell line of squamous CL carcinoma), H1299 (cell line of lung adenocarcinoma) and A549 (cell line of lung adenocarcinoma) (all from Shanghai Institutes for Biological Sciences, Shanghai, China) were cultivated in Roswell Park Memorial Institute (RPMI)-1640 medium (Invitrogen Inc., Carlsbad, CA, USA) consisting of 10% fetal bovine serum (FBS) (Gibco Company, Grand Island, NY, USA) and 100 U/mL penicillin/streptomycin (Sigma-Aldrich, Merck KGaA, Darmstadt, Germany) in 37°C humidified air with 5% CO2.
Cell transfection
Short hairpin (sh)/ LINC01106#1/2 and sh-negative control (NC), miR mimic and miR-NC (synthesized by Shanghai GenePharma Co., Ltd, Shanghai, China) were all constructed into the pLKO.1 vector (Addgene#10878). Lentiviral particles were prepared as previously reported (Lin et al. Citation2013). Afterwards, lentiviral particles with the above-mentioned plasmids were transfected into A529 cells via Lipofectamine 3000 (Invitrogen) for 48 h. Eventually, these lentiviral particles were treated with the administration of 2 μg/mL puromycin for 48 h for the filtration of stably transfected cells.
Reverse transcription quantitative polymerase chain reaction (RT-qPCR)
Trizol reagent (Invitrogen) was utilized to extract the total RNA from different cells, and the extracted RNA was reversely transcribed into cDNA in compliance with the instructions of the cDNA kits (Thermo Fisher Scientific Inc., Waltham, MA, USA). Then, LINC01106 expression was determined using the PrimeScript RT-PCR kits (Roche, Basel, Switzerland), with glyceraldehyde-3-phosphate dehydrogenase (GAPDH) as the internal reference. Besides, the miR extraction kits and the miR stem loop synthesis kits (both from Nanjing Vazyme Biotech Co., Ltd, Nanjing, Jiangsu, China) were applied to assess miR-765 expression, with U6 small nuclear RNA as the internal reference. All primers were synthesized by Takara Bio Inc., Kyoto, Japan (Table ). Gene expression was calculated by the 2-△△Ct method. After that genes were normalized to GAPDH or U6, respectively, for quantification. All steps were performed 3 times.
Table 1. Primers sequence of RT-qPCR.
Subcellular fractionation
Cytoplasm and nuclei were fractionated through the cytoplasm and nuclei RNA purification kits (Norgen, Thorold, ON, Canada). Then the expression of U6, GAPDH and LINC01106 in the cytoplasm of A549 cells was detected by RT-qPCR.
Cell counting kit-8 (CCK-8) method
Following the instructions of the CCK-8 kits (Bimake, Shanghai, China) were applied to analyze the relative cell viability at 24, 48 and 72 h after transfection. That is to say, cells (5×10³ cells/well) were seeded into 96-well plates with 5 duplication wells set for each group, and cultivated with 10 μL CCK-8 solution at a 37°C incubator for 1 h. Subsequently, the optical density at 450 nm of each sample was determined.
Transwell assay
Cells (1×10⁵) were cultured in RPMI-1640 medium to detect cell migration and invasion with the assistance of 24-well transwell inserts uncoated or coated with matrix gel (BD Biosciences, San Jose, CA, USA) placed at the apical chamber. Cells were then transferred into a medium containing 20% FBS for a 24 h-cultivation. Cells at the basolateral chamber of the incubator were fixed, stained and counted in five different visual fields under ×100 magnification.
Western blot analysis
Proteins were extracted from A549 cells using the radio-immunoprecipitation assay (RIPA) buffer consisting of protease inhibitor (Beyotime Biotechnology Co. Ltd., Shanghai, China), and protein concentration was then measured by a protein bicinchoninic acid kit (Thermo Fisher Scientific). Then, the proteins were transferred onto the polyvinylidene fluoride membranes (Millipore, Billerica, MA, USA) after being separated by sodium dodecyl sulfate polyacrylamide gel electrophoresis. Afterwards, the membranes were blocked by 5% bovine serum albumin at room temperature and then incubated with the primary antibodies (all from Cell Signaling Technology, Beverly, MA, USA): anti-E-cadherin (1:1000, #3195), N-cadherin (1:1000, #4061), COL3A1 (1:1000, #30565) and GAPDH (1:1000, #2118) at 4°C overnight. Next, the membranes were rinsed with tris-buffered saline–tween buffer for at least 3 times. Subsequently, membranes were cultured with second antibody horseradish peroxidase (HRP) combined anti-rabbit immunoglobulin G (IgG) (1:2000, #7074) at room temperature for 1 h. In addition, the membranes were visualized using the electrochemiluminescence (Applied Biosystems, Inc., Carlsbad, CA, USA) and quantified by ImageLab software (Bio-Rad, Inc., Hercules, CA, USA).
Xenograft tumors in nude mice
A total of 18 healthy BALB/c male nude mice (4 weeks) (Beijing Vital River Laboratory Animal Technology Co., Ltd, Beijing, China) were randomly divided into three groups (n = 6), with A549 cells (2×10⁶ cells/100 μL) transfected with sh-NC, sh-LINC01106#1 and sh-LINC01106#2 were subcutaneously injected into the right side of nude mice, respectively. Tumor volume was measured every other week. Four weeks later, nude mice were anesthetized via pentobarbital sodium (50 mg/kg) and then sacrificed by cervical dislocation to separate and weigh the transplanted tumors in vivo. Consequently, Ki67 expression was analyzed by immunohistochemistry (IHC). RT-qPCR and western blot analysis were conducted to verify the results.
IHC
Paraffin-embedding tissue sections at 4 μm were fixed by formalin, dewaxed and hydrated. Antigen recovery was performed with 0.01 mol/L sodium citrate buffer (pH 6.0) at high pressure, followed by cooling for 1 h and rinsing in PBS. Non-specific binding was blocked as endogenous peroxidase activity was exhausted by incubation with H2O2 (3%) in methanol for 15 min, followed by incubation with normal serum. The slides were then incubated with the primary antibody anti-Ki67 (1:100) at 4°C overnight. Tissue sections were washed and treated with second antibody of the SP kits (Zhongshan Jindengqiao Co., Ltd, Beijing, China) for 30 min at room temperature, followed by strept-avidin HRP complex (SABC) for 30 min. Afterwards, sections were subjected to treatment with the 2, 4-diaminobutyric acid kits (Zhongshan Gutenberg Co., Ltd, Beijing, China), counterstaining with hematoxylin and fixation. PBS substituted for the original antibody as the NC. IHC staining was scored according to the percentage of positive cells. Five random visual fields were assessed by two independent observers who were blinded to the pathological sections under ×400 magnification.
Dual-luciferase reporter gene assay
LINC01106 3′UTR or COL3A1 3′UTR sequences with binding sites of miR-765 were cloned to pGL3 vector (Promega Corporation, Madison, Wisconsin, USA) to construct wild type (WT) plasmids. Then, mutant type (MUT) plasmids were constructed via the Phusion site-directed mutagenesis kits (Thermo Fisher Scientific). The WT and MUT plasmids were co-transfected with miR-765-mimics or miR-NC into A549 cells for 48 h, with cells lyzed for supernatant collection. Consequently, luciferase activity of the above plasmids was examined using the dual-luciferase reporter gene assay system (Promega), with renilla luciferase activity as the criterion.
RNA immunoprecipitation (RIP)
RIP was conducted in A549 cells in accordance with the instructions of the RIP kits (Millipore) (Sun et al. Citation2020). Cell lysates were obtained from RIPA lysis buffer, and they were incubated with normal mouse IgG or RIP buffer consisting of beads that were supplemented with human anti-Ago2 antibody (Proteintech, Chicago, USA). Eventually, RNA undergoing RIP purification was detached by protease K, and the relative enrichment of RNA was verified by RT-qPCR.
Statistical analysis
The results are shown in mean ± standard deviation. Student’s t-test was used for analyzing comparisons between two groups. One-way analysis of variance (ANOVA) was used for comparing different groups and Tukey's multiple comparisons test for pairwise comparisons after ANOVA. All steps were repeated three times. GraphPad Prime 8.0 (GraphPad Software, San Diego, CA, USA) was employed to get data analysis. p was attained using two-tailed test and p < 0.05 indicated significant difference.
Results
LINC01106 expression is upregulated in NSCLC
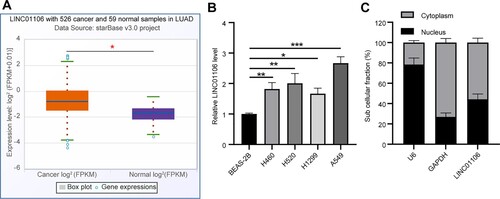
It was unveiled that LINC01106 expression was elevated in lung adenocarcinoma samples through the starbase bioinformatics website (http://starbase.sysu.edu.cn/panGeneDiffExp.php) (p < 0.05, Figure (a)). First of all, LINC01106 expression in NSCLC was detected by RT-qPCR, from which it was shown that compared with the normal lung epithelial cells (BEAS-2B), the NSCLC cells possessed increased LINC01106 expression (all p < 0.05); although LINC01106 expression was undulated in different NSCLC cell lines, the highest expression was seen in A549 cells (Figure (b)), thus they were selected for further steps. The subcellular fractionation assay suggested that LINC01106 was distributed in both cytoplasm and nuclei (Figure (c)).
Figure 1. LINC01106 expression is upregulated in NSCLC. (a) LINC01106 expression in squamous cell lung carcinoma was predicted through the bioinformatics website. (b) LINC01106 expression in NSCLC cell lines and normal lung epithelial cell line was detected by RT-qPCR. (c) LINC01106 expression in the cytoplasm and nuclei of A549 cells was verified by RT-qPCR. Repetitions = 3. The results are shown in mean ± standard deviation. One-way ANOVA was used to determine statistical significance. Tukey’s multiple comparisons test was applied for post hoc test. * p < 0.05, ** p < 0.01, *** p < 0.001.
LINC01106 knockdown relieves the malignant phenotype in NSCLC
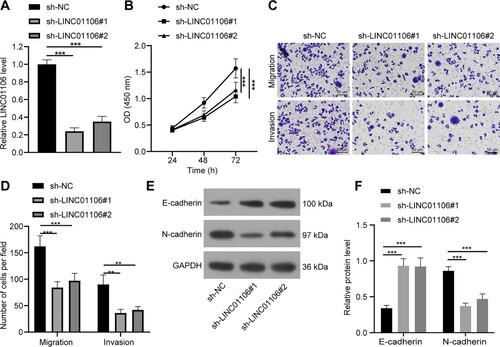
Functional analysis was carried out in A549 cells transfected with LINC01106 shRNA for a clarification of the mechanism of LINC01106 in NSCLC. Toward this, sh-LINC01106#1 and sh-LINC01106#2 were employed to exhaust LINC01106 expression in NSCLC (Figure (a)). The results of the CCK-8 method found that LINC01106 knockdown limited A549 cell proliferation (all p < 0.001; Figure (b)). The Transwell assay further discovered that LINC01106 knockdown quenched A549 cell migration and invasion (all p < 0.01; Figure (c,d)). Moreover, LINC01106 knockdown led to elevated E-cadherin level and declined N-cadherin level, which meant that LINC01106 underexpression was responsible for the exhaustion of EMT (all p < 0.01; Figure (e,f)). These findings indicated that LINC01106 knockdown blocked NSCLC cell proliferation, migration and invasion.
Figure 2. LINC01106 knockdown relieves the malignant phenotype in NSCLC. (a) LINC01106 expression in A549 cells with LINC01106 knockdown was detected by RT-qPCR. (b) A549 cell proliferation after LINC01106 knockdown was accessed by the CCK-8 method. (c and d) A549 cell migration (c) and invasion (d) after LINC01106 knockdown was measured by the Transwell assay. (e and f) levels of EMT markers (e) and their gray value (f) in A549 cell proliferation after LINC01106 knockdown was determined by western blot analysis. Repetitions = 3. The results are shown in mean ± standard deviation. One-way ANOVA was used to determine statistical significance. Tukey’s multiple comparisons test was applied for post hoc test. ** p < 0.01, *** p < 0.001.
LINC01106 knockdown reduces NSCLC tumor growth in vivo
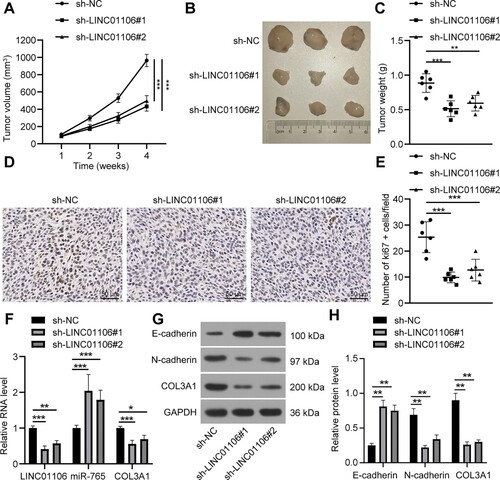
To identify the function of LINC01106 in vivo, A549 cells transfected with sh-NC, sh-LINC01106#1 or sh-LINC01106#2 were subcutaneously injected to nude mice to observe the effect of LINC01106 on tumor growth. Afterwards, it was noticed that compared with those in the sh-NC group, tumor volume and weight in the sh-LINC01106#1 group and the sh-LINC01106#2 group were reduced (all p < 0.01; Figure (a–c)). To probe the relation between LINC01106 knockdown-reduced tumor growth and tumor cell proliferation, Ki67 level in tumor tissues from nude mice was analyzed via IHC. Compared with the sh-NC group, the sh-LINC01106#1 group and the sh-LINC01106#2 group exhibited decreased Ki67+ cell number (all p < 0.001; Figure (d,e)). The expression of LINC01016, miR-765 and COL3A1 was detected by RT-qPCR. When LINC01106 was silenced, the mRNA expression of LINC01016 and COL3A1 was downregulated, and miR-765 expression was increased (all p < 0.01; Figure (e)). Next, levels of E-cadherin, N-cadherin and COL3A1 were assessed, and the results were similar to those in the in vitro experiment as LINC01106 silencing led to upregulation of E-cadherin level and downregulation of N-cadherin and COL3A1 levels (all p < 0.01; Figure (f)). It was suggested that LINC01106 knockdown discouraged tumor growth by inhibiting A549 cell proliferation.
Figure 3. LINC01106 knockdown reduces NSCLC tumor growth in vivo. (a–c) tumor volume growth curve (a), reprehensive images (b) and weight (c) of transplanted tumor sample at the 4th week of nude mice from each group. (d) and E, Ki67 positive expression (d) and positive cell number (e) of nude mice from each group detected IHC. (f), mRNA expression of LINC01106, miR-765 and COL3A1 was determined by RT-qPCR. (g and h) protein levels (g) and gray values (h) of E-cadherin, N-cadherin and COL3A1 in tumor tissues from nude mice of each group. N = 6. The results are shown in mean ± standard deviation. One-way ANOVA was used to determine statistical significance. Tukey’s multiple comparisons test was applied for post hoc test. * p < 0.05, ** p < 0.01, *** p < 0.001.
LINC01106 serves as a sponge of miR-765 in NSCLC
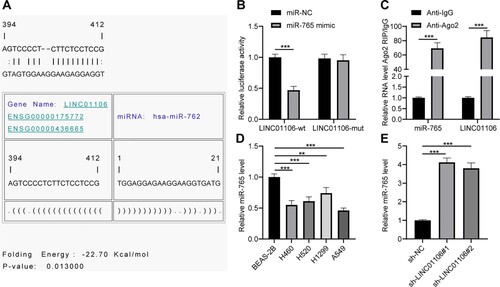
To further figure out the oncogenic mechanism of LINC01106 in NSCLC progression, RNA22 (https://cm.jefferson.edu/rna22/) was used to predict the interaction between miRNA and LINC01106. Eventually, it was found that there was a conservative binding site between LINC01106 and miR-765 (Figure (a)). According to the results of the dual-luciferase reporter gene assay, when miR-765 was overexpressed, luciferase activity of LINC01106-WT was downregulated (Figure (b)). The Ago2-RIP assay discovered that LINC01106 and miR-765 enriched induced silencing complex in RNA (Figure (c)). RT-qPCR was performed to examine miR-765 expression in NSCLC cells, and the results showed that miR-765 expression in NSCLC cell lines was lower than that in the normal lung epithelial cell line (all p < 0.01; Figure (d)). Furthermore, when LINC01106 was downregulated in A549 cells, miR-765 expression was evidently activated (Figure (e)). That is to say, LINC01106 could serve as a sponge of miR-765 in NSCLC.
Figure 4. LINC01106 serves as a sponge of miR-765 in NSCLC. (a) there was a potential binding site between LINC01106 and miR-765. (b) The dual-luciferase reporter gene assay was performed as LINC01106-WT or LINC01106-MUT was co-transfected with miR-765 mimic or miR-NC into A549 cells. (c) According to the results of RIP, LINC01106 and the miR-765 enriched induced silencing complex in RNA. (d) miR-765 expression in NSCLC cells and normal lung epithelial cells was detected by RT-qPCR. (e) miR-765 expression in A549 cells with LINC01106 knockdown was measured by RT-qPCR. Repetitions = 3. The results are shown in mean ± standard deviation. The Student’s t-test was used to determine statistical significance. Tukey’s multiple comparisons test was applied for post hoc test. ** p < 0.01, *** p < 0.001.
miR-765 overexpression inhibits A549 cell proliferation, migration and invasion
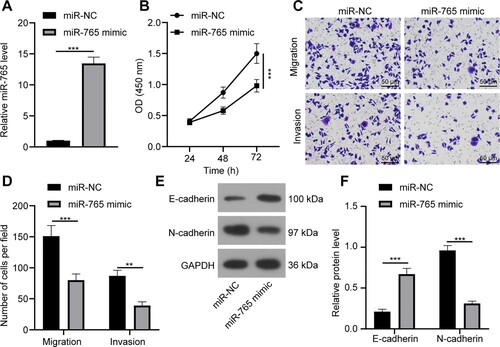
To explore role of miR-765 in A549 cell biological functions, miR-765 transfection efficiency was determined. RT-qPCR found that miR-765 mimic could greatly overexpress miR-765 (p < 0.001; Figure (a)), indicating the successful transfection of miR-765 mimic into A549 cells. The CCK-8 method revealed that miR-765 overexpression inhibited A549 cell viability (p < 0.001; Figure (b)). The Transwell assay unmasked that miR-765 overexpression suppressed A549 cell migration and invasion (p < 0.01; Figure (c,d)). In addition, miR-765 overexpression could upregulate E-cadherin level and reduce N-cadherin level (p < 0.01; Figure (e,f)). These data above suggested that miR-765 overexpression suppressed A549 cell proliferation, migration and invasion.
Figure 5. miR-765 overexpression inhibits A549 cell proliferation, migration and invasion. (a) miR-765 expression in A549 cells with miR-765 overexpression was detected by RT-qPCR. (b) A549 cell proliferation after miR-765 overexpression was verified through the CCK-8 method. (c and d) A549 cell migration and invasion (c) and statistical analysis (d) were measured via the Transwell assay. (e and f) levels of EMT markers (e) and their gray value (f) in A549 cell after miR-765 overexpression was accessed by western blot analysis. Repetitions = 3. The results are shown as mean ± standard deviation. Student’s t-test was used to determine statistical significance. ** p < 0.01, *** p < 0.001.
COL3A1 might be a direct target of miR-765
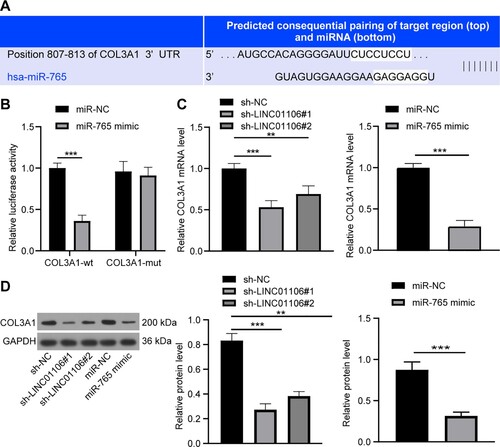
COL3A1 is associated with lung adenocarcinoma (Yu et al. Citation2020b). Essentially, it was predicted that there were binding sites between miR-765 and COL3A1 3’UTR via online software (http://www.targetscan.org/vert_71/) (Figure (a)). The co-transfection of miR-765 mimic and COL3A1-WT vector inhibited the relative luciferase activity of COL3A1 (p < 0.001), but the luciferase activity of COL3A1-MUT was not affected by miR-765 mimic treatment (p > 0.05, Figure (b)). RT-qPCR and western blot analysis were carried out, and it was discovered that COL3A1 expression was reduced in A549 cells upon LINC01106 silencing or miR-765 overexpression (both p < 0.05, Figure (c-d)). These results suggested that LINC01106 might act via the ceRNA network to sponge miR-765 and elevate COL3A1 expression in NSCLC.
Figure 6. COL3A1 might be a direct target of miR-765. (a) The potential binding sites between COL3A1 3’UTR and miR-765. (b) COL3A1-WT or COL3A1-MUT and miR-765 mimic or miR-NC was co-transfected into A549 cells, and the transfection efficiency of the co-transfection was detected by the dual-luciferase reporter gene assay. (c) mRNA expression of COL3A1 in A549 cells with LINC01106 silencing or miR-765 overexpression was assessed by RT-qPCR. (d) Protein level of COL3A1 in A549 cells with miR-765 overexpression was examined by the western blot analysis. Repetitions = 3. The results are shown as in mean ± standard deviation. Student’s t-test was used to determine statistical significance. Tukey’s multiple comparisons test was applied for post hoc test. * p < 0.05, ** p < 0.01, *** p < 0.001.
Discussion
NSCLC referred to a prevailing LC with a frequent occurrence of disappointing prognosis and recurrence (Gester et al. Citation2016). LncRNAs participated in a mounting number of cell biological behaviors, and the dysregulation of lncRNAs was actively involved in cancer pathogenesis, such as NSCLC (Osielska and Jagodzinski Citation2018). LINC01106 was strongly expressed in CRC, and it was correlated with malignant CRC and frustrating clinical outcomes (Guo et al. Citation2020), illustrating that LINC01106 could augment cancer. Thus, we were encouraged to figure out the potential role of LINC01106 in the biological processes in NSCLC. To our knowledge, this is the first research regarding the specific mechanism of LINC01106 in NSCLC in the involvement of the host gene.
The first principal finding from this experiment was that LINC01106 was strongly expressed in NSCLC cells. LINC01106 overexpression was also found in the tissues of endometrial cancer; while the exhaustion of LINC01106 resulted in the inhibition of tumor cell activities and metastasis (Gao et al. Citation2020). Furthermore, LINC01106 was also related to the bad overall survival rate in subjects with CRC (Sun et al. Citation2019). Although there are few literatures about LINC01106, we can still learn that it is an oncogene in a mass of human neoplasm from the evidence collected above. Besides, this study supported that LINC01106 exhaustion reduced the malignant phenotype in NSCLC as presented by the high E-cadherin level and low N-cadherin level. Guo et al. noted that LINC01106 expression was higher in the CRC tissues than that in the healthy colon tissues, and it could trigger CRC tumor spread and malignant phenotype, which can be further confirmed by the growing level of E-cadherin and the reduced level of N-cadherin when LINC01106 was downregulated (Guo et al. Citation2020). Cadherin proteins played various roles in cancers as they were involved in the biological behaviors of cancer (van Roy Citation2014). E-cadherin depletion emerged as a prominent reason of EMT, which was a major cause for metastatic neoplasm, such as NSCLC (Petrova et al. Citation2016 ; (Chae et al. Citation2018). On the other hand, N-cadherin was deemed as a crucial indicator in the invasion and metastasis of a diversity of cancers, including squamous cell carcinoma, breast cancer as well as NSCLC (Cao et al. Citation2019). Additionally, LINC01106 knockout suppressed NSCLC tumor development in vivo with the involvement of decreased Ki67 level. Since Ki67 predicted perilous prognosis and high incidences of mortality and relapse in NSCLC (Grant et al. Citation2018), its downregulation is undoubtedly associated with improved NSCLC. Collectively, we were inspired that LINC01106 knockdown could protect against NSCLC. Furthermore, we attempted to elaborate the downstream mechanism of LINC01106 in NSCLC. The ceRNA interaction, in which lncRNAs sponge miRNAs to influence mRNA transcription, is essentially involved in NSCLC progression (Shan et al. Citation2019), and LINC01106 functioned as a upstream gene in the ceRNA network to mediate gastric cancer malignancy (Hong et al. Citation2021). In conclusion, we were encouraged to explore the possible target miRNA of LINC01106.
Importantly, our study uncovered that LINC01106 served as a sponge of miR-765 in NSCLC. Previous study pointed out that lncRNAs modulated neoplasm incidence and functional responses by serving as the sponges of miRs (Du et al. Citation2016), which confirmed our faith and confidence to proceed this experiment. It was recently unveiled that LINC01106 mediated the growth of CRC by acting as the sponge of a miR (Guo et al. Citation2020). What is more, Ding and his colleagues revealed that miR-765 restricted tongue squamous cell carcinoma metastasis, expansion and cell cycle by sponging other LINC RNA (Ding et al. Citation2018). In CRC patients, knockout of a LINC RNA relieved CRC malignancy and chemotherapy resistance via serving as a sponging of miR-765 (Yu et al. Citation2020a). The above evidence strengthened the possibility of the collaborative role of LINC01106 and miR-765 in NSCLC through the ceRNA network. In addition to this, it was found that miR-765 overexpression inhibited NSCLC cell proliferation, migration and invasion as shown by the increased E-cadherin level and declined N-cadherin level. According to Xiao et al., miR-765 expression was promoted in healthy cancerous tissues compared with the tissues with clear cell renal cell carcinoma, and it limited carcinoma dissemination and metastasis (Xiao et al. Citation2020). Moreover, miR-765 could function as a tumor inhibitor for glioma (Du et al. Citation2020). A previous research reported that in oral squamous cancer cells where miR-765 was overexpressed, the E-cadherin level was accordingly enhanced to restrict cell metastasis (Zheng et al. Citation2017), suggesting the positive relation between miR-765 and E-cadherin. Hence, we draw a conclusion that miR-765 is conducive in finding suitable targeted therapy for NSCLC. Next, the downstream mRNA in the ceRNA was discussed. Our finding demonstrated that COL3A1 might be a direct target of miR-765. Notably, COL3A1 participated in the ceRNA interaction to affect leiomyoma (Chuang et al. Citation2021). COL3A1 expression was elevated in NSCLC and it accelerates EMT with the involvement of a declined level of E-cadherin and an increased level of N-cadherin (Yin et al. Citation2016). All in all, LINC01106 acted as a ceRNA to sponge miR-765 and enhance COL3A1 expression in NSCLC.
LncRNAs, a new class of ncRNAs, could be considered as miRNA sponges (Thomson and Dinger Citation2016). For example, lncRNA UCA1 promotes the malignant phenotype of kidney cancer cells by regulating the miR-182-5p/DLL4 axis as a ceRNA (Wang et al. Citation2020). In lung cancer, lncRNA LCAT1 functioned as a ceRNA to promote the growth and metastasis of lung cancer cells by sponging miR-4715-5p and regulating RAC1 (Yang et al. Citation2019). The bioinformatics analysis indicated the binding sites between LINC01106 and miR-765. Furthermore, the dual-luciferase reporter gene assay and RIP analysis confirmed that miR-765 could bind to LINC01106 and that miR-765 expression was upregulated upon LINC01106 knockdown, providing direct evidence that LINC01106 could act as a sponge of miR-765 to regulate NSCLC malignant phenotype. Our current results found that LINC01106 was upregulated in NSCLC cells. LINC01106 knockdown in vitro might inhibit NSCLC cell proliferation, migration and invasion by regulating the miR-765/COL3A1 axis. To date, no drugs targeting lncRNAs have been applied. Our study suggested that LINC01106 ablation could be a potential therapeutic approach for NSCLC. Further studies are needed to reveal the connection between LINC01106 and other tumors so that we can explore new broad-spectrum anti-tumor targets. We will focus on LINC01016, miR-765 and COL3A1 expression and their significance in NSCLC clinical samples in the following experiment to explore whether there is any correlation among the LINC01016/miR-765/COL3A1 network in NSCLC clinical samples. Overall, we hope that these findings will provide more effective therapeutic targets for NSCLC.
Conclusion
In summary, our study supported that LINC01106 knockdown suppressed NSCLC migration and invasion by sponging miR-765 and downregulating COL3A1. These results discovered a novel approach for NSCLC treatment. Still, this is just a preclinical research, although our findings provide a therapeutic implication in NSCLC treatment, the experiment results and effective application into clinical practice need further validation.
Disclosure statement
No potential conflict of interest was reported by the author(s).
Disclosure of interest
The authors declare that they have no competing interest.
Data availability
That data which supports the findings of the present study are available at the figshare repository (https://doi.org/10.6084/m9.figshare.16947475.v4).
Additional information
Funding
References
- Bhan A, Soleimani M, Mandal SS. 2017. Long noncoding RNA and cancer: a new paradigm. Cancer Res. 77:3965–3981.
- Cao ZQ, Wang Z, Leng P. 2019. Aberrant N-cadherin expression in cancer. Biomed Pharmacother = Biomed Pharmacother. 118:109320.
- Chae YK, Chang S, Ko T, Anker J, Agte S, Iams W, Choi WM, Lee K, Cruz M. 2018. Epithelial-mesenchymal transition (EMT) signature is inversely associated with T-cell infiltration in non-small cell lung cancer (NSCLC). Sci Rep. 8:2918.
- Chen Z, Fillmore CM, Hammerman PS, Kim CF, Wong KK. 2014. Non-small-cell lung cancers: a heterogeneous set of diseases. Nat Rev Cancer. 14:535–546.
- Chuang TD, Rehan A, Khorram O. 2021. Functional role of the long noncoding RNA X-inactive specific transcript in leiomyoma pathogenesis. Fertil Steril. 115:238–247.
- Ding J, Yang C, Yang S. 2018. LINC00511 interacts with miR-765 and modulates tongue squamous cell carcinoma progression by targeting LAMC2. J Oral Pathol Med. 47:468–476.
- Du Q, Liu J, Tian D, Zhang X, Zhu J, Qiu W, Wu J. 2020. Long noncoding RNA LINC00173 promotes NUTF2 expression through sponging miR-765 and facilitates tumorigenesis in glioma. Cancer Manag Res. 12:7211–7217.
- Du X, Zhang J, Wang J, Lin X, Ding F. 2018. Role of miRNA in lung cancer-potential biomarkers and therapies. Curr Pharm Des. 23:5997–6010.
- Du Z, Sun T, Hacisuleyman E, Fei T, Wang X, Brown M, Rinn JL, Lee MG, Chen Y, Kantoff PW, et al. 2016. Integrative analyses reveal a long noncoding RNA-mediated sponge regulatory network in prostate cancer. Nat Commun. 7:10982.
- Elias R, Morales J, Presley C. 2017. Checkpoint inhibitors for non-small cell lung cancer among older adults. Curr Oncol Rep. 19:62.
- Gao X, Yu L, Zhang J, Xue P. 2020. Silencing of long non-coding RNA LINC01106 suppresses the proliferation, migration and invasion of endometrial cancer cells through regulating the miR-449a/MET axis. Onco Targets Ther. 13:9643–9655.
- Gester F, Paulus A, Sibille AL, Duysinx B, Louis R. 2016. [Prognostic factors in Non small cell lung cancer]. Rev Med Liege. 71:34–39.
- Goebel C, Louden CL, McKenna R Jr., Onugha O, Wachtel A, Long T. 2019. Diagnosis of non-small cell lung cancer for early stage asymptomatic patients. Cancer Genomics Proteomics. 16:229–244.
- Grant L, Banerji S, Murphy L, Dawe DE, Harlos C, Myal Y, Nugent Z, Blanchard A, Penner CR, Qing G, et al. 2018. Androgen receptor and Ki67 expression and survival outcomes in non-small cell lung cancer. Horm Cancer. 9:288–294.
- Gu Y, Huang Y, Sun Y, Liang X, Kong L, Liu Z, Wang L. 2020. [Long non-coding RNA LINC01106 regulates colorectal cancer cell proliferation and apoptosis through the STAT3 pathway]. Nan Fang yi ke da xue xue bao = Journal of Southern Medical University. 40:1259–1264.
- Guo K, Gong W, Wang Q, Gu G, Zheng T, Li Y, Li W, Fang M, Xie H, Yue C, et al. 2020. LINC01106 drives colorectal cancer growth and stemness through a positive feedback loop to regulate the Gli family factors. Cell Death Dis. 11:869.
- Herbst RS, Morgensztern D, Boshoff C. 2018. The biology and management of non-small cell lung cancer. Nature. 553:446–454.
- Hong S, Li Q, Yang Y, Jing D, Zhu F. 2021. Silencing of long non-coding RNA LINC01106 represses malignant behaviors of gastric cancer cells by targeting miR-34a-5p/MYCN axis. Mol Biotechnol. 64:144–155.
- Leung YK, Chan QK, Ng CF, Ma FM, Tse HM, To KF, Maranchie J, Ho SM, Lau KM. 2014. Hsa-miRNA-765 as a key mediator for inhibiting growth, migration and invasion in fulvestrant-treated prostate cancer. PloS one. 9:e98037.
- Li J, Wang X, Wang Y, Yang Q. 2020. H19 promotes the gastric carcinogenesis by sponging miR-29a-3p: evidence from lncRNA-miRNA-mRNA network analysis. Epigenomics. 12:989–1002.
- Lin C, Garruss AS, Luo Z, Guo F, Shilatifard A. 2013. The RNA Pol II elongation factor Ell3 marks enhancers in ES cells and primes future gene activation. Cell. 152:144–156.
- Lin Y, Luo T, Weng A, Huang X, Yao Y, Fu Z, Li Y, Liu A, Li X, Chen D, et al. 2020. Gallic acid alleviates gouty arthritis by inhibiting NLRP3 inflammasome activation and pyroptosis through enhancing Nrf2 signaling. Front Immunol. 11:580593.
- Liu B, Shyr Y, Cai J, Liu Q. 2018. Interplay between miRNAs and host genes and their role in cancer. Brief Funct Genomics. 18:255–266.
- Lu T, Wang Y, Chen D, Liu J, Jiao W. 2018. Potential clinical application of lncRNAs in non-small cell lung cancer. Onco Targets Ther. 11:8045–8052.
- Meng L, Xing Z, Guo Z, Liu Z. 2020. LINC01106 post-transcriptionally regulates ELK3 and HOXD8 to promote bladder cancer progression. Cell Death Dis. 11:1063.
- Osielska MA, Jagodzinski PP. 2018. Long non-coding RNA as potential biomarkers in non-small-cell lung cancer: What do we know so far? Biomed Pharmacother = Biomed Pharmacother. 101:322–333.
- Osmani L, Askin F, Gabrielson E, Li QK. 2018. Current WHO guidelines and the critical role of immunohistochemical markers in the subclassification of non-small cell lung carcinoma (NSCLC): moving from targeted therapy to immunotherapy. Semin Cancer Biol. 52:103–109.
- Paraskevopoulou MD, Hatzigeorgiou AG. 2016. Analyzing MiRNA-LncRNA interactions. Methods Mol Biol. 1402:271–286.
- Pennell NA, Arcila ME, Gandara DR, West H. 2019. Biomarker testing for patients with advanced Non-small cell lung cancer: real-world issues and tough choices. Amer Soc Clin Oncol. 39:531–542.
- Petrova YI, Schecterson L, Gumbiner BM. 2016. Roles for E-cadherin cell surface regulation in cancer. Mol Biol Cell. 27:3233–3244.
- Rafei H, El-Bahesh E, Finianos A, Nassereddine S, Tabbara I. 2017. Immune-based therapies for non-small cell lung cancer. Anticancer Res. 37:377–387.
- Salinas-Vera YM, Gallardo-Rincon D, Garcia-Vazquez R, la Cruz ON H-d, Marchat LA, Gonzalez-Barrios JA, Ruiz-Garcia E, Vazquez-Calzada C, Contreras-Sanzon E, Resendiz-Hernandez M, et al. 2019. Hypoxamirs profiling identify miR-765 as a regulator of the Early stages of vasculogenic mimicry in SKOV3 ovarian cancer cells. Front Oncol. 9:381.
- Shan Y, Wang L, Li G, Shen G, Zhang P, Xu Y. 2019. Methylation of bone SOST impairs SP7, RUNX2, and ERalpha transactivation in patients with postmenopausal osteoporosis. Biochem Cell Biol. 97:369–374.
- Skrickova J, Kadlec B, Venclicek O, Merta Z. 2018. Lung cancer. Cas Lek Cesk. 157:226–236.
- Sun CC, Zhu W, Li SJ, Hu W, Zhang J, Zhuo Y, Zhang H, Wang J, Zhang Y, Huang SX, et al. 2020. FOXC1-mediated LINC00301 facilitates tumor progression and triggers an immune-suppressing microenvironment in non-small cell lung cancer by regulating the HIF1alpha pathway. Genome Med. 12:77.
- Sun F, Liang W, Tang K, Hong M, Qian J. 2019. Profiling the lncRNA-miRNA-mRNA ceRNA network to reveal potential crosstalk between inflammatory bowel disease and colorectal cancer. Peer J. 7:e7451.
- Tandberg DJ, Tong BC, Ackerson BG, Kelsey CR. 2018. Surgery versus stereotactic body radiation therapy for stage I non-small cell lung cancer: a comprehensive review. Cancer. 124:667–678.
- Thomson DW, Dinger ME. 2016. Endogenous microRNA sponges: evidence and controversy. Nat Rev Genet. 17:272–283.
- van Roy F. 2014. Beyond E-cadherin: roles of other cadherin superfamily members in cancer. Nat Rev Cancer. 14:121–134.
- Wang W, Hu W, Wang Y, An Y, Song L, Shang P, Yue Z. 2020. Long non-coding RNA UCA1 promotes malignant phenotypes of renal cancer cells by modulating the miR-182-5p/DLL4 axis as a ceRNA. Mol Cancer. 19:18.
- Xiao W, Wang C, Chen K, Wang T, Xing J, Zhang X, Wang X. 2020. MiR-765 functions as a tumour suppressor and eliminates lipids in clear cell renal cell carcinoma by downregulating PLP2. EBioMedicine. 51:102622.
- Yang J, Qiu Q, Qian X, Yi J, Jiao Y, Yu M, Li X, Li J, Mi C, Zhang J, et al. 2019. Long noncoding RNA LCAT1 functions as a ceRNA to regulate RAC1 function by sponging miR-4715-5p in lung cancer. Mol Cancer. 18:171.
- Yin H, Wang Y, Chen W, Zhong S, Liu Z, Zhao J. 2016. Drug-resistant CXCR4-positive cells have the molecular characteristics of EMT in NSCLC. Gene. 594:23–29.
- Yu DH, Ruan XL, Huang JY, Liu XP, Ma HL, Chen C, Hu WD, Li S. 2020b. Analysis of the interaction network of Hub miRNAs-Hub genes, being involved in idiopathic pulmonary fibers and its emerging role in non-small cell lung cancer. Front Genet. 11:302.
- Yu Y, Lu X, Yang C, Yin F. 2020a. Long noncoding RNA LINC00173 contributes to the growth, invasiveness and chemo-resistance of colorectal cancer through regulating miR-765/PLP2 axis. Cancer Manag Res. 12:3363–3369.
- Yuan L, Ma T, Liu W, Chen Y, Yuan Q, Ye M, Yu L, Li J, Niu Y, Nan Y. 2019. LINC00994 promoted invasion and proliferation of gastric cancer cell via regulating miR-765-3p. Am J Transl Res. 11:6641–6649.
- Zheng Z, Luan X, Zha J, Li Z, Wu L, Yan Y, Wang H, Hou D, Huang L, Huang F, et al. 2017. TNF-alpha inhibits the migration of oral squamous cancer cells mediated by miR-765-EMP3-p66Shc axis. Cell Signal. 34:102–109.
- Zhu X, Niu X, Ge C. 2019. Inhibition of LINC00994 represses malignant behaviors of pancreatic cancer cells: interacting with miR-765-3p/RUNX2 axis. Cancer Biol Ther. 20:799–811.