
 ?Mathematical formulae have been encoded as MathML and are displayed in this HTML version using MathJax in order to improve their display. Uncheck the box to turn MathJax off. This feature requires Javascript. Click on a formula to zoom.
Abstract
To analyse and predict the healing time of upper limb fractures in children, machine learning algorithms were used. Paediatric orthopaedic data was obtained from the University Malaya Medical Centre. The data set includes radiographs of upper limb fractures involving the radius, ulna, and humerus in children under the age of twelve, with ages recorded from the date and time of initial injury. Inputs assessment included: age, gender, bone type, the number of bones involved, fracture type, angulation and the distance of the fracture. Random Forest (RF) and Support Vector Regression (SVR) algorithms were used to predict and identify variables associated with fracture healing time. Self Organizing Maps was then used for visualization and ordination of factors associated with healing time. Algorithms performance was measured using root mean square error (RMSE). A significant determinant in fracture healing includes age, bone part, fracture angulation, and distance. The Wilcoxon signed ranked test reported there is a significant difference between the prediction result of the SVR model (RMSE = 2.56) and the RF model (RMSE = 2.66). Predicting healing time can be used in the treatment process and follow up period for general practitioners and medical officers. The algorithm is deployed online at https://kidsfractureexpert.com/.
Introduction
Skeletal trauma accounts for 15% of all injuries in children (Staheli, Citation2008). There are several types of fractures in the paediatric population, such as a transverse fracture which occurs when the fracture goes through at right angles to the long bone's shaft. Spiral type of fractures goes through an angle oblique to the long bone's shaft of the long bone. The bone structure of children has a thick periosteal layer, resulting in an incomplete type of fracture which is called buckle or torus fracture.
Children's fractures (0–12 years old) differ in features compared to adult fractures because children's bone structure and biomechanics are different from adult bones. Children have different fracture patterns, the healing process, and management compared to adult fractures (Budd, Citation2012). In paediatric cases, fractures in the upper limb (radius, ulnar and humerus) are more common than fractures in the lower limb (Saw, A., Fadzilah, N., Nawar, M., & Chua, Y. P., Citation2011).
Children's upper limb fractures take on average, half the time to fully recover compared to the adult's corresponding fracture (Ogden, Citation2000). In cases of paediatric fractures, it is essential to rule out other potential causes such as non-accidental injury or an underlying genetic or metabolic bone condition. While rates have been published for a normal adults’ bone restoration manner, not much is known about the rates of healing using radiographic evidence of fractures among pediatric cases.
Knowing the expected fracture healing time may help to identify non-accidental injuries as the healing time may vary as to what is expected (Tseng, Citation2013). Predicting healing time is useful and should be used as a tool in the treatment process for general practitioners and medical officers and in the follow-up period. This information will also assist the medical professional in advising and informing parents of the projected period for recuperation and return to school or sports.
However, limited studies on the application of machine learning in pediatric orthopaedic have been published. Rommers et al. (Citation2020) developed an extreme gradient boosting model to determine injury risk among elite-level youth football players aged 10–15 years using accuracy as a performance measure. However, the study is constrained to the selected variable that is not the common measure in standard clinical practice and it is not feasible in applying in real-world scenarios. Additionally, the study excluded other machine learning approaches in favour of the extreme gradient boosting algorithm, as different machine learning approaches produce varying results and performances (Rommers, et al., Citation2020). In our previous study, we estimated the healing time of pediatric lower limb fractures using machine learning algorithms such as Artificial Neural Networks (ANN) and Random Forest (RF). Additionally, we used the Kohonen self-organizing feature map (SOM) to deduce the association between lower limb healing time and the component associated with it in children aged 0–12 years (Malek, Citation2016).
The majority of the published studies on the application of machine learning in orthopaedics have been conducted on adult patients. Computer-aided diagnosis systems based on Support Vector Machine (SVM) kernel classifiers have been utilised to diagnose osteoporotic risk with a 90% accuracy rate (Sapthagirivasan, Citation2013). CatBoost, a gradient boosting modification algorithm, SVM, and logistic regression were all successfully used to predict fracture risk in patients with osteoporosis (Kong et al., Citation2020). Additionally, SVM is utilised to forecast fracture risk and hip fracture (Cristianini, Citation2000) (Jiang, Citation2014). Umadevi and Geethalakshmi (Citation2012) reported on the automatic diagnosis of fractures in the long bones of the tibia utilising Back Propagation Neural Networks, K-Nearest Neighbour, and SVM. Grundmeier, Masino, and Casper (Citation2016), successfully constructed SVM, RF, and Logistic Regression predictive models to accurately diagnose acute long bone fractures. Oskoei & Hu (Citation2008) classified upper limb motions using myoelectric signals using SVM.
The use of machine learning methods such as RF, SVM, and SOM in orthopaedics, particularly in paediatric orthopaedics for the upper limb region, has not yet been reported. The system for predicting healing time should be used as a tool in the treatment process for general practitioners and medical officers, as well as during the follow-up period. As a result, we aim to (1) use RF and SVR to predict the healing time of an upper limb fracture in children. (2) Using the RF and SVM feature importance methods, identify significant features associated with fracture healing time. (3) Using the SOM method, visualise significant factors associated with a paediatric fracture healing time of the upper limb.
Materials and methods
Data collection
Four years of 242 patient data and radiographs from the year 2010, 2014, 2015 and 2017 were acquired from Pediatric Orthopedic Unit, University Malaya Medical Centre, Kuala Lumpur Malaysia. Radiographs of fractured bones (humerus, radius and ulna) from infants and young children of ages less than 12 years were included, with ages recorded from the time of initial injury. Through patient records examinations, variables such as segment and part of bone involved, type of bone fracture, and measurement parameters such as angulation of the fracture and fracture distances to physis in both anterior and lateral views are obtained based on radiograph features (Malone, Citation2011) (Ogasawara, Martinez, De Oliveira, Zimbrão, & Mattoso, Citation2010). We also identified the time interval between injury and the union of the bone, age and sex of the patient. Healing time was defined as the time in which the bone achieved union.
We have used a total of 11 input variables; five continuous variables and six categorical variables. Explanations of categorical variables are in Table . The output variable for this study is the healing time which is measured in weeks. The results are expressed as mean and SD for continuous variables and as frequencies for categorical variables. Correlation analysis was carried out to identify the significant relationship between variables as stated in Table .
Table 1. Summary of Categorical Variables.
Table 2. Summary Statistics of Study Data.
Statistical analysis
Baseline characteristics of the patient's data were presented as means and standard deviations (SD) for all variables. We adopted a machine learning approach to predict the healing rate of pediatric upper limb bone fracture using two different machine learning methods, Random Forest (RF) and Support Vector Regression (SVR) and compared both algorithms to determine the bone fracture healing time in children.
The Wilcoxon Signed-Rank test (Fay & Proschan, Citation2010) was used to determine whether there was a significant relationship between the predicted results from the machine learning models in this study. We used the Wilcoxon Signed-Rank test following the non-parametric test that revealed the data was not normally distributed. In this study, statistical significance was defined as a p-value less than 0.05.
For continuous data, the mean and standard deviation were computed; for categorical variables, the frequencies were calculated. Correlation analysis was used to determine whether there were any significant correlations between the variables. We used the Self-Organizing Map (SOM) to coordinate components associated with fracture healing time. The SOM map's quality was determined using topological and quantization errors.
Models development
Prior to model development, data was normalized as some variables have a large variation or spread. Normalization of the raw datasets was, therefore, necessary to ensure that all values of the variables are within the same range. Normalization is essential for machine learning models such as ANN and SVR (Ogasawara, Martinez, De Oliveira, Zimbrão, & Mattoso, Citation2010) (Shen, et al., Citation2016). The normalized data is then divided randomly and stored into two separate datasets in an array; training set (70%) and testing set (30%). Then 5-fold cross-validation was used to avoid overfitting for model development on the training set (Geisser S., Citation1993) (Kim, Drake, & Park, Citation2006) which was implemented using the R caret package. Output was then de-normalized before evaluating the model performance.
Root mean square error (RMSE) was adopted in this study as a model assessment for the developed machine learning methods. RMSE was calculated based on the de-normalized value of the output. RMSE is used to measure the average level of prediction error. It indicates the absolute fit of the model to the data or how close the observed data points are to the model's predicted values (Armstrong, Citation2001). It is shown in the following formula where X is the observed value, Y is the predicted value, n is the number of readings used, and i is the individual reading of the value.
The Wilcoxon Signed-Rank test (Fay & Proschan, Citation2010) was then used to compare the statistical significance between predicted and actual healing weeks of the machine learning model.
Algorithms
The principle of RF is to combine many binary decision trees constructed using several bootstrap samples from a learning sample and choosing randomly at each node a subset of predictors. In RF each tree is considered as a standard classification or regression tree (CART) (Breiman, Citation2001). At each node in RF, a given number of input predictors (indicated as mtyr) are randomly chosen and the best split using the decrease of Gini impurity is calculated only within the subset. No pruning step is performed therefore all the trees of the forest are maximal trees. This random selection of features at each node decreases the correlation between the trees in the forest thus decreasing the forest error rate.
RF algorithm was used for fracture healing time prediction and variable selection. RF incorporates multiple binary decision trees constructed from bootstrap samples of training data and select a subset of predictors randomly at each node. The RF is repeated with different ntree arguments starting from ntree = 500 and ntree = 1000. This is done to examine the sensitivity to method argument mtry and ntree to better determine important variables and the stability of the variable importance scores.
SVR is used when the response variable is numerical rather than categorical (Vapnik, Golowich, & Smola, Citation1997). SVR is a nonparametric technique that depends on kernel functions and uses the principle of maximal margin as a convex optimization problem. SVR uses a cost parameter to avoid over-fit. Tuning parameter ‘sigma’ was held constant at a value of 0.6, and the cost parameter is set to the value of C = 0.25. In this study, the constructed SVR model for prediction used Radius Basis Function (RBF) kernel and linear kernel for variable importance.
Variable importance
Variable importance measures are automatically computed for each predictor in the RF algorithm to assess and rank the variables (Díaz-Uriarte & De Andrés, Citation2006). The mean decrease accuracy is defined as the difference between the out of bag error (MSE for regression) obtained through random permutation of the predictor of interest and the OOB error from the original dataset. Mean decrease accuracy was used to determine the important variables by the RF algorithm (Genuer, Poggi, & Tuleau-Malot, Citation2010) (Archer & Kimes, Citation2008).
Variable importance measures for the SVR model using linear kernel are obtained by building models for every predictor variable available against the response variable (Guyon & Elisseeff, Citation2003). The RMSE values are then recorded and a plot of variable importance is generated. The variable which possesses the lowest RMSE is marked as the most important variable.
Feature selection
Sequential backward elimination (SBE) was performed on the ranked variables by RF and SVR linear methods. The variables were deleted in descending order iteratively (Genuer, Poggi, & Tuleau-Malot, Citation2010). The prediction models were trained and tested for each iteration.
A variable is deemed as an important variable to the healing time if the RMSE value increases when the variable is deleted. The predictions model was constructed based on the variables that are deemed important and using a complete set of variables.
Visualization using SOM
SOM was used in this study to ordinate factors associated with fracture healing time. SOM decreases data dimensions and plot similarity by clustering technique. It is utilized to ordinate fracture input variables associated with the healing time based on the types of fractures. The Euclidian distances between the input factors are calculated and visualized as a U-matrix (unified distance matrix) and component planes by SOM. A component plane illustrates the comparative values of one component of the codebook vectors and the u-matrix visualizes the distances between the codebook vectors in a two-dimensional map (Kohonen, Citation1988) which plot the similarities of the data by grouping similar data items together. Thus, SOM reduces dimensions and displays similarities. This enables the discovery or identification of features or patterns of most relevance through data reduction and projection
In the Kohonen network, every node in the input layer is represented as a vector (xi) and is connected to each neuron (j). This connectivity is constituted as weights, wij(t), adaptively varying at each iteration of t. The weights are arbitrarily assigned into small values at first. As the input vector is sent through the network, each neuron computes the summed distance between the weight and input.
The winning neuron is selected based on the neuron that responds greatly to a given input vector. The winning neuron has the weight vector which has the shortest distance to the input vector. The winning neuron and maybe its neighbouring neurons are allowed to learn by altering the weights in a way to additionally decrease the Euclidian distance among the weight and the input vector via the following equation.
Zj is assigned 1 for the winning and neighbouring neurons while 0 is assigned for the other neurons, and represents the fractional to increase of the alteration (Kohavi & Provost, Citation1998). U-matrix is the acronym for a unified distance matrix. The U-matrix representation of SOM visualizes the distances between neurons. The distance between the adjacent neurons is calculated and presented with different colourings between the adjacent nodes (Kohonen, Citation1988)The SOM colours represent the values of u-matrix elements. Light areas signify clusters and dark areas as cluster separators in SOM u-matrix (Stefanovic & Kurasova, Citation2011). The quality of the SOM map is evaluated using topological and quantization error. We constructed the SOM using variables selected from the best model. The SOM is built using variables with higher scores until a suitable quantization and topographic error have been achieved.
Software
The software used in this study was R (Version 3.5.2) for the development of the RF and SVR algorithms. The following functions were used: randomForest(), and caret() (Version 3.5.2). A self-organizing map was generated by using a toolbox in MATLAB Ver. (R2013, Math Works). Statistical Package for Social Sciences (SPSS) programme version 16.0 was used for statistical analysis and data cleansing.
Results
Figure depicts the variable importance plot derived from the RF and SVR models. The importance of the variables is ranked against the time it takes for the fracture to heal. Variables with higher importance values are considered important in the RF model, whereas variables with lower RMSE values are considered important in the SVR model as shown in Figure .
Figure 1. A plot of feature importance from A) The RF variable importance model B) The SVR variable importance.
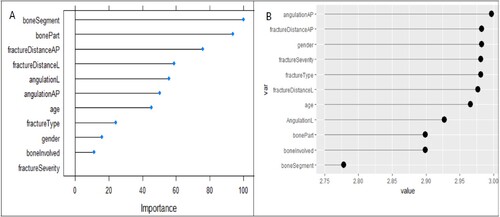
Figure 2. Sequential backward elimination on ranked variables based on RF variable importance method.
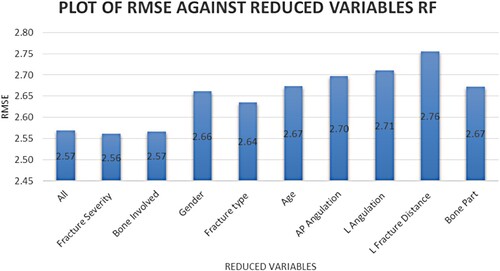
Figure shows the RMSE value recorded based on ranked variables using the SBE method for the RF model and Figure for the SVR model. A higher RMSE value after variable elimination indicates the variable's importance. Age, the bone part where the fracture occurs and fracture distance and angulation have all been identified as important predictors of fracture healing time. The performance measures for the models developed in this study are shown in Table .
Figure 3. Sequential backward elimination on ranked variables based on SVR variable importance method.
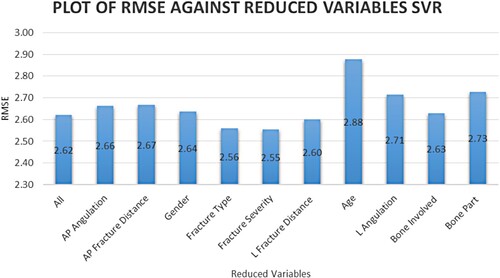
Table 3. Summary of the result for each of the machine learning models.
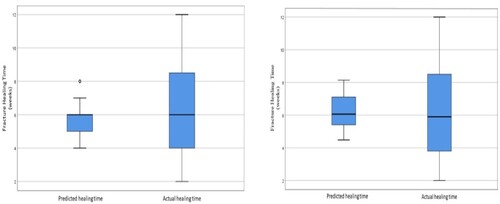
Figure illustrates a box plot of the RF model using a complete set of variables that resulted in an RMSE value of 2.57 (p = 0.933) and reduced variables with an RMSE value of 2.56 (p = 0.885). The best model for the reduced variables is using ten variables without fracture severity. There is no significant difference between predicted and actual healing time.
Figure 4. Boxplot of the healing weeks’ value distribution for the RF model with (A) all the variables and (B) the selected variables.
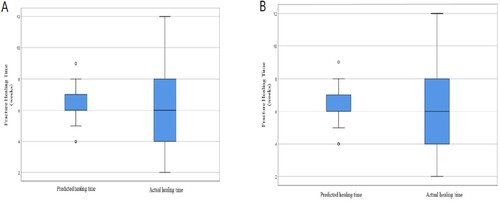
Figure illustrates box plot of SVR model using complete set of variables that resulted in RMSE value of 2.62 (p = 0.36) and reduced variables with RMSE value of 2.55 (p = 0.93). The best model for the reduced variables is using bone part, fracture anterior-posterior angulation and distance and age. There is no significant difference between predicted and actual healing time.
Figure 5. Boxplot of the healing week’s value distribution for the RF model with (A) all the variables and (B) the selected variables.
The non-parametric test for predicted results from the SVR and RF model, the Wilcoxon signed-rank test reported there is a significant difference between the predictions of the machine learning model between RF and SVR, the p value reported being 0.001 (p < 0.05).
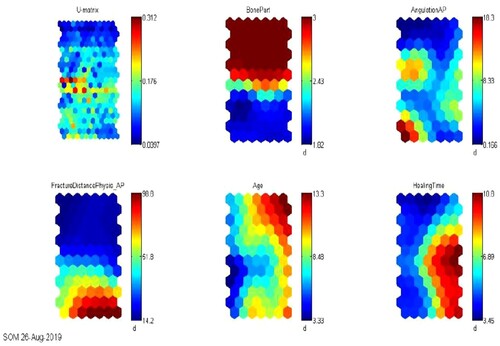
The blue region on the SOM component plane in Figure indicates a low value of the variable, whereas the red region indicates a higher presence of that variable. Colours in the middle (shades of other colours indicate average values for each variable) indicate that the value is average. The blue colour in the SOM component plane of healing weeks represents fast recovery, which is 5 weeks, while the red colour represents a longer time to fully recover, and the colours in between indicate a range of 5–10 weeks. Age is a significant factor that has been identified as a significant variable by the variable selection method. Despite higher fracture displacement and angulation, younger children (aged five and under) heal faster. Longer healing time is associated with increased age, the bone part where the fracture occurs, and greater fracture angulation or distance. When age is included in the SOM map, the quantitation and topographic error increased. The quantization error is reported to be 0.160, while the topographic error is reported to be 0.021.
Figure 6. SOM U-matrix and component planes of selected variables with healing weeks.
The best algorithm SVR in this study is available online at https://kidsfractureexpert.com/ for predicting paediatric fracture healing time. To generate a possible healing time for a patient fracture, the algorithm accepts input variables such as patient age, bone part, fracture angulation, and distance.
Discussion
We constructed SVR and RF prediction models using all variables and selected variables from the variable importance (VIMs) and the SBE method. The performance metrics in terms of RMSE for each model are calculated by taking into account all eleven input variables as well as selected variables (i.e. gender, age, bone involved, bone part, bone segment, fracture type, fracture severity, lateral and anterior fracture distance to physis (measured in millimetres), and lateral and anterior angulation (measured in degrees)). In addition, we employed the K-Fold cross-validation approach to forecasting model performance by generalising statistical analysis results to an independent dataset, which we found to be effective (Geisser & Johnson, Citation1993).
Models developed with selected variables for RF (RMSE = 2.56) and SVR (RMSE = 2.55) outperformed models developed with all variables for RF (RMSE = 2.56) and SVR (RMSE = 2.62) (p< 0.05 for all). The lower the RMSE, the better the outcome. There is no statistically significant difference between using all variables (RMSE = 2.56) (p = 0.993) and selecting variables for RF (RMSE = 2.56) (p = 0.885). However, for the SVR model, using all variables results in an RMSE value of 2.62, whereas using selected variables results in an improvement (RMSE 2.55) (p < 0.05). The SVR model slightly outperforms the RF model due to a small difference between models with all and reduced variables. With an RMSE of 2.55, the SVR model predicts test results that are within 2.55 weeks of the true median healing week value for the upper limb data used in this study. This 2.5-week period is clinically acceptable in its interpretation. This is due to the fact that patients’ follow-up period would be within that period, roughly two weeks after the fracture had healed, rather than on the exact day of bone healing.
SVR is used in this study because it is a non-parametric technique that does not rely on the underlying dependent and independent variable distributions. It is determined by the kernel function. When compared to RF, SVR followed the trends in the healing time (weeks) between the actual and predicted values. This could be because SVR for regression is known to be good at pattern recognition and function fitting. Previous research on the ANN, SVM and RF models in predicting the risk of osteoporosis found that the SVM model outperformed other machine learning methods in terms of accuracy (Kim, Yoo, & Kim, Citation2013). (Wu, Gong, Chang, Tsou, & Ting, Citation2016). SVM improves accuracy by optimising in a higher-dimensional space using a kernel. As a result, it produces better results than the RF model in this study.
The RF and SVR models were used to determine the list of variables of importance (VIMs). Generating VIMs is a critical component of improving model performance. The SBE algorithm relies solely on importance as an adequate term to eliminate unimportant variables from a model one by one (Royston & Sauerbrei, Citation2008), (Vittinghoff, Glidden, Shiboski, & McCulloch, Citation2011). When a variable is marked as important, the RMSE value increases when it is removed. This condition is stated in relation to the concept of ‘purposeful selection algorithm.’ The aforementioned concept combines the significance and change of RMSE values in the testing set in the selection of significant variables (Bursac, Gauss, Williams, & Hosmer, Citation2008) (Dunkler, Plischke, Leffondré, & Heinze, Citation2014). In this study, the important variables obtained by the backward elimination technique are bone part, age, fracture angulation, and fracture distance. Except for age, the selected variables are statistically significant with (p < 0.005).
Results that are presented in this study were also visualized in a 2-dimensional representation using the SOM technique. This allows the clinician, if there is confidence in the original training data, to place a new patient within the context of previous or similar cases. We found that age was the major determining factor in predicting the healing time, as compared to other variables. The younger children healed faster, despite the fracture being further away from the physis and did not vary with the bone part. Younger children have a thicker, osteogenic periosteal layer of bone. This enables the healing process to be initiated quicker and also helps with the eventual remodelling and strengthening of the bone once united.
In older children, age seven and above, the following variables were found to influence the healing time. The closer the fracture was to the physis, the faster the healing time. This is consistent with the known physiology of the bone. The physis is the centre that makes new bone and enables longitudinal bone growth. The area closer to the physis are highly osteogenic and as such play a role in the healing of fractures.
Fractures with less angulation also healed faster. This is because, with less angulation, there is less displacement of the fracture from the normal anatomy. As such, the process of healing occurs more rapidly as there is more contact area between the fracture fragments, which promotes the formation of bone callus.
Fractures involving the distal part of the bone healed faster. This is in comparison to diaphyseal fractures. The circulation and abundance of osteogenic factors in the metaphyseal region of the bone, enable more rapid healing for fractures in this bone part (Staheli, Citation2008), (Schwartz, Rozumalski, Truong, & Novacheck, Citation2013).
The developed RF and SVR models have demonstrated their utility as a tool for predicting and selecting significant variables that affect fracture healing time. This tool can be used to identify children who may require additional attention due to the possibility of a longer healing time. At this point, it is not possible to claim that the results presented here have universal applicability. If used in conjunction with a validation system and additional models developed to compare prediction ability, it is possible to develop a working application that will assist clinicians in keeping track of patients’ progress or evaluating any particular risk.
Conclusion
Machine learning methods have demonstrated their ability to predict the healing time of upper–lower limb fractures. However, the applications of machine learning methods are not yet fully developed, particularly in paediatric fracture healing. More research is needed to improve its performance, and more predictive models must be developed to compare better performance. Furthermore, the models developed in this study require additional validation. Based on the results obtained, SVR produces superior results to the RF model. SVR and SOM models, on the other hand, demonstrate their suitability as an extremely powerful tool for selecting the most important variables and predicting fracture healing time. Because there was no study done in the paediatric orthopaedic field, it was difficult to refer to or be directed to other research, so this work is considered original.
Ethical declaration
This study used patients’ data and radiographs from Paediatric Orthopaedic Unit, University Malaya Medical Centre in year 2010, 2014, 2015 and 2017. The ethics committee, Medical Research Ethics Committee, University Malaya Medical Centre (MREC ID NO: 202225-10975) has approved the research data to be used in this study. However, the research data apply in our study whereby patients’ private information are remained disclose and anonymous, where patient information sheet is not shared with the researchers. Thus, ethical issues are not much concern in our studies.
Statement of consent
The information and data applied in this study is anonymous, statement of consent is not applicable.
Data availability statement
Data available in a public repository that does not issue DOIs. The data that support the findings of this study are available from the Department of Orthopaedic Surgery, University of Malaya Medical Centre (UMMC) but restrictions apply to the availability of these data, and so are not publicly available. The data belongs to the individual ministry of health universities hospitals and private hospitals that require multiple institutional agreements for data release to third parties hence ethical approval is needed for analysis. Data are however available from UMMC upon request using http://www.ummc.edu.my/department/department.asp?kodjabatan=38 or email them at [email protected]. Any findings from the data need to be reported and permission needs to be obtained from the Department of Orthopaedic Surgery, University of Malaya Medical Centre (UMMC) committee before publication.
Disclosure statement
No potential conflict of interest was reported by the author(s).
Additional information
Funding
References
- Archer KJ, Kimes RV. 2008. Empirical characterization of random forest variable importance measures. Comput Stat Data Anal. 52(4):2249–2260.
- Armstrong JS. 2001. Evaluating forecasting methods. In: Armstrong JS, editor. Principles of forecasting. Boston: MA: Springer; p. 443–472.
- Breiman L. 2001. Random forests. Mach Learn. 45(1):5–32.
- Budd L. 2012, April 22. THE BASIC TYPES OF PEDIATRIC FRACTURES, DIFFERENCES FROM ADULTS AND CARE AS A PRIMARY CARE PHYSICIAN. Retrieved from http://learn.pediatrics.ubc.ca/body-systems/musculoskeletalsystem/.
- Bursac Z, Gauss CH, Williams DK, Hosmer DW. 2008. Purposeful selection of variables in logistic regression. Source Code Biol Med. 3(1):17.
- Cristianini N, Shawe-Taylor J. 2000. An introduction to support vector machines and other kernal-based learning methods. England: Cambridge University Press.
- Díaz-Uriarte R, De Andrés SA. 2006. Gene selection and classification of microarray data using random forest. BMC Bioinformatics. 7(1):3.
- Dunkler D, Plischke M, Leffondré K, Heinze G. 2014. Augmented backward elimination: a pragmatic and purposeful way to develop statistical models. PloS one. 9(11):e113677.
- Fay MP, Proschan MA. 2010. Wilcoxon-Mann-Whitney or t-test? On assumptions for hypothesis tests and multiple interpretations of decision rules. Statistics (Ber). 4:1.
- Geisser S. 1993. Predictive inference (Vol. 55). Ohio: CRC press.
- Geisser S, Johnson W. 1993. Testing independence of fragment lengths within VNTR loci. Am J Hum Genet. 53(5):1103–1106.
- Genuer R, Poggi J-M, Tuleau-Malot C. 2010. Variable selection using random forests. Pattern Recognit Lett. 31(14):2225–2236.
- Grundmeier RW. 2016. Identification of long bone fractures in radiology reports using natural language processing to support healthcare quality improvement. Appl Clin Inform. 07(4):1051.
- Guyon I, Elisseeff A. 2003. An introduction to variable and feature selection. J Mach Learn Res. 3:1157–1182.
- Jiang PM. 2014. Optimal SVM parameter selection for non-separable and unbalanced datasets. Struct Multidiscipl Optim. 50(4):523–535.
- Kim H, Drake BL, Park H. 2006. Adaptive nonlinear discriminant analysis by regularized minimum squared errors. IEEE Trans Knowl Data Eng. 18(5):603–612.
- Kim SK, Yoo TK, Kim DW. 2013. Osteoporosis risk prediction using machine learning and conventional methods. In: Engineering in Medicine and Biology Society (EMBC). IEEE.
- Kohavi R, Provost F. 1998. On applied research in machine learning. In: Kohavi Ron, editor. Editorial for the special issue on applications of machine learning and the Knowledge discovery process (p. 30). New York: Columbia University; p. 127–132.
- Kohonen T. 1988. Self-Organization and Associative Memory. Self-Organization and Associative Memory. In: Lotsch Helmut K.V., editor. Springer series in information Sciences (p. 312). Verlag Berlin Heidelberg New York: Springer; p. 3–311.
- Kong SH, Ahn D, Kim B, Srinivasan K, Ram S, Kim H, Hong AR, Kim JH, Cho NH, Shin CS. 2020. A novel fracture prediction model using machine learning in a community-based cohort. JBMR Plus. 4(3):e10337.
- Malek SG. 2016. A primary study on application of artificial neural network in classification of pediatric fracture healing time of the lower limb. Cham: Springer, 23-30.
- Malone CA. 2011. A radiographic assessment of pediatric fracture healing and time since injury*. J Forensic Sci. 56(5):1123–1130.
- Ogasawara E, Martinez LC, De Oliveira D, Zimbrão G, Pappa GL, Mattoso M. 2010. Adaptive normalization: A novel data normalization approach for non-stationary time series. In: E Ogasawara , editor. Neural Networks (IJCNN), The 2010 international joint conference. Barcelona, Spain: IEEE; p. 1–8.
- Ogden JA. 2000. Injury to the immature skeleton. New York: Skeletal Injury in the Child.
- Oskoei MA, Hu H. 2008. Support vector machine-based classification scheme for myoelectric control applied to upper limb. IEEE Trans Biomed Eng. 55(8):1956–1965.
- Rommers N, Rössler R, Verhagen E, Vandecasteele F, Verstockt S, Vaeyens R, Lenoir M, D’Hondt E, Witvrouw E. 2020. A machine learning approach to assess injury risk in elite youth football players. Med Sci Sports Exercise. 52(8):1745–1751.
- Royston P, Sauerbrei W. 2008. Multivariable model-building: a pragmatic approach to regression anaylsis based on fractional polynomials for modelling continuous variables. New Jersey: John Wiley & Sons.
- Sapthagirivasan V, Anburajan M. 2013. Diagnosis of osteoporosis by extraction of trabecular features from hip radiographs using support vector machine: An investigation panorama with DXA. Comput Biol Med. 43(11):1910–1919.
- Saw A, Fadzilah N, Nawar M, Chua YP. 2011. Pattern of childhood fractures in a developing country. Malays Orthop J. 5(1):13–16.
- Schwartz MH, Rozumalski A, Truong W, Novacheck TF. 2013. Predicting the outcome of intramuscular psoas lengthening in children with cerebral palsy using preoperative gait data and the random forest algorithm. Gait Posture. 37(4):473–479.
- Shen X, Gong X, Cai Y, Guo Y, Tu J, Li H, Zhang T, Wang J, Xue F, Zhu ZJ. 2016. Normalization and integration of large-scale metabolomics data using support vector regression. Metabolomics. 12(5):89.
- Staheli LT. 2008. Fundamentals of pediatric orthopedics. Philadelphia, United States: Lippincott Williams & Wilkins.
- Stefanovic P, Kurasova O. 2011. Visual analysis of self-organizing maps. Nonlinear Anal Model Control. 16(4):488–504.
- Tseng WJ, Hung LW, Shieh JS, Abbod MF, Lin J. 2013. Hip fracture risk assessment: artificial neural network outperforms conditional logistic regression in an age- and sex-matched case control study. BMC Musculoskelet Disord. 14(1):207.
- Umadevi N, Geethalakshmi SN. 2012. Multiple classification system for fracture detection in human bone x-ray images. In: Computing Communication & Networking Technologies (ICCCNT). p. 1–8. IEE.
- Vapnik V, Golowich SE, Smola AJ. 1997. Support vector method for function approximation, regression estimation and signal processing. In: Advances in Neural Information Processing Systems. p. 281–287.
- Vittinghoff E, Glidden DV, Shiboski SC, McCulloch CE. 2011. Linear, logistic, survival, and repeated measures models. In: Regression methods in biostatistics: linear, logistic, survival, and repeated measures models. Verlag: Springer; p. 340.
- Wu, H.-Y., Gong, C.-S. A.-P., Chang, K.-Y., Tsou, M.-Y., & Ting, C.-K. (2016). Predicting postoperative vomiting among orthopedic patients receiving patient-controlled epidural analgesia using SVM and LR. Sci Rep, 6:1–8.