?Mathematical formulae have been encoded as MathML and are displayed in this HTML version using MathJax in order to improve their display. Uncheck the box to turn MathJax off. This feature requires Javascript. Click on a formula to zoom.
Abstract
Malnutrition among children remains a challenge to public health in Africa, and it is responsible for the increased infant mortality rate in Ethiopia. This study aims to identify the joint determinant factors of malnutrition among under-age five children in Ethiopia and quantify the regional prevalence across the country. A Bayesian hierarchical linear mixed model, with a bivariate conditional autoregressive model, was adopted to account for the joint spatial prevalence pattern of malnutrition among under-age five children in Ethiopia. The data were provided by the Demography and Health Surveys program. The study revealed that gender, wealth index, mothers' education, toilet system, fever, birth order, birth interval, contraceptive use, and diarrhea, are significant risk factors of child malnutrition. The three malnutrition indicators are most prevalent in the Afar region, while stunting and underweight are most prevalent in Amhara, Beneshangul Gumuz, and Tigray, and the wasting and underweight are most prevalent in the Gambela and Somali. Findings revealed that a stunted child is more likely to be underweight than being wasted, and a wasted child is more likely to be underweight than being stunted. The findings also revealed significant changes in the prevalence of malnutrition for different mothers and children age groups. For cost-effective malnutrition intervention, programs for parents, such as awareness creation about the modern types of contraceptives, appropriate birth spacing, the benefits of antenatal and postnatal care, for example, are a propitious method to mitigate malnutrition in high prevalent regions than direct intervention to the children.
Abbreviations: BICAR, Bivariate Conditional Autoregressive; DHS, Demographic and Health Survey; EDHS, Ethiopia Demographic and Health Survey; EA, Enumeration Area; GMRF, Gaussian Markov Random Field; HAZ, Height for Age Z-sscore; INLA, Integrated Nexted Laplace Approximation; MCAR, Multivariate Conditional Autoregressive; MCMC, Markov Chain Monte Carlo; SNNPR, Southern Nations, Nationalities, and People's Region; WAZ, Weight for Age Z-score; WHZ, Weight for Height Z-score; WHO, World Health Organization
Introduction
Malnutrition among children remains a challenge to public health in sub-Saharan Africa countries. The rationale is that childhood malnutrition makes children more susceptible to illness due to the weakened immune system caused by malnutrition. Such illnesses include malaria, measles, anemia, and acute respiratory infections (França et al. Citation2009; Walson and Berkley Citation2018). For this reason, children suffer negative consequences throughout their lifespan, resulting in shorter height, school dropout, reduced adult income, and decreased offspring birth weight (Victora et al. Citation2008; Magalhaes and Clements Citation2011).
Malnutrition among children is classified into stunting, wasting, and underweight, which are calculated by the weight, height, and age indexes of children. Specifically, as stated by WHO et al. (Citation2013), children are stunted if their height-for-age z-score (HAZ) is lesser than negative-two standard deviations () from the World Health Organization (WHO) Child Growth Standards (WCGSM) median. Underweight occur if weight-for-age z-score (WAZ) is lesser than
from the reference median, while wasting occur if the weight-for-height z-score (WHZ) is lesser than
from the reference median.
In the 2018 UNICEF et al. (Citation2018) report, 149 million children below five years were classified as stunted, which represented an immense number that did not reach expected genetic heights. Statistics revealed that there were 50 million wasted and 40 million underweight children worldwide. Among Eastern and Southern African children under age five, 29 million were stunted, 5.40 million were wasted, and 3.60 million were underweight. Between the years 2000 and 2018, the prevalence in East Africa dropped from 45.5% to 35.2% for stunting and from 7.1% to 2.2 % for wasting. Despite there being evidence of these prevalence declines in East Africa, Ethiopia is still classified among high burden countries (WHO et al. Citation2020). According to UNICEF et al. (Citation2018), Ethiopia had a 14% decline in stunting, 5% decline in wasting, and 12% decline in underweight between the years 2005 and 2019. Despite these improvements, the prevalence level is high in comparison with WHO thresholds (WHO et al. Citation2020).
Several kinds of research have been undertaken for decades to understand better the spatial distribution of undernutrition among under-age five children in highly prevalent sub-Saharan African regions. Kandala et al. (Citation2011) used a geo-additive semi-parametric mixed model to measure the spatial distributions of childhood malnutrition in the Democratic Republic of Congo (DRC). Their findings emphasized the importance of accounting for spatial heterogeneity in malnutrition studies. Khatab (Citation2010) adopted Geoadditive models to determine the risk factors of childhood malnutrition in Egypt. Unlike most studies in the developing countries, the authors found that maternal education had little impact on the prevalence of stunting and wasting. Adeyemi et al. (Citation2019) adopted a generalized model to assess the combined spatial distributions of anemia and malnutrition among children in Burkina Faso and Mozambique. The authors found that there is evidence of the comorbidity of anemia and malnutrition. Gayawan et al. (Citation2019) used Bayesian quantile regression to determine the spatial patterns of undernutrition quantiles among under-five children in Nigeria. Recently, Egbon et al. (Citation2021a) used a generalized linear mixed model to quantify the effect of Carbon (IV) Oxide concentration on undernutrition among under-five children in Nigeria. Their finding showed a high correlation of concentration to a higher risk of undernutrition in Nigeria. The aforementioned studies identified similar risk factors that amplify the prevalence of malnutrition among children. These include maternal education, age, and body mass index, household wealth quantile, child gender and age, area of residence, among others.
In Ethiopia, studies to better understand the risk factors and spatial distributions of undernutrition among children have attracted many researchers recently. For example, Zewdie and Abebaw (Citation2013) applied logistic regression to examine the key factors of childhood undernutrition in Eastern Hararghe zone, Oromia, and found that farm size and morbidity incidence are among the key risk factors strengthening the prevalence of malnutrition in the study region. Takele and Taye (Citation2014) utilized a semi-parametric model within a Bayesian framework to determine the risk factors of undernutrition in the country, and Gelu et al. (Citation2018) conducted a cross-sectional study and adopted bivariate and multivariate logistic models to determine the risk factors of undernutrition among children in slum areas of Gondar city, northwest Ethiopia. The mentioned studies identified similar demographic and socioeconomic risk factors of malnutrition, such as maternal education and age, household wealth quantile, child gender and age, father's education status, diarrhea, fever, paternal household resource control. Further, Hagos et al. (Citation2017) identified spatial clustering in Meskane Mareko District, Ethiopia, and explore the impact of socioeconomic and demographic factors on the prevalence of stunting using multilevel logistic regression. In a different study, Hailu et al. (Citation2020) investigated the presence of spatial clustering and adopted a multilevel logistic regression to identify risk factors and spatial areas with elevated prevalence of stunting in Ethiopia. In both studies, the authors found evidence of spatial clustering and significant risk factors, which include maternal education, child age, anemia status, multiple births, maternal undernutrition, and household food security. Shebeshi and Asfaw (Citation2020) studied the importance of location to under-five malnutrition in Ethiopia. The authors utilized a quantile interval model to determine the factors causing undernutrition. Takele et al. (Citation2020) adopted a multivariate logistic model to explain the combined spatial effect of malnutrition indicators and found similar risk factors. Egbon et al. (Citation2021b) investigated the risk factors of malnutrition and anemia concurrence using a Bayesian hierarchical linear mixed model, with stochastic partial differential equations. The authors found that under-five children below 20 months are more vulnerable to concurrence.
Findings have shown that there is a concurrence of stunting, wasting, and underweight among under age five children (Khara et al. Citation2018). However, previous studies failed to account for the spatial concurrence of the classes of malnutrition in Ethiopia. Beside Takele et al. (Citation2020), the studies reviewed for Ethiopia focused on the modeling of a single malnutrition indicator, and contributes little or no information for the understanding of concurrence of malnutrition indicators. Although there is evidence in the literature that revealed an excess risk of underage five mortality due to concurrence of stunting, wasting, and underweight (McDonald et al. Citation2013), the factors responsible for this state of ailment among under age five children are poorly understood. It is not clear whether there is a direct causal relationship among malnutrition indicators or that the concurrence prevalence varies across regions and clusters. Thus, an adequate statistical methodology must be adopted, especially in Ethiopia with a limited study on the concurrence of malnutrition indicators. Moreover, it is known that observed information is underutilized when subjected to discretization, as the one conducted by Takele et al. (Citation2020) who discretized malnutrition outcome variables, to suit a predefined modeling framework. Such inference could be improved by allowing the outcome variable to decide the most appropriate model to harness its content to determine the unknown process generating the data. In this regard, this study incorporated joint modeling of malnutrition by accounting for all uncertainty in the observed data.
This study aims to determine risk factors of malnutrition prevalence among under-five children in Ethiopia and quantify the joint regional prevalence and its concurrence across the country using a Bayesian hierarchical linear mixed model, jointly accounting for the spatial heterogeneity. It is essential to understand the spatial distribution of the concurrence of malnutrition to identify the most susceptible regions and their consequential health impact on public health for sustainable development. Spatial contiguity is an essential ingredient to incorporate regional heterogeneity into the model, such that, closer regions share similar malnutrition risk compared to farther ones. The spatial contiguity is incorporated into a hierarchical model using a random field model. This study adopted a Bivariate Gaussian Markov random field in the form of a Bivariate Intrinsic Conditional Autoregressive (BICAR) model to enable the pairwise estimation of the conditional spatial correlation between malnutrition indicators, such as stunting and underweight (HAZ and WAZ), stunting and wasting (HAZ and WHZ), and underweight and wasting (WAZ and WHZ). It provides a flexible framework to account for the joint spatial distribution between two latent Gaussian fields. Moreover, the probability of high malnutrition prevalence was estimated.
The remaining sections are organized as follows. Section Materials and method discusses the sampling scheme of the data set, study area, the statistical model adopted, and the estimation procedure. The results of analysis is presented in Section Results, while Section Discussion discuss the findings. The conclusion is in Section Conclusion.
Materials and method
Study area and data collection
The study scope is the administrative division of Ethiopia, with longitude 00 E and latitude
N, in the eastern part of Africa. Figure represents the 11 administrative division of Ethiopia.The data used in this study were provided and granted access by Demography and Health Surveys (DHS) program upon request. Specifically, Ethiopia Demography and Health Service Program EDHS (Citation2016) data provide valuable information about the structure of populations and health indicators over time. The sampling scope was the enumeration areas (EAs) prepared for the country's Census. The survey was designed to provide valuable information about key health and demographic indicators at the country and regional levels. For administrative purposes, Ethiopia has nine regions and two administrative cities, adding up to 11 regions (Figure ).
Figure 1. Map of Ethiopia.
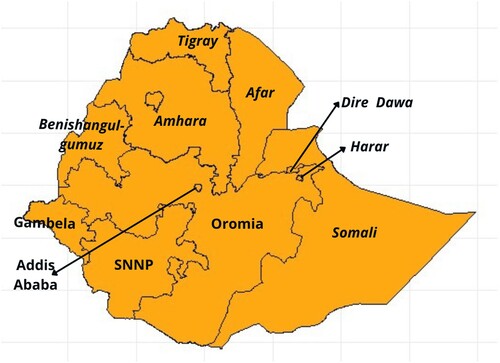
A two-stage cluster design sampling scheme was utilized. At first stage, 645 (202-urban, 443-rural) EA were selected with sampling probability proportionate to EA size. In the second stage, a systematic sampling with equal probability was adopted to select 28 households in each EA.
In all, 18,008 (5659 from urban and 12,349 from rural) households were selected, of which, 16,650 households were interviewed. That is 5232 from urban and 11,418 from rural settlements with 98% of response rate. All women aged 15–45 present in the household at the enumeration time were eligible for interview. In total, data for 11,144 (1219 from urban and 9925 from rural) women were observed, which amount to 95% response rate EDHS (Citation2016). After data cleaning, the total number of underage five children included in the study is 8940.
The covariates included in this study were chosen based on the global burden of disease and risk factors for children (Lopez et al. Citation2006). The choices were guided by the previous studies (Hailu et al. Citation2020; Shebeshi and Asfaw Citation2020; Takele et al. Citation2020) and the outcome variables of interest considered were the malnutrition indicators: HAZ, WAZ, and WHZ, which, respectively, measures stunting, underweight, and wasting.
Table presents all the dependent and independent variables considered in this study.
Table 1. Study variables.
Statistical method
The aim is to quantify the regional prevalence of malnutrition and identify the factors causing slow recovery while accounting for the joint spatial correlation between two anthropocentric indicators. The generalized hierarchical joint spatial model is a powerful statistical tool that accounts for the joint spatial heterogeneity of malnutrition indicators through a Gaussian Random Field (GRF).
Suppose that and
is a bivariate standardised malnutrition indicators
, and
of a child in region i, assuming a Gaussian bivariate distribution with mean
and a constant covariance matrix
, where
is the expected value of a child's malnutrition indicator in region i,
is an identity matrix,
,
, and
. The interest is to account for the factors determining
through a bi-generalized additive linear mixed model given as
(1)
(1) where
is the column vector of a
design matrix
,
is a
fixed effect vector,
is a
sparse column vector whose only qth entry is 1 if the current child in question is from cluster q in region i,
is an
vector of cluster-specific random intercept,
is a nonlinear function of kth random effect modeled in a nonlinear form, and
is the spatial random effect of region i for indicator s, to account for spatial heterogeneity. Equation (Equation1
(1)
(1) ) can be re-written in vector form of the model effects, given as
(2)
(2) where
,
, and
. Specification (Equation2
(2)
(2) ) will be independent, as in the case of modeling single malnutrition indicators if we assume that all the effects are independent. In this analysis, we relaxed the assumption that the spatial heterogeneity of malnutrition indicators is independent and considered cases where they are spatially correlated. In the Bayesian perspective, every parameter is assumed to be random, and thus, is assigned a prior distribution. The priors could be non-informative, objective, or it can be elicited from expert opinion, or data in the form of power prior (Ibrahim et al. Citation2014; Louzada et al. Citation2021). The bayesian spatial framework provides the possibility to incorporate regional heterogeneity into the model, such that close regions share similar properties compared to farther regions. The regional dependency structure is incorporated into the model through the prior distribution assigned on the spatial effect
.
Let , for
be a GRF of malnutrition indicator s with positive definite precision matrix
corresponding to a graph
, where
is a set of the edges connecting the regions, and
is a set of the nodes, each denotes the eleven administrative regions in the country. For computational speed,
is considered to be sparse. Let
be an
matrix such that
if node i and j are neighbors and
otherwise, and diagonal matrix
with entries equals to the numbers of neighbors for each nodes. Therefore,
(3)
(3) where
is the precision associated to indicator s. Note that by this specification,
is sparse, consequently
is said to be a Gaussian Markov Random Field (GMRF) according to
, such that
is independent of
given
(
) if and only if the edge
, where
indicates
excluding nodes i and j. Further, define
, where
and
are considered correlated GMRF with respect to
, and define
as
(4)
(4) Here, ρ is the correlation coefficient that measures the strength and direction of the relationship between the GMRFs. The precision and <roman > log < /roman > prior distribution on
is then given respectively as
(5)
(5) The above specification is a Bivariate Conditional Autoregressive (BCAR) model, which is a special case of the Multivariate Conditional Autoregressive MCAR (Ippoliti et al. Citation2015; Palmi-Perales et al. Citation2019). The precision matrix
is assigned a Wishart prior distribution with r degrees of freedom and a fixed
positive definite matrix
.
A second-order random walk (RW2) prior was assigned for the nonlinear effects on child's and mother's age. Let , where
is the model effect on the knot t of the nonlinear function
. Assuming independent second-order increment and Gaussian error, then
and thus, the distribution of
follows as
(6)
(6) Here
accounts for the effect of child's age, and
accounts for the effects of mother's age among under age five malnutrition.
Equation (Equation6(6)
(6) ) is equivalent to the one given by Lindgren and Rue (Citation2008) for a regularly ordered label t. The child's age was ordered at regular intervals from month 0 to 59, likewise the mother's age between 15 and 49 years. In each case,
for child's age, and
for mother's age. Thus,
is the effect at knot t. The RW2 model is flexible due to its invariant property under addition, and also computationally convenient since it exhibits the Markov property (Lindgren and Rue Citation2008). The prior (Equation6
(6)
(6) ) is proportional to a normal distribution, which facilitates sampling from the posterior distribution during computation. An independent and identically distributed Gaussian prior, centered at zero with a variance
was assigned to each component of
. A multivariate Gaussian prior was assumed for
, and an Gamma hyper-prior was assigned for the precision parameter,
. The Penalizing Complexity (PC) prior was assigned for
, with parameters
,
, such that
and the distribution follows as
(7)
(7) where
. The same prior is also assigned for
with similar parameterization.
The joint posterior distribution of the parameters of interest is expressed as
(8)
(8) where
.
Estimation
Different estimation procedures exist in the literature, and the most commonly used method is the Markov Chain Monte Carlo (MCMC) algorithm. However, this study utilized the Integrated Nested Laplace Approximation (INLA) package in the R (R Core Team Citation2019) through the INLAMSM (Palmi-Perales et al. Citation2019) package to estimate the parameters of interest. Unlike the MCMC approach, INLA estimates the posterior marginal distributions rather than the joint posterior distribution. It has been shown in simulation studies that the INLA performs considerably faster than the MCMC estimation procedure, and efficiently manages computation of GMRF precision matrix. The hyperparameters used the for the Pc-priors are , and
, and INLA default priors were assigned for the hyperparameter of Λ, and a default prior for the remaining hyperparameters,
and
. The INLA estimation procedure can be found in Ruiz-Cárdenas et al. (Citation2012), Martins et al. (Citation2013), Blangiardo et al. (Citation2013), Palmi-Perales et al. (Citation2019), Egbon et al. (Citation2021a).
The spatial-specific posterior probability, in which low values of the estimate is associated with high prevalence of malnutrition for each region, compared with the whole country was obtained from the spatial effect posterior marginal density, which follows as,
(9)
(9) where
is the posterior marginal distribution of region i for indicator s. The threshold 0 was used since it is considered as the country global average of malnutrition. Regions with high probability indicates high prevalence, and consequently high risk of malnutrition. The approximation of (Equation9
(9)
(9) ) can be obtained using a Monte Carlo integration by computing the expected value
that is
(10)
(10) where
are random draws from the posterior marginal distribution of spatial effect
, and
is an indicator function.
Results
This section presents the results of the bivariate model described in Section Materials and method. That is, the bivariate model of stunting and underweight, stunting and wasting, and underweight and wasting. An independent single analysis of malnutrition indicators was also conducted using a univariate CAR model, and the results are presented in the Appendix. Note that low estimated coefficients of the risk factors indicate that such risk factors exacerbate the prevalence of malnutrition. That is, the lower the expected value of the coefficients, the lower the predicted values of HAZ, WAZ, and WHZ. We used the word ‘prevalence’ here to denote the risk factor's impact on the fraction of children whose predicted values of HAZ, WAZ, and WHZ scores are less than . The inclusion and non-inclusion of 0 in the confidence intervals were used to determine the significance of the estimated effects. The estimated spatial conditional correlation of stunting and underweight is
, stunting and wasting is
, and wasting and underweight is
. Findings indicate that stunting and wasting are correlated positively with underweight, and whereas, they are negatively correlated together.
Fixed effect
Table presents the estimates of the fixed effects for each bivariate model. The first panel contains the results of the bivariate estimates of stunting and underweight, the second panel contains the bivariate estimates of stunting and wasting, and the third panel contains the bivariate estimates of underweight and wasting.
Table 2. The fixed effect estimates of the bivariate model.
In the first panel, stunting and underweight are significantly more prevalent among male children compared to their female counterparts. Likewise for stunting and wasting, and underweight and wasting in the second and third panels. Concerning the children whose mothers have no education, the prevalence of both stunting and underweight decreases for children whose mothers' attained primary, secondary and higher education level. Similar results were obtained for stunting and wasting and underweight and wasting. It means that children whose mothers' education level is at least primary are less likely to be malnourished compared with children whose mothers have no formal education. These findings indicate that educated mothers are more likely to grow healthier children than uneducated ones since they are more likely to give children fortified food and seek expert opinions. Turning attention to the household wealth index, children whose family has at least a middle wealth index are significantly less prevalent in stunting and underweight compared with the poorest families. Likewise for stunting and wasting and underweight and wasting. Similar to the univariate case (Appendix 2, Table ), the malnutrition prevalence significantly declines for middle, richer, and richest. Nevertheless, family wealth is inversely related to the prevalence of malnutrition. That is, it is more likely that a child is malnourished in lower-income families than in higher-income families. The effect of the toilet system reveals that the prevalence of stunting and underweight decreases in the presence of an improved toilet system. The same occurs in stunting and wasting, and underweight and wasting. The number of children under five years in the household does not significantly contribute to malnutrition. However, as the birth order increases, the joint prevalence of stunting and underweight significantly increases, and likewise for stunting and wasting, and underweight and wasting. This implies that mothers or caregivers diminish the attention given to their children as they give births to more children. Prevalence of stunting and underweight among children with two years and above birth interval is significantly less likely. Similarly for stunting and wasting, and underweight and wasting. The frequency of visits to antenatal and postnatal care services significantly decreases the joint prevalence of stunting and underweight, stunting and wasting, but not underweight and wasting. A modern type of contraceptive used significantly lowers the joint prevalence of stunting and underweight, stunting and wasting, and underweight and wasting compared to no use of contraceptive, whereas, the traditional type is not significantly different from no use of contraceptive. The prevalence of malnutrition across settlement types is not significant. Prevalence of stunting and underweight among children whose mothers listen to mass media are significantly less likely compared to those mothers who do not listen to mass media. A child having diarrhea, fever is significantly more likely to be stunting and underweight, stunting and wasting and underweight and wasting. That is, children having any of these ailments increases the risk of malnutrition. These results show that episodes of diarrhea and fever are detrimental to child growth.
Spatial effect
The spatial effect estimated from the BCAR model is shown in Table , which contains three panels, where each panel is further divided into top and bottom, showing marginal estimates of one of the two anthropometric variables jointly modeled. Moreover, the left panel contains the marginal results of stunting from the joint modeling of stunting and underweight (top) and stunting and wasting (bottom). The middle panel contains the marginal results of wasting from the joint modeling of stunting and wasting (top) and underweight and wasting (bottom). Further, the right panel contains the marginal results of underweight from the joint modeling of stunting and underweight (top) and of underweight and wasting (bottom). Figure presents the probability of excess prevalence across the regions. This was calculated using samples drawn from the corresponding posterior distribution to evaluate Equation (Equation10(10)
(10) ) for each region.
Figure 2. The probability of excess prevalence of (a) stunting in the presence of underweight, (b) wasting in the presence of stunting, (c) underweight in the presence of stunting, (d) stunting in the presence of wasting, (e) wasting in the presence of underweight, and (f) underweight in the presence of wasting. High probability value signifies strong evidence of malnutrition prevalence that exceeds the country's average prevalence, and consequently, increase in susceptibility of children in the region. (a) Stunting, (b) Wasting
, (c) Underweight
, (d) Stunting
, (e) Wasting
and (f) Underweight
.
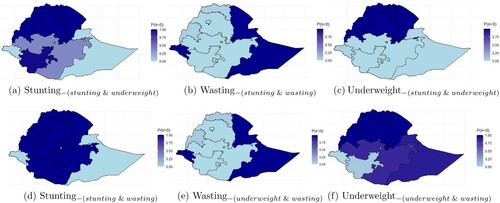
Table 3. Spatial effect estimated from the BCAR model.
From the top first panel, region Amhara and Beneshangul-Gumuz are the highest prevalent regions of stunting, in the presence of underweight, compared to the whole country. These are followed orderly by the regions Tigray, and Afar. This conclusion is evident in the probability plot in Figure (a). The black-colored regions are those regions with the highest probability of stunting in the presence of underweight. The results indicate that children who reside in these regions are more likely to be stunted in the presence of underweight compared to the whole country. However, the prevalence at Dire Dawa, Harari, Oromia and SNNPR is not significant. Addis Ababa, Gambela, and Somali are the regions with a lesser prevalence of stunting in the presence of underweight. Turning attention to the bottom first panel, the prevalence of stunting in the existence of wasting increased for Afar, Amhara, Beneshangul-Gumuz, Oromia, Tigray, and SNNPR compared to stunting in the presence of underweight (top panel). This result is evident in the probability plot in Figure (d), where these listed regions represent the black-colored regions, which are the regions with the highest probabilities of stunting in the presence of wasting. Observed that Oromia and SNNPR regions attained significance in contrast to the results of stunting in the existence of underweight. It implies that under-five children residing in these regions are more likely to be stunted in the presence of wasting compared to the presence of underweight.
From the top middle panel, Dire Dawa has the highest prevalence of wasting in the presence of stunting. Dire Dawa is followed orderly by Addis Ababa, Afar, Gambela, and Somali. These regions are represented in black color in the probability plot, indicating the regions with higher probabilities of wasting in the presence of stunting (Figure (b)). The prevalence of wasting in the presence of stunting in Harari, Beneshangul-Gumuz, and Tigray regions is not significant. They represent the grey portion in Figure (b), which indicates moderate prevalent probability. However, Addis Ababa, Amhara, Oromia, and SNNPR are regions with a lesser prevalence of wasting in the presence of stunting. Turning attention to the bottom of the middle panel, a similar prevalence pattern was obtained for wasting in the presence of underweight and in the presence of stunting. However, the prevalence of wasting in the presence of underweight increases for Somali, Afar, Amhara, Oromia, and SNNPR and decreases for Dire Dawa and Gambela compared to the prevalence of wasting in the presence of stunting. Moreover, Dire Dawa has the highest prevalence of wasting in the presence of underweight. It is followed orderly by Afar, Somali, and Gambela, representing the black-colored regions in the probability plot (Figure (e)), which indicates high probabilities of wasting in the presence of underweight. Similarly, the prevalence of wasting in the presence of underweight is not significant in Harari, Beneshangul-Gumuz, and Tigray regions.
From the top right panel, Afar has the highest prevalence of a child being underweight in the presence of stunting. Afar is followed orderly by Amhara, Dire Dawa, Beneshamgul-Gumuz, and Tigray. These regions are represented in black color (Figure (c)), which indicates the high prevalent regions of underweight in the presence of stunting. However, Addis Ababa, Gambela, Oromia, Somali, and SNNPR are regions with the lowest prevalence of underweight in the presence of stunting. Moreover, Harari are not significantly different from the country's average prevalence, and these regions are represented in grey in Figure (c). Turning attention to the bottom right panel, the prevalence of underweight in the presence of wasting further increased for Afar, Amhara, Beneshamgul-Gumuz, and Tigray, compared to the presence of stunting. These regions are represented bythe black-colored portion of Figure (f). This implies that children with wasting are more likely to be underweight compared to children with stunting. Moreover, the prevalence further decreased for Addis Ababa, Harari, Gambela, and Dire Dawa, which represent the lightest regions. This indicates that children residing in these regions are less likely to be underweight in the presence of wasting compared to the presence of stunting.
These results indicate that the prevalence of stunting in the presence of wasting and the prevalence of wasting in the presence of stunting is not equivalent across Ethiopian regions. Likewise for stunting and underweight, underweight and stunting, wasting and underweight and underweight and wasting across the country. Compared to the univariate models (Appendix 2, Figure ), the bivariate model revealed high-prevalent regions that are ordinarily hidden in the univariate case, and thus, introducing a type two error when investigated in a univariate case. Regions where stunting is prevalent, wasting is not, and verse versa Figure (a,b,d,e). That is, the spatial relationship between stunting and wasting, concerning the Ethiopian graph is inversely proportionate. This characteristic was inherited from the univariate case. However, the prevalence of underweight partially shares high-prevalent regions between stunting and wasting.
Nonlinear effect
Figure presents the relative change in the prevalence of malnutrition for different mothers and children age groups. Figure (a–c) is the joint prevalence of malnutrition to a child's age group, while Figure (d,e) is the joint prevalence of malnutrition indicators to mothers' age group. Figure (a) presents the prevalence of stunting and underweight, Figure (b) presents the prevalence of stunting and wasting, while Figure (c) presents the prevalence of wasting and underweight according to a child's age distribution. Figure (d) presents the prevalence of stunting and underweight, Figure (e) presents the prevalence of stunting and wasting, while Figure (f) presents the prevalence of wasting and underweight according to a mother's age distribution. It is important to note that the lower the posterior estimate, the higher the prevalence, since, lower malnutrition indicator score indicates the severity of malnutrition.
Figure 3. The relative change in the prevalence of (a) stunting and underweight, (b) stunting and wasting, (c) wasting and underweight with respect to a child's age, and (d) stunting and underweight, (e) stunting and wasting, (f) wasting and underweight with respect to a mothers' age. A declining curve signifies increasing prevalence, and a rising curve signifies a lowering prevalence.
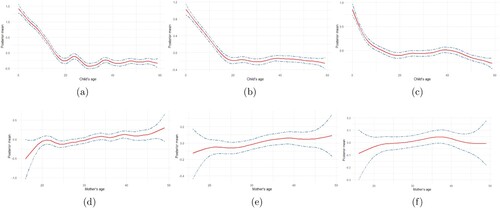
The joint prevalence of stunting and underweight increases consistently until a child attains age 20 months, where it decreases shortly for an additional three months. The prevalence further increased until age 33 months, and then decrease shortly between age 33 months and 40 months, and nearly remain constant afterward until age 59 months (Figure (a)). Compared to the univariate analysis of stunting and underweight, the joint prevalence of stunting and underweight appears more like the prevalence of stunting (Appendix 2, Figure ). This indicates that a child is more likely to be stunted and underweight with age. Moreover, in Figure (b), the prevalence of stunting and wasting increases in a similar way as that of stunting and underweight. The prevalence increases consistently from age 0 to age 20 months and further decreases and increases slightly until age 30 months and then decreases and levels off until age 59 months. In Figure (c), the prevalence of wasting and underweight increases gradually until age 30 months, and then maintains a constant pattern until age 40, which then increases gradually until age 59 months. The prevalence pattern of malnutrition to age is as expected because children are more exposed to poor environmental conditions as they grow older.
Considering mothers age, the prevalence of stunting and underweight decreases as the mother's age increases until age 22 years, then increase slowly until age 25, and gradually decreases until age 49 (Figure (d)). A similar shape was obtained for the joint prevalence of stunting and wasting (Figure (e)), and wasting and underweight (Figure (f)). It implies that children are less likely to be malnourished as mothers get older. The prevalent curve is as expected because, as the mothers grow older, their parental care improves due to gathered experience, maternal or formal education attainment.
The estimates of cluster-specific random effects for 635 clusters across the country, grouped by regions, are presented in Appendix 1. Each Figure contains 11 panels. The total number of clusters adopted for each region are as follows: Addis Ababa (55), Afar (53), Amhara (71), Beneshangul Gumuz (49), Dire Dawa (43), Gambela (49), Harari (41), Oromia (73), SNNPR (71), Somali (67), Tigray (63). The Oromia region had the highest number of clusters, whereas, Harari had the least number of clusters. Figure presents the cluster-specific random effects of stunting and underweight. The result shows that there are cluster variations within the regions. While the prevalence of stunting and underweight is high for some clusters within a specific region, others are moderate and less prevalent. A similar pattern is also shown for stunting and wasting (Figure ), and wasting and underweight (Figure ).
Discussion
This study used a Bayesian hierarchical linear mixed model to determine the key factors causing malnutrition among children under age five in Ethiopia. This method was employed to determine the joint regional prevalence and its concurrence across the country. A bivariate intrinsic conditional autoregressive model was adopted to measure the joint spatial prevalence of malnutrition across Ethiopia. Findings reveal that place of residence, mothers' educational status, child gender, family wealth index, mother and child age, presence of diarrhea, fever, coughs, breastfeeding, and toilet type are significant risk factors of malnutrition.
Mothers' education level significantly determines whether a child is malnourished, implying that children whose mothers attain higher education are less likely to suffer from malnutrition. This finding conform with one reported in Ethiopia (Darsene et al. Citation2017; Shebeshi and Asfaw Citation2020; Takele et al. Citation2020) and other developing countries such as Nigeria (Gayawan et al. Citation2019), Democratic Republic of the Congo Kandala et al. (Citation2011) and Bangladesh (Islam et al. Citation2013). However, based on UNICEF reports in 2018, only 53% of Ethiopia women complete primary education and only 25% of the aged girls attend up to secondary school, which consequentially accumulate to a high rate of uneducated mothers (UNICEF Ethiopia Citation2018). Culturally, not until recently, most ethnic groups in Ethiopia believe that women are for household activities, and as such, they engage in farming, household chores, and early marriage. A positive step to achieve sustainable development goal is to promote formal and informal maternal education, especially in the rural region of the country.
Further, children whose family wealth index is low are more likely to suffer concurrence of malnutrition. This may be a result of the poverty level and food insecurity, where children are denied adequate diet due to insufficient family income. On contrary, the wealthy family is more likely to provide fortified nutritious intake for their children, which helps the body and mental development and prevention of malnutrition (Yadav et al. Citation2015).
Male children are more likely to be malnourished compared with female children. This finding confirms the biological result that male children are more exposed to ailments compared with female children (Costa et al. Citation2017; Egbon et al. Citation2021b). This could also be attributed to attitude of parents or caregivers towards male children. For instance, parents wrongly assume that by nature, male children are more immune than their female counterparts. This assumption could consequently lead to exposure of male children to environmental contaminants causing malnutrition. This finding is consistent with study conducted in Ethiopia (Darsene et al. Citation2017), Nigeria (Gayawan et al. Citation2019), and Bangladesh (Islam et al. Citation2013). On contrary, a study conducted in Tanzania (Mbago and Namfua Citation1992), and Kenya (Gewa and Yandell Citation2012) reported that female children are more malnourished compared to male children.
Finding also revealed that diarrhea and fever significantly contributes to the concurrence of stunting, wasting and underweight among children, preventing rapid recovery and causing child mortality. Episodes of diarrhea, majorly caused by poor hydration hygiene among children and could weaken their immune system. This fragility creates room for infections and diseases that escalates concurrences of malnutrition. These findings coincide with previous studies in Nigeria (Gayawan et al. Citation2019) and Kenya (Gewa and Yandell Citation2012). Findings indicate that children under breastfeeding are more likely to suffer from joint occurrences of malnutrition. This finding is contrary to scientific knowledge that breastfeeds milk supplies adequate nutrients for child development (Motee and Jeewon Citation2014). This could be the causality effect, where mothers engage in prolong breastfeeding to make better the health of malnourished children (Gewa and Yandell Citation2012). As expected, unimproved toilet system such as pit toilets, open deification in household backyards, woods, and streams significantly increases the prevalence of the concurrence of malnutrition. These practices expose children to common infections and diseases and preventing recovery. This finding is consistent with the results obtained in Ethiopia (Takele et al. Citation2020) and Egypt (Khatab Citation2010) and contrary to the study reported in Nigeria (Egbon et al. Citation2021a), where the toilet system was not significant. Place of residence and the attitude of mothers and caregivers not listening to any form of mass media are not significant. This implies that children whose family resides in rural and urban are faced with similar risk of malnutrition. Findings revealed that the higher the birth order the higher the prevalence of malnutrition. This could be associated with strain on family resources (Horton Citation1988). Similarly, birth interval, contraceptive use, antenatal, postnatal care service, and mass media significantly influence child malnutrition. That is, low birth spacing, low frequency of antenatal and postnatal care service, use of no contraceptive or traditional contraceptive and no mass media significantly increases the prevalence of malnutrition.
As expected, an increase in child's age significantly contributes to the concurrence of malnutrition in children. It implies, younger children are less likely to be malnourished compared with older ones. It could be attributed to inappropriate feeding practices and insufficient nutritional content in solid food as they grow older (Hall et al. Citation2020). It could also be a consequence of children's exposure to environmental risk factors, such as ambient and household pollution, infections, airborne diseases, and more (Sinharoy et al. Citation2020). The extent of a child's exposure to environmental factors increases with age, and the mother's or caregiver's control over the children decreases, placing them at a higher risk of malnutrition. The concurrence prevalence of child malnutrition decreases with an increase in maternal age. It is expected that older-age mothers are more experienced in child caregiving than younger-aged mothers. That is, mothers at higher ages have gained more experience compared with younger ones. This result coincides with the study conducted in Ghana (Wemakor et al. Citation2018).
Findings revealed that the concurrences of malnutrition indicators vary across regions in the country. This may be due to variation in cultural practices and ethnic structure, variation in agricultural practices, religion, traditional living habits, education sector, and health facilities across the country. This regional diversity and resources are associated with the differences in the spatial distribution of malnutrition prevalence across the country.
Findings revealed that the three malnutrition indicators are most severe in the Afar region. The stunting and under-weight were consistently severe in Amhara, Beneshangul Gumuz, and Tigray, which occupy the northern part of the country. This finding is consistent with the results obtained in Ethiopia (Hagos et al. Citation2017; Takele et al. Citation2020). This could be associated with low socio-economic status in the regions. Findings show that more than 30% of inhabitants living in Tigray and Amhara are below the food poverty line (OCHA Citation2019). And around 25% of inhabitants living in Afar and Benishangul Gumuz are below the food poverty line (OCHA Citation2019). This leads children to a high degree of food deprivation. Also, this could be associated with unfavorable weather conditions for farming, inadequate water supplies, poor irrigation system, decades of locust invasion, which might have limited development gain in these regions (USAID Citation2021). It is common among Ethiopians to believe that the Oromia, SNNPR have good weather conditions and water supplies. However, the concurrence probability of stunting and being underweight is severe. This could be associated with political disruption and social unrest in the regions. For instance, the political movement (Abebe Citation2020) could affect emotional behavior in children and prevents access to health care services. Finding shows that wasting and underweight are highly prevalent in Somali (Shebeshi and Asfaw Citation2020; Takele et al. Citation2020), Dire Dawa and Gambela (Tusa et al. Citation2020) regions. This could be due to ethnic structure, traditional believes, and the living habit of household members in the regions. It is surprising that the prevalence of wasting for a stunted child in Addis Ababa is higher than the countries overall prevalence and could require a closer investigation. Other findings indicate that a relationship between stunting and underweight, wasting and underweight were spatially positive, while stunting and wasting have a negative spatial correlation. A stunted child is more likely to be underweight than being wasted, and a wasted child is more likely to be underweight than being stunted. Findings revealed cluster heterogeneity among regions in the country. While Oromia had the highest number of clusters, Harari had the least number of clusters. The differences in the cluster-specific estimates could be associated with the extent of ethnic diversity and disparity in cultural believes in these regions, which could have a considerable impact on parents' and community's perception of malnutrition among children.
An important finding revealed that the prevalent factors associated with parents and caregivers are more likely to determine the malnourished status of a child. This is obvious in the coefficients of these factors in the univariate results and similar to the multivariate results. That is, the positive impact of educating a mother from no education to secondary education is equivalent to the impact of making the poorest family wealth index to the richest category. Also, the impact of having a good toilet system is equivalent to making the poorest family wealth index to the richer category. The impact on the provision of mass media for educative purposes would generate a higher impact compared to common diseases treatment supplements. These findings are essential for building a cost-effective intervention for short and long terms programs.
Conclusion
This study identified the risk factors of the concurrences of malnutrition among Ethiopian children under the age of five. These significant risk factors were identified to be the child's gender, mother's age, mothers' educational status, family wealth index, presence of diarrhea, fever, coughs, breastfeeding, and toilet type. Findings revealed that there is a spatial correlation in the concurrence of malnutrition indicators, and identified the Afar region to have a consistently higher prevalence of all malnutrition indicators compared to other regions. Based on a clinical trial (Humphrey et al. Citation2019), improved water, sanitation, and hygiene are not significant in reducing malnutrition, and therefore, focus should be directed towards parents and caregivers. In general, cost-effective childhood malnutrition intervention programs for parents and caregivers is a propitious method to mitigate malnutrition in high prevalent regions, which should be considered with utmost priority than direct methods on the children. For example, programs that enlighten women on the modern types of contraceptives, appropriate birth spacing, the benefits of antenatal and postnatal care, and educate mothers or caregivers on the negative impacts of their food preferences in child malnutrition. It is cost-effective, in the sense that, consistent enlightenment could be cheaply conducted through telecommunication programs. The generated maps pinpointed the locations with severe malnutrition that could be adopted to design a localized-based malnutrition intervention program, a randomized clinical trial, a localized framework for public health program evaluation, and an intervention causality effect. Also, the map could be overlaid with the spatial variability maps of another indicator, such as anemia or diarrhea prevalence to allow a better understanding of the spatial distribution of these indicators in Ethiopia for effective public health interventions. This study recommends nutrition and maternal education in the interior residence of the hotspot regions, supportive health care services, and poverty alleviation programs among less privileged households in the country.
One of the main limitations of this study is the cross-sectional nature of the data, which do not allow for causal inferences. Another limitation is that the developed model did not account for sampling weight nor adjust for sampling design on variance estimates. Also, the study did not include some regional aggregate factors which are directly relevant for under-five nutritional status, including food security and nutritional program coverage, which were not captured by the survey data. Despite this, the use of a spatial and temporal analytical approach has not provided sufficient contribution to the under-five malnutrition literature.
Future research can investigate changes in undernutrition patterns over time using point estimation at smaller spatial scales or a continuous geostatistical model in Ethiopia. Also, future work could account for the impact of the sampling scheme on the variance estimates, and extend the idea developed in this work to small area estimation techniques.
Funding
No funding was received.
Acknowledgments
The authors would like to acknowledge the DHS program for granting access to the data used in this study.
Availability of data
The data utilised in this study is available publicly from the Demographic and Health Survey Program data base (EDHS) at https://www.dhsprogram.com/, reference ET_2016_DHS_02242021_1746_159735. The authors were given the permission to use the data for this study. A fraction of the cleaned and re-coded data, which is very particular to the developed model in this study, is available on http://dx.doi.org/10.17632/y33986sbyj.1.
Disclosure statement
No potential conflict of interest was reported by the author(s).
Authors' contributions
OAE conceived the study idea, AMB sourced the data, OAE performed the computation, MAB validated the model, and MAB interpreted the results. All authors participated in the manuscript writing, and AMB revised it critically for intellectual content. All authors read and accepted the final manuscript revision. All authors agree to be accountable for all aspects of the work.
References
- Abebe T. 2020. Lost futures? Educated youth precarity and protests in the Oromia region, Ethiopia. Child Geogr. 18(6):584–600.
- Adeyemi RA, Zewotir T, Ramroop S. 2019. Joint spatial mapping of childhood anemia and malnutrition in Sub-Saharan Africa: a cross-sectional study of small-scale geographical disparities. Afr Health Sci. 19(3):2692–2712.
- Blangiardo M, Cameletti M, Baio G, Rue H. 2013. Spatial and spatio-temporal models with r-inla. Spat Spatiotemporal Epidemiol. 4:33–49.
- Costa JC, da Silva ICM, Victora CG. 2017. Gender bias in under-five mortality in low/middle-income countries. BMJ Global Health. 2(2):e000350.
- Darsene H, Geleto A, Gebeyehu A, Meseret S. 2017. Magnitude and predictors of undernutrition among children aged six to fifty nine months in ethiopia: a cross sectional study. Arch Public Health. 75(1):1–11.
- EDHS. 2016. The 2016 Ethiopia demographic and health survey. https://dhsprogram.com/publications/publication-FR328-DHS-Final-Reports.cfm.
- Egbon O, Somo-Aina O, Gayawan E. 2021a. Spatial weighted analysis of malnutrition among children in nigeria: a Bayesian approach. Stat Biosci. 35(4):1–29.
- Egbon OA, Balechew AM, Bogoni MA. 2021b. Modelling spatial pattern of anemia and malnutrition co-occurrence among under-five children in Ethiopia: a Bayesian geostatistical approach. Research Square. https://doi.org/10.21203/rs.3.rs-1015108/v1.
- França T, Ishikawa L, Zorzella-Pezavento S, Chiuso-Minicucci F, da Cunha M, Sartori A. 2009. Impact of malnutrition on immunity and infection. J Venom Anim Toxins Incl Trop Dis. 15(3):374–390.
- Gayawan E, Adebayo SB, Komolafe AA, Akomolafe AA. 2019. Spatial distribution of malnutrition among children under five in Nigeria: a Bayesian quantile regression approach. Appl Spat Anal Policy. 12(2):229–254.
- Gelu A, Edris M, Derso T, Abebe Z. 2018. Undernutrition and associated factors among children aged 6–59 months living in slum areas of Gondar city, Northwest Ethiopia: a cross-sectional study. Pediatric Health Med Ther. 9:81.
- Gewa CA, Yandell N. 2012. Undernutrition among kenyan children: contribution of child, maternal and household factors. Public Health Nutr. 15(6):1029–1038.
- Hagos S, Hailemariam D, WoldeHanna T, Lindtjørn B. 2017. Spatial heterogeneity and risk factors for stunting among children under age five in Ethiopia: a Bayesian geo-statistical model. PLoS ONE. 12(2):e0170785.
- Hailu BA, Bogale GG, Beyene J. 2020. Spatial heterogeneity and factors influencing stunting and severe stunting among under-5 children in ethiopia: spatial and multilevel analysis. Sci Rep. 10(1):1–10.
- Hall J, Walton M, Van Ogtrop F, Guest D, Black K, Beardsley J. 2020. Factors influencing undernutrition among children under 5 years from cocoa-growing communities in Bougainville. BMJ Global Health. 5(8):e002478.
- Horton S. 1988. Birth order and child nutritional status: evidence from the philippines. Econ Dev Cult Change. 36(2):341–354.
- Humphrey JH, Mbuya MN, Ntozini R, Moulton LH, Stoltzfus RJ, Tavengwa NV, Mutasa K, Majo F, Mutasa B, Mangwadu G, et al. 2019. Independent and combined effects of improved water, sanitation, and hygiene, and improved complementary feeding, on child stunting and anaemia in rural Zimbabwe: a cluster-randomised trial. Lancet Glob Health. 7(1):e132–e147.
- Ibrahim JG, Chen M-H, Sinha D. 2014. Bayesian survival analysis. New York: Springer.
- Ippoliti L, Martin RJ, Romagnoli L. 2015. Multivariate car models in health care research. Procedia Environ Sci. 27:10–11.
- Islam MM, Alam M, Tariquzaman M, Kabir MA, Pervin R, Begum M, Khan MMH. 2013. Predictors of the number of under-five malnourished children in Bangladesh: application of the generalized poisson regression model. BMC Public Health. 13(1):1–8.
- Kandala N-B, Madungu TP, Emina JB, Nzita KP, Cappuccio FP. 2011. Malnutrition among children under the age of five in the democratic Republic of Congo (DRC): does geographic location matter? BMC Public Health. 11(1):1–15.
- Khara T, Mwangome M, Ngari M, Dolan C. 2018. Children concurrently wasted and stunted: a meta-analysis of prevalence data of children 6–59 months from 84 countries. Matern Child Nutr. 14(2):e12516.
- Khatab K. 2010. Childhood malnutrition in Egypt using geoadditive gaussian and latent variable models. Am J Trop Med Hyg. 82(4):653–663.
- Lindgren F, Rue H. 2008. On the second-order random walk model for irregular locations. Scand J Stat. 35(4):691–700.
- Lopez AD, Mathers CD, Ezzati M, Jamison DT, Murray CJL. 2006. Global burden of disease and risk factors. New York: Oxford University Press. 10.1596/978-0-8213-6262-4.
- Louzada F, Nascimento DC, Egbon OA. 2021. Spatial statistical models: an overview under the Bayesian approach. Axioms. 10(4):307.
- Magalhaes RJS, Clements AC. 2011. Mapping the risk of anaemia in preschool-age children: the contribution of malnutrition, Malaria, and Helminth infections in West Africa. PLoS Med. 8(6):e1000438.
- Martins TG, Simpson D, Lindgren F, Rue H. 2013. Bayesian computing with inla: new features. Comput Stat Data Anal. 67:68–83.
- Mbago MC, Namfua PP. 1992. Some determinants of nutritional status of one-to four-year-old children in low income urban areas in Tanzania. J Trop Pediatr. 38(6):299–306.
- McDonald CM, Olofin I, Flaxman S, Fawzi WW, Spiegelman D, Caulfield LE, Black RE, Ezzati M, Danaei G, Nutrition Impact Model Study. 2013. The effect of multiple anthropometric deficits on child mortality: meta-analysis of individual data in 10 prospective studies from developing countries. Am J Clin Nutr. 97(4):896–901.
- Motee A, Jeewon R. 2014. Importance of exclusive breastfeeding and complementary feeding among infants. Curr Res Nutr Food Sci J. 2(2):56–72.
- OCHA. 2019. Comprehensive food security and vulnerability analysis (CFSVA). https://reliefweb.int/report/ethiopia/ethiopia-comprehensive-food-security-and-vulnerability-analysis-cfsva-2019
- Palmi-Perales F, Gomez-Rubio V, Martinez-Beneito MA. 2019. Bayesian multivariate spatial models for lattice data with INLA. J. Stat. Softw. 98(2):1.
- R Core Team. 2019. R: a language and environment for statistical computing. R Foundation for Statistical Computing, Vienna, Austria.
- Ruiz-Cárdenas R, Krainski ET, Rue H. 2012. Direct fitting of dynamic models using integrated nested laplace approximations-inla. Comput Stat Data Anal. 56(6):1808–1828.
- Shebeshi A, Asfaw Z. 2020. Bayesian spatial quantile interval model with application to childhood malnutrition in ethiopia. Research Square. https://doi.org/10.21203/rs.3.rs-108232/v2.
- Sinharoy SS, Clasen T, Martorell R. 2020. Air pollution and stunting: a missing link? Lancet Glob Health. 8(4):e472–e475.
- Takele K, Taye A. 2014. Bayesian modelling of growth retardation among children under-five years old. Far East J Theor Stat. 48(2):87.
- Takele K, Zewotir T, Ndanguza D. 2020. Spatial joint modelling of children under-five malnutrition in ethiopia. J Hum Ecol. 70(1-3):132–142.
- Tusa BS, Weldesenbet AB, Kebede SA. 2020. Spatial distribution and associated factors of underweight in ethiopia: an analysis of ethiopian demographic and health survey, 2016. PLoS ONE. 15(12):e0242744.
- UNICEF, et al. 2018. Levels and trends in child malnutrition. eSocialSciences. Technical Report.
- UNICEF Ethiopia. 2018. Unicef fact sheet - girl's education. https://www.unicef.org/ethiopia/media/381/file/Girls.
- USAID. 2021. East Africa-desert locust crisis. https://reliefweb.int/report/ethiopia/east-africa-desert-locust-crisis-fact-sheet-4-fiscal-year-fy-2021#:∼:text=Locust%20populations%20continue%20to%20decline
- Victora CG, Adair L, Fall C, Hallal PC, Martorell R, Richter L, Sachdev HS, Maternal and Child Undernutrition Study Group. 2008. Maternal and child undernutrition: consequences for adult health and human capital. Lancet. 371(9609):340–357.
- Walson JL, Berkley JA. 2018. The impact of malnutrition on childhood infections. Curr Opin Infect Dis. 31(3):231.
- Wemakor A, Garti H, Azongo T, Garti H, Atosona A. 2018. Young maternal age is a risk factor for child undernutrition in tamale metropolis, Ghana. BMC Res Notes. 11(1):1–5.
- WHO, et al. 2013. Guideline: updates on the management of severe acute malnutrition in infants and children. World Health Organization.
- WHO, et al. 2020. UNICEF/WHO/the World Bank group joint child malnutrition estimates: levels and trends in child malnutrition: key findings of the 2020 edition. https://www.who.int/publications/i/item/9789240003576
- Yadav A, Ladusingh L, Gayawan E. 2015. Does a geographical context explain regional variation in child malnutrition in India? J Public Health (Bangkok). 23(5):277–287.
- Zewdie T, Abebaw D. 2013. Determinants of child malnutrition: empirical evidence from Kombolcha district of Eastern Hararghe zone, Ethiopia. Q J Int Agric. 52(892-2016-65185):357–372.
Appendices
Appendix 1.
Cluster-specific random intercept
Figure A1. Cluster-specific random intercept of stunting and underweight in Ethiopia. The vertical bars are the credible intervals.
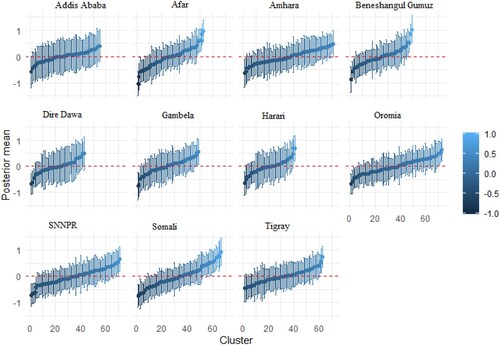
Figure A2. Cluster-specific random intercept of stunting and wasting in Ethiopia. The vertical bars are the credible intervals.
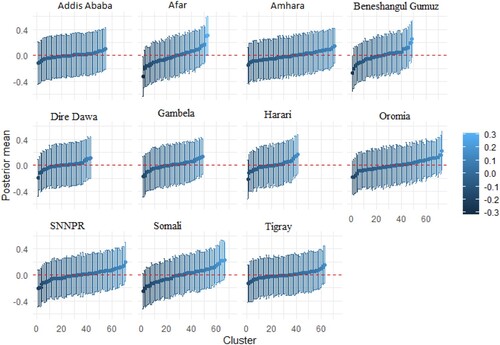
Figure A3. Cluster-specific random intercept of underweight and wasting in Ethiopia. The vertical bars are the credible intervals.
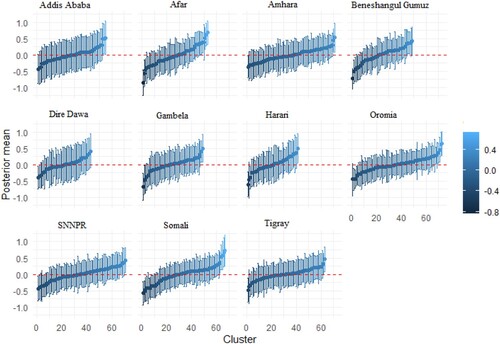
Figure A4. The relative change in the prevalence of stunting with respect to a child's age (a) and mothers' age (b), underweight with respect to a child's age (c) and mothers' age (d) and wasting with respect to a child's age (e) and mothers' age (f).
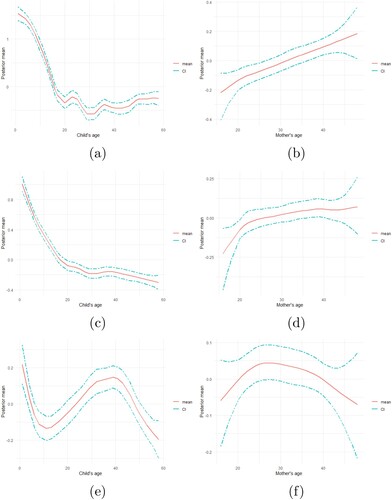
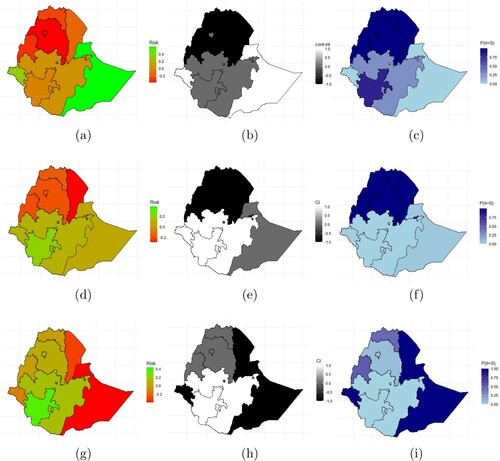
Figure A5. Prevalence of (a) stunting, (d) underweight, (g) wasting, the significance of (b) stunting (e) underweight, (h) wasting, and the probability of high prevalence of (c) stunting, (f) underweight, and (i) wasting. The black portions indicates regions with significant high prevalence and the white portion indicates significant lower prevalence region.
Appendix 2.
Univariate analysis
Table C1. Fixed effects estimates of the univariate model.
Appendix 3.
R Code