
Abstract
Trifluridine (FTD) is an effective drug for advanced colorectal cancer (CRC); however, the molecular mechanisms underlying FTD resistance has not been elucidated. This study aimed to explore mRNAs and microRNAs (miRNAs) associated with FTD resistance in CRC. The analyzed data were downloaded from the Gene Expression Omnibus (GEO) database. The differentially expressed- mRNAs (DEGs) and miRNAs (DEMs) between FTD-resistant and parental cell lines were screened. Next, the DEGs-related miRNAs were predicted and then DEGs-DEMs network was constructed, followed by functional enrichment analysis and protein–protein interaction (PPI) analysis. Meanwhile, the gene–drug interactions were identified. Finally, the prognostic significance of key genes was evaluated using survival analysis. A total of 23 DEMs and 928 DEGs were screened between FTD-resistant and CRC parental cells. The DEMs-DEGs network revealed that miRNAs such as hsa-miR-3714 and hsa-miR-3678-3p with higher degrees, and PPI network indicated that genes like HDAC5, ETV6, CCNF, SREBF1, and LDLR might be recognized as hub genes. Moreover, we observed that CCNF, HDAC5, ETV6, and SREBF1 were associated with the overall survival or disease-free survival of patients with CRC. These findings might provide an insight into potential therapeutic targets and druggable genes for FTD-resistant in patients with CRC.
Introduction
Colorectal cancer (CRC) is one of the most commonly diagnosed malignancies and the leading cause of cancer-related deaths worldwide (Sung et al. Citation2021). Approximately 25% of CRC patients present with metastases and have a 5-year survival rate of only 8% (Fakih Citation2015). Currently, the basis of CRC treatment includes surgery, targeted therapy, neoadjuvant radiotherapy, and adjuvant chemotherapy (Baretti et al. Citation2018). Unfortunately, drug resistance remains one of the primary causes of the poor survival rate of CRC patients (Van der Jeught et al. Citation2018). Trifluridine/tipiracil is a nucleoside antitumor agent comprising FTD (a thymine analogue) and tipiracil (a thymine phosphorylase inhibitor) that significantly improves overall survival of CRC patients (Moriwaki et al. Citation2018). Recently, Trifluridine/tipiracil has been ratified for the treatment of patients with unresectable or intractable metastatic CRC in Japan and the United States (Masuishi et al. Citation2017). Several human cancer cell lines with acquired FTD resistance have been established by repeatedly and continuously exposing cells to increasing concentrations of FTD (Murakami et al. Citation2000). Edahiro et al. studied the mechanism of FTD resistance in CRC cell lines and observed that targeted destruction of thymidine kinase 1 (TK1) gene led to severe FTD resistance, suggesting that deficiency in TK1 protein expression was the main cause of FTD resistance (Edahiro et al. Citation2018). Additionally, Tsunekuni et al. reported that knockout of let-7d-5p resulted in increased resistance of CRC cell lines (DLD-1) to FTD, while let-7d-5p overexpression could increase the sensitivity of DLD-1 cells to FTD (Tsunekuni et al. Citation2017). Despite these studies, the molecular mechanisms of FTD resistance in CRC have not been fully elucidated. Therefore, uncovering mechanisms involved in FTD resistance is an urgent and critical aim to improve the efficacy of CRC treatment.
MicroRNAs (miRNAs) are regulatory factors of protein-coding genes that act by directly binding to the 3′ untranslated region (3′ UTR) of their mRNA targets, leading to mRNA degradation (Zhou et al. Citation2018). The miRNAs play a crucial role in physiological processes, such as proliferation, cell cycle, apoptosis, and differentiation. Accumulating evidence suggests that miRNAs are involved in the drug resistance of tumor cells by targeting drug resistance-related genes (Si et al. Citation2019). For example, miR-155 played an important role in cancer drug resistance and might act as a target for miRNA-based therapeutics (Bayraktar and Van Roosbroeck Citation2018). However, the miRNAs that are tightly associated with FTD resistance remain unclear. With the development of bioinformatics technology, it affords us an unprecedented opportunity to understand drug resistance at the transcriptomic and proteomic levels (Colomer et al. Citation2019; Liu et al. Citation2019). Sun et al. (Citation2017) identified the genes associated with drug resistance to irinotecan and oxaliplatin in patients with CRC by using bioinformatics analysis. Additionally, Guang et al. (Citation2018) explored the drug resistance mechanism of multiple osteomas via bioinformatics technology, thereby developing new therapeutic targets and reasonable drug combinations. Nevertheless, the potential biomarkers were still limited for the FTD resistance in CRC. Thus, the identification of novel biomarkers and therapeutic targets is urgently needed.
The aim of this study was to investigate the molecular mechanism of FTD resistance in CRC. The miRNA expression profile GSE96786 and mRNA expression profile GSE96785 were downloaded from the Gene Expression Omnibus (GEO) database, and then the differentially expressed mRNAs (DEGs) and miRNAs (DEMs) between parental cell lines and FTD-resistant cell lines were screened. Next, the DEG-DEM co-expression network was constructed, followed by functional enrichment analysis. Furthermore, the protein–protein interaction (PPI) and module analyses were performed to screen hub genes. The gene–drug interactions were also predicted by using the Drug-Gene Interaction database (DGIdb) database. Finally, the prognostic significance of key genes was assessed. The flowchart of data analysis is shown in Supplementary Figure 1. These identified genes may provide clues and ideas for exploring the potential biomarkers for reversing FTD resistance in CRC.
Materials and methods
Data sources
The microarray data used in this study were retrieved from the GEO database (http://www.ncbi.nlm.nih.gov/geo/) (Barrett et al. Citation2005). The GSE96785 dataset deposited by Tsunekuni et al. (Citation2017) including mRNA expression profiles of three CRC parental cell lines and three FTD-resistant cell lines (DLD-1, HCT-116, and RKO) were determined on the GPL13915 3D-Gene Human Oligo chip 25k V2.1 platform. In addition, miRNA expression profile of GSE96786 included data from three CRC parental cell lines and three FTD-resistant sublines (DLD-1, HCT-116, and RKO), which were generated on the GPL18941 3D-Gene Human miRNA V20_1.0.0 platform.
Data preprocessing
Raw data files (txt format) were downloaded from the GEO database, limma package in R software (version 3.10.3, http://www.bioconductor.org/packages/2.9/bioc/html/limma.html) (Ritchie et al. Citation2015) was respectively applied to preprocess the expression profile data of the mRNA and miRNA. Afterwards, the probes from the two microarray data were further annotated based on the platform annotation information. Probes that not mapped the gene symbol were deleted. For multiple probes matching the same gene symbol, the average value was considered as the final gene expression value.
Differential expression analysis
DEGs and DEMs between FTD-resistant and parental cell lines were screened. The classic Bayesian method in R limma package (version 3.10.3, http://www.bioconductor.org/packages/2.9/bioc/html/limma.html) was used to identify the DEGs and DEMs between CRC parental and FTD-resistant cell lines. All genes were analyzed to obtain the corresponding P value and log fold-change (FC) value. The P < 0.05 and |logFC| > 1 were considered the threshold values of DEGs, while DEMs were selected with the cutoff criteria of P < 0.05 and |logFC| > 2.
Prediction of DEMs target genes
miRWalk2.0 (http://zmf.umm.uni-heidelberg.de/apps/zmf/mirwalk2/) (Dweep and Gretz Citation2015) generated possible miRNA–gene interactions by gathering 13 prediction data sets from existing miRNA-target resources, and is widely used for predicting miRNA targets. In the present study, seven commonly used datasets in the miRWalk2.0 database, including miRWalk, miRanda, miRDB, miRMap, Pictar2, RNA22, and Targetscan, were utilized to predict the target genes of the DEMs. The targets identified by at least five datasets were retained for further analysis. Predicted DEM-DEG pairs were selected according to the integrated mRNA and miRNA expression data.
Construction of the DEG-DEM network
In order to visualize the regulatory relationship between selected DEMs and DEGs, the network was established using Cytoscape (version 3.2.0, http://www.cytoscape.org/) (Shannon et al. Citation2003). The key DEGs and DEMs were identified based on the topological properties of nodes in the network.
Functional enrichment analysis
In order to determine the functional roles of miRNAs and target genes, the Gene Ontology_ biological processes (GO_BP) annotation and Kyoto Encyclopedia of Genes and Genomes (KEGG) pathway analysis of genes in the DEG-DEM network were conducted by using clusterprofiler (version 2.4.3, http://bioconductor.org/packages/3.2/bioc/html/clusterProfiler.html) (Yu et al. Citation2012). P value < 0.05 and gene count > 2 were considered as the threshold of significantly enriched items.
PPI network and module construction
The Search Tool for Retrieval of Interacting Genes (STRING) (version 10.0) (Szklarczyk et al. Citation2010) was employed to predict the PPI pairs of DEGs. In brief, the input genes were set as DEGs in the DEG-DEM network and the species was set as human. The PPIs with confidence scores > 0.4 were selected to structure the PPI network, which was visualized using the Cytoscape software (Shannon et al. Citation2003). The topological properties of nodes in PPI network were analyzed, and nodes with high degrees were considered as hub genes. Additionally, the Cytoscape plugin Molecular Complex Detection (MCODE; version 1.4.2, http://apps.cytoscape.org/apps/MCODE) was used to further detect deeper connected regions within the PPI network (Bandettini et al. Citation2012). PPIs with score ≥ 5 were retained to construct the module networks. Furthermore, the functional enrichment analysis of genes with top 10 degrees in the PPI network and genes in the module network was conducted using clusterprofiler. P value < 0.05 and gene count > 2 were defined as statistically significant.
The drug–gene interactions network
The DGIdb is a web resource that describes gene druggability and drug–gene interactions (Collins and Varmus Citation2015). In the present study, the DGIdb2.0 (http://www.dgidb.org/) (Wagner et al. Citation2015) was used to excavate the relevant druggable genes from the key genes. The parameters were set as ‘default’. Additionally, the whole drug–gene interactions related to critical genes were screened out and Cytoscape software was applied to visualize the results.
Evaluation of prognostic value of identified DEGs and DEMs
To further observe the prognostic value of screened genes, a survival analysis was performed. In terms of DEGs, the gene expression profiles and clinical data of patients with colon adenocarcinoma (COAD) were downloaded from The Cancer Genome Atlas (TCGA) portal. Then, the overall survival (OS) or disease free survival (DFS) of several DEMs in COAD patients were analyzed by using GEPIA (http://gepia.cancer-pku.cn/). The group cutoff was set as quartile or median. With regard to DEMs, the prognostic significance of key DEMs was assessed by using ENCORI software (http://starbase.sysu.edu.cn/index.php).
Results
Identification of DEGs and DEMs
A total of 24460 mRNA were annotated in GSE96785 and 2555 miRNAs were annotated in GSE96786. After differential expression analyses, 928 (126 up-regulated and 802 down-regulated) DEGs and 23 (20 up-regulated and 3 down-regulated) DEMs were screened between FTD-resistant and parental cell lines.
DEG-DEM network construction and analysis
The miRWalk2.0 database was used to predict the targets of all DEMs. A total of 646 DEG-DEM interactions, including 13 up-regulated DEMs, 3 down-regulated DEMs, 25 up-regulated DEGs, and 314 down-regulated DEMs, were obtained. The DEG-DEM network is shown in Figure and was composed of 355 nodes and 646 relationship pairs. The top 10 DEGs and DEMs with higher degree scores are listed in Table . Among these, hsa-miR-3714 (degree = 110), hsa-miR-513a-5p (degree = 86), and has-miR-3678-3p (degree = 83) associated regulatory pairs accounted for the most of the DEG-DEM pairs. Notably, hsa-miR-3678-3p was up-regulated and its target genes, such as SH3BP2, BRWD1, CTDSP2, and ZDHHC22 with higher degrees, were down-regulated.
Figure 1. DEGs-DEMs regulatory network. Triangles represent up-regulated DEMs, arrows represent down-regulated DEMs, circles indicate up-regulated DEGs, and prisms indicate down-regulated DEGs. DEG: differentially expressed gene, DEM: differentially expressed miRNA.
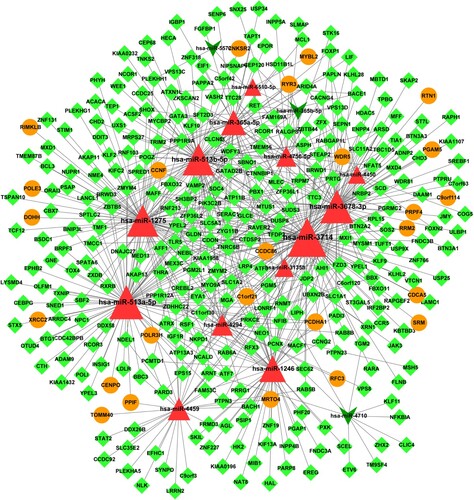
Table 1. The top 10 DEGs and DEMs.
Functional enrichment analysis of DEMs and DEGs
To investigate the biological function of DEMs and DEGs, GO analysis and KEGG pathway enrichment analysis were conducted. According to the threshold set by the method, the DEMs were significantly enriched in 59 KEGG pathways, and the top five pathways of each miRNAs are displayed in Figure (A). We observed that hsa-miR-3678-3p was mainly involved in AMPK signaling pathway, natural killer cell mediated cytotoxicity, and MAPK signaling pathway. Meanwhile, has-miR-4710 primarily participated in the legionellosis pathway.
Figure 2. Functional enrichment analysis of DEGs and DEMs. A: KEGG pathway enrichment of DEMs. Dot sizes represent counts of enriched genes and dot color represents p-value. B: The top 10 enriched GO_BP terms of up-regulated DEGs. C: KEGG pathway enrichment of up-regulated DEGs. D: The top 10 enriched GO_BP terms of down-regulated DEGs. E: KEGG pathway enrichment of down-regulated DEGs. DEG: differentially expressed gene, DEM: differentially expressed miRNA, GO_BP: gene ontology_biological process, KEGG: Kyoto Encyclopedia of Genes and Genomes.
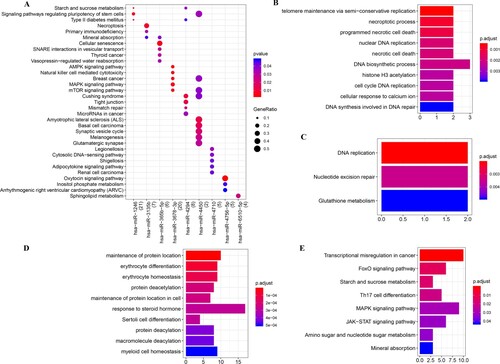
The up-regulated DEGs were enriched in 37 GO_BP and 3 KEGG pathways. The top 10 GO_BP and all KEGG pathways are shown in Figure (B,C). Specifically, up-regulated DEGs were mainly enriched in the necroptotic process, programmed necrotic cell death, and nuclear DNA replication (Figure (B)); in addition, these up-regulated genes were involved in DNA replication, nucleotide excision repair, and glutathione metabolism (Figure (C)). Furthermore, down-regulated DEGs were gathered in 325 GO_BP terms and 8 KEGG pathways. In brief, down-regulated DEGs were primarily enriched in BP terms such as maintenance of protein location, erythrocyte differentiation, and erythrocyte homeostasis (Figure (D)); meanwhile, genes were significantly involved in transcriptional misregulation in cancer, FoxO signaling pathway, and Th17 cell differentiation (Figure (E)).
PPI network and module analysis
Using the protocol described in the methods section, the PPI network with 261 nodes and 438 edges were constructed (Figure (A)). Then, the node connectivity of the DEGs in the network was calculated, and the top 10 DEGs with higher degrees are listed in Table . Genes such as NCOR1 (degree = 20), ETV6 (degree = 14), HDAC5 (degree = 12), and WDR5 (degree = 12) had higher degrees than others, which made them being considered as hub nodes in the PPI network.
Figure 3. PPI network and module analysis. A: PPI network of DEGs. B: Module A extracted by MCODE. C: Module B extracted by MCODE. Circles represent up-regulated DEGs, prisms represent down-regulated genes, and each edge represents one protein–protein interaction. D: Functional enrichment analysis of genes in PPI network (with top 10 degree) and modules.
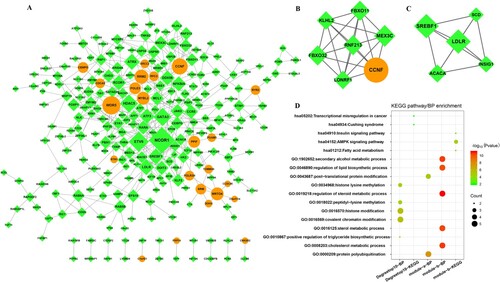
Table 2. The top 10 genes in the PPI and genes in the modules.
The MCODE approach in Cytoscape was used to identify hub modules in the PPI network. Finally, two modules with score ≥ 5 were screened. Module A (Figure (B), score = 7) contained 7 nodes and 21 relationship pairs, of which CCNF (degree = 10) and MEX3C (degree = 8) presented with higher degrees. Meanwhile, module-B (Figure (C), score = 5) composed of 5 nodes and 10 edges; of which, SREBF1 (degree = 10) and LDLR (degree = 10) presented with higher degrees and acted as hub nodes. The degree scores of genes in the modules network are also shown in Table .
Furthermore, GO_BP and KEGG pathway functional enrichment analysis of top 10 genes in PPI network and genes in the modules were conducted (Figure (D)). GO_BP enrichment analysis showed that genes in module A were mainly associated with protein polyubiquitination; genes in module B were mainly enriched in regulation of steroid metabolic methylation and secondary alcohol metabolic process. Furthermore, KEGG pathway analysis showed that genes in module B were primarily involved in AMPK signaling pathway.
Drug–gene interactions network
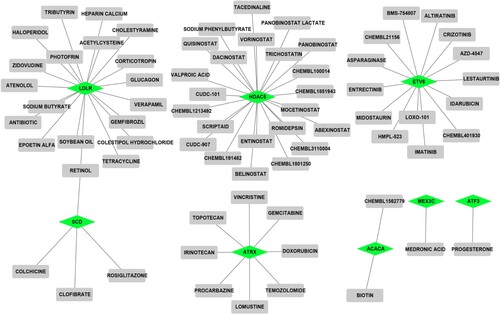
To explore potential drugs that interacted with the top 10 PPI genes and the genes in modules, drug–gene interactions were predicted by using DGIdb. As shown in Figure , 72 drug–gene interactions pairs containing 8 down-regulated DEGs (LDLR, HDAC5, ETV6, SCD, ATRX, ACACA, MEX3C, and ATF3) and 71 drugs were obtained. Among these genes, HDAC5 (degree = 23), LDLR (degree = 19), and ETV6 (degree = 14) might be potential druggable genes with higher degrees.
Figure 4. Prediction of drug-gene interactions. Prisms represent down-regulated DEGs and squares represent drugs.
Prognostic value of selected genes in CRC
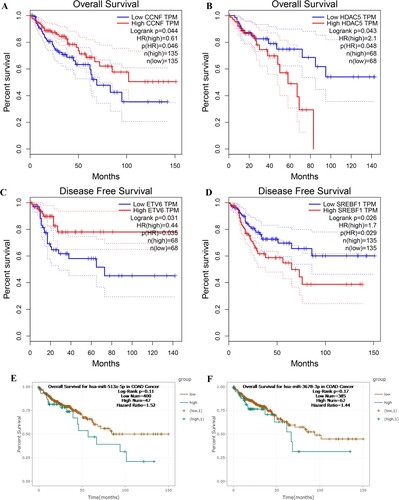
To further explore the clinical impact of the key DEGs and DEMs, the GEPIA was used to analyze the OS and DFS of CRC patients with different expression levels of these genes. Results indicated that patients with higher expression of CCNF had a significantly longer OS time (Figure (A)), and those with low expression of HDAC5 had a significantly improved OS (Figure (B)). In addition, higher expression level of ETV6 was significantly associated with better DFS (Figure (C)), and lower expression of SREBF1 was markedly connected with longer DFS (Figure (D)). In terms of DEMs, results revealed that although there were no significant differences, patients with higher expression level of hsa-miR-513a-5p (Figure (E)) and hsa-3678-3p (Figure (F)) showed a worse OS compared with those with lower expression level.
Figure 5. Prognostic values of key DEGs and DEMs in COAD patients. (A) OS curve for CCNF. (B) OS curve for HDAC5. (C) DFS curve for ETV6. (D) DFS curve for SREBF1. (E) OS curve for hsa-miR-513a-5p. (F) OS curve for hsa-miR-3678-3p. P < 0.05 represents significant difference. OS: overall survival, DFS: disease-free survival.
Discussion
FTD is a key component of the new oral antitumor drug Trifluridine/tipiracil, which has been approved for the treatment of patients with metastatic CRC that is difficult to treat with standard chemotherapy (Lin et al. Citation2020). Previous study indicated that the emergence of drug resistance greatly reduced the effectiveness of drug treatment (Van der Jeught et al. Citation2018). However, the mechanism of FTD-resistant has not been fully unrevealed. In this analysis, 23 DEMs and 928 DEGs were identified between FTD-resistant and CRC parental cell lines. The DEG-DEM regulatory network showed that miRNAs such as hsa-miR-3714, hsa-miR-513a-5p, hsa-miR-3678-3p, and hsa-miR-1275 presented high network connectivity and were considered as key DEMs. PPI network analysis revealed that genes such as HDAC5 and ETV6 might be regarded as key nodes. Meanwhile, CCNF, SREBF1, and LDLR were considered as hub genes in module networks. Interestingly, several hub genes were also found in the predicted drug–gene interaction. Further, survival analysis showed that genes such as CCNF, HDAC5, ETV6, and SREBF1 were significantly associated with the prognosis of CRC. Other studies also emphasized the role of miRNAs in prognosis of patients with CRC (Falzone et al. Citation2018; Kandhavelu et al. Citation2019); thus, we assessed the prognostic value of screened miRNAs. Results revealed that although there were no significant differences, patients with higher expression level of hsa-miR-513a-5p and hsa-3678-3p showed a worse OS compared with those with lower expression level.
As a member of the histone deacetylase/acuc/apha family, histone deacetylase 5 (HDAC5) has received much attention for its role in cancer progression, metastasis, and drug-resistance (Liu et al. Citation2016; Cao et al. Citation2017). Previous studies observed that the dysregulation of HDAC5 prompted to hormone therapy and tamoxifen resistance in ER + breast cancer (Huang et al. Citation2017); in addition, HDAC5 regulated by C-MYC was critical for tamoxifen resistance in breast cancer (Xue et al. Citation2019), suggesting that HDAC5 served important role in the drug resistance. Moreover, we also found HDAC5 was associated with the OS of patients with CRC. The tumor-associated antigen of HDAC5 in CRC could discriminate the tumorous from normal sera (Fan et al. Citation2017). In addition, GO analysis showed that HDAC5 was mainly enriched in protein deacetylation and histone deacetylation. Guo et al. observed that CUDC-907 was effective in inducing lethality in ibrutinib-resistant mantle cell lymphoma (MCL) cells by increasing histone acetylation (Guo et al. Citation2019). Considering these findings, we speculated that HDAC5 may play a role in FTD resistance via affecting histone acetylation in CRC cell lines.
ETS variant transcription factor 6 (ETV6) encodes an ETS family transcription factor, and the relationship between ETV6 and drug resistance in cancer has been reported. For example, ETV6 was a novel potential biomarker and therapeutic target in castration-resistant prostate cancer (PCa) (Tsai et al. Citation2018) and was also reported as being correlated with resistance to epidermal growth factor receptor tyrosine kinase inhibitors in PCa (Fararjeh and Liu Citation2019). We also revealed that the expression level of ETV6 was associated with the DFS of CRC. As a tumor suppressor, the abnormalities of ETV6 were responsible for cancer prognosis (Rasighaemi and Ward Citation2017), which may explain the findings in this analysis that higher expression of ETV6 was markedly connected with longer DFS. Moreover, we found that ETV6 was a target of hsa-miR-3714. Previous study showed that miR-3714 was associated with oxaliplatin resistance induction in CRC cells, whereas miR-3714 expression varied in different CRC cell lines after resistance induction; meanwhile, miR-3714 levels significantly increased in oxaliplatin-resistance SW480 clones (Ghanbarian et al. Citation2018). In this analysis, miR-3714 was also up-regulated in three FTD-resistant cell lines. Therefore, ETV6 regulated by miR-3714 might be a potential biomarker of FTD-resistant in CRC cell lines.
Another hub gene, cyclin F (CCNF), was observed to be up-regulated in FTD-resistant cell lines. Consistent with this, expression levels of cell cycle-related genes, such as CCNF, were up-regulated in the 5-FU-resistant cell line (De Angelis et al. Citation2004). Meanwhile, Seyhan et al. found that CCNF was identified in neratinib-resistant breast cancer cell lines using RNAi screen, suggesting that genes like CCNF might be regarded as potential drug resistant genetic markers (Seyhan et al. Citation2012). In addition, we also observed the prognostic significance of CCNF in CRC, which has been confirmed in other tumors (Fu et al. Citation2013; Zhao et al. Citation2019). Consistent with these studies, low expression of CCNF was associated with unfavorable prognosis in this analysis.
Sterol regulatory element binding transcription factor 1 (SREBF1) encodes a basic helix–loop–helix-leucine zipper transcription factor that is a key transcriptional regulator of lipid metabolism (Eberlé et al. Citation2004), and it was significantly downregulated in the FTD-resistant cell lines. Previous study reported that SREBF1 played a crucial role in endocrine-resistant ERα breast cancer (Perone et al. Citation2019) as well as cisplatin resistance in squamous cell carcinoma cells (Yu et al. Citation2012). In this analysis, we found that SREBF1 was targeted by hsa-miR-3678-3p. Slotta-Huspenina and colleagues demonstrated that hsa-miR-3678-3p upregulation was found in patients presenting resistance to radiochemotherapy (Slotta-Huspenina et al. Citation2018), which was consistent with our results. In addition, univariate Cox regression analysis in the study of Tang et al. (Citation2019) revealed that hsa-miR-3678 was a OS-related miRNA in breast cancer. We also found the relationship between hsa-miR-367a-3p and OS in COAD, although there was no significant difference. Taking all this into account, we speculated that SREBF1 targeted by hsa-miR-3678-3p was closely relevant to the FTD-resistant cell line, and might be recognized as potential drug resistance biomarkers.
Furthermore, we found that low density lipoprotein receptor (LDLR), a hub node in the module network, was down-regulated in FTD-resistant cell lines. A previous study reported that changes in LDLR protein expression were the main focus in the treatment of insulin resistance in HepG2 cells (Hao et al. Citation2018). In addition, Reiner (Citation2014) pointed out LDLR was a multidrug resistance-associated protein in cancer. These results suggested that LDLR might be a promising target for FTD resistance therapy in CRC. Further, co-expression analysis showed LDLR was regulated by hsa-miR-513a-5p. Recent study showed a decrease of hsa-miR-513a-5p in retinoblastoma nonresponse tissues and vincristine-resistant human retinoblastoma cell line (Yang et al. Citation2020). Meanwhile, the prognostic value of hsa-miR-513a-5p has been observed in patients with uveal melanoma (Zhao et al. Citation2020). However, the association between hsa-miR-513a-5p and CRC OS has not been explored. In this analysis, survival analysis showed despite low expression of hsa-miR-513a-5p being connected with a better prognosis, there was no significant difference. These findings were obtained via bioinformatics analysis; thus, further experimental studies were urgently demanded to validate our results.
Even though this study investigated the molecular mechanism of FTD resistance in CRC cell lines, we still need to clarify several limitations. Firstly, the expression level of screened mRNAs and miRNAs in the samples was not verified using the real-time quantitative polymerase chain reaction or western blot. Secondly, the data used in this analysis were obtained from in vitro experiments, and whether these findings could be used in clinical applications still need further research. Thus, the biological function of identified genes in FTD resistance should be further explored in animal models and/or clinical experiments. Finally, whether the expression levels of genes were different in various FTD-resistant CRC cell lines remain unclear. These will be the focus of our future research.
In conclusion, we utilized bioinformatics analyses to screen novel candidate biomarkers and uncover possible molecular mechanisms of FTD-resistant CRC cell lines. Genes such as HDAC5, ETV6, CCNF, SREBF1, and LDLR, miRNAs like hsa-miR-3714 and hsa-miR-3678-3p might be considered as potential drug resistant genetic markers. Moreover, we found the prognostic value of these genes in CRC. These findings provide potential biomarkers and candidate therapeutic options for FTD resistance in patients with CRC. Nevertheless, further experimental studies are required to investigate the exact roles of these genes.
Author contributions statement
Conception and design of the research: QZ; acquisition of data: XY and ZW; analysis and interpretation of data: ZW; statistical analysis: ZZ; drafting the manuscript: LZ and QZ; revision of manuscript for important intellectual content: ZW. All authors have approved the final version to be published and that all authors agree to be accountable for all aspects of the work.
Supplemental Material
Download TIFF Image (1.6 MB)Disclosure statement
No potential conflict of interest was reported by the author(s).
Data availability statement
The data that support the findings of this study are available in the Gene Expression Omnibus database (http://www.ncbi.nlm.nih.gov/geo/) with the accession number of GSE96785 and GSE96786.
References
- Bandettini WP, Kellman P, Mancini C, Booker OJ, Vasu S, Leung SW, Wilson JR, Shanbhag SM, Chen MY, Arai AE. 2012. Multicontrast delayed enhancement (MCODE) improves detection of subendocardial myocardial infarction by late gadolinium enhancement cardiovascular magnetic resonance: a clinical validation study. J Cardiovasc Magn Reson. 14:83. doi:10.1186/1532-429X-14-83.
- Baretti M, Rimassa L, Personeni N, Giordano L, Tronconi MC, Pressiani T, Bozzarelli S, Santoro A. 2018. Effect of comorbidities in stage II/III colorectal cancer patients treated with surgery and neoadjuvant/adjuvant chemotherapy: a single-center, observational study. Clin Colorectal Cancer. 17:e489–e498. doi:10.1016/j.clcc.2018.03.010.
- Barrett T, Suzek TO, Troup DB, Wilhite SE, Ngau WC, Ledoux P, Rudnev D, Lash AE, Fujibuchi W, Edgar R. 2005. NCBI GEO: mining millions of expression profiles–database and tools. Nucleic Acids Res. 33:D562–D566. doi:10.1093/nar/gki022.
- Bayraktar R, Van Roosbroeck K. 2018. miR-155 in cancer drug resistance and as target for miRNA-based therapeutics. Cancer Metastasis Rev. 37:33–44. doi:10.1007/s10555-017-9724-7.
- Cao C, Vasilatos SN, Bhargava R, Fine JL, Oesterreich S, Davidson NE, Huang Y. 2017. Functional interaction of histone deacetylase 5 (HDAC5) and lysine-specific demethylase 1 (LSD1) promotes breast cancer progression. Oncogene. 36:133–145. doi:10.1038/onc.2016.186.
- Collins FS, Varmus H. 2015. A new initiative on precision medicine. N Engl J Med. 372:793–795. doi:10.1056/NEJMp1500523.
- Colomer C, Margalef P, Villanueva A, Vert A, Pecharroman I, Solé L, González-Farré M, Alonso J, Montagut C, Martinez-Iniesta M, et al. 2019. IKKα kinase regulates the DNA damage response and drives chemo-resistance in cancer. Mol Cell. 75:669–682.e665. doi:10.1016/j.molcel.2019.05.036.
- De Angelis PM, Fjell B, Kravik KL, Haug T, Tunheim SH, Reichelt W, Beigi M, Clausen OP, Galteland E, Stokke T. 2004. Molecular characterizations of derivatives of HCT116 colorectal cancer cells that are resistant to the chemotherapeutic agent 5-fluorouracil. Int J Oncol. 24:1279–1288.
- Dweep H, Gretz N. 2015. miRWalk2. 0: a comprehensive atlas of microRNA-target interactions. Nat Methods. 12:697. doi:10.1038/nmeth.3485.
- Eberlé D, Hegarty B, Bossard P, Ferré P, Foufelle F. 2004. SREBP transcription factors: master regulators of lipid homeostasis. Biochimie. 86:839–848. doi:10.1016/j.biochi.2004.09.018.
- Edahiro K, Iimori M, Kobunai T, Morikawa-Ichinose T, Miura D, Kataoka Y, Niimi S, Wakasa T, Saeki H, Oki E, et al. 2018. Thymidine kinase 1 loss confers Trifluridine resistance without affecting 5-fluorouracil metabolism and cytotoxicity. Mol Cancer Res. 16:1483–1490. doi:10.1158/1541-7786.
- Fakih MG. 2015. Metastatic colorectal cancer: current state and future directions. J Clin Oncol. 33:1809–1824. doi:10.1200/JCO.2014.59.7633.
- Falzone L, Scola L, Zanghì A, Biondi A, Di Cataldo A, Libra M, Candido S. 2018. Integrated analysis of colorectal cancer microRNA datasets: identification of microRNAs associated with tumor development. Aging (Milano). 10:1000–1014. doi:10.18632/aging.101444.
- Fan CW, Kuo YB, Lin GP, Chen SM, Chang SH, Li BA, Chan EC. 2017. Development of a multiplexed tumor-associated autoantibody-based blood test for the detection of colorectal cancer. Clin Chim Acta. 475:157–163. doi:10.1016/j.cca.2017.10.022.
- Fararjeh AS, Liu YN. 2019. ZBTB46, SPDEF, and ETV6: novel potential biomarkers and therapeutic targets in castration-resistant prostate cancer. Int J Mol Sci. 20:2802. doi:10.3390/ijms20112802.
- Fu J, Qiu H, Cai M, Pan Y, Cao Y, Liu L, Yun J, Zhang CZ. 2013. Low cyclin F expression in hepatocellular carcinoma associates with poor differentiation and unfavorable prognosis. Cancer Sci. 104:508–515. doi:10.1111/cas.12100.
- Ghanbarian M, Afgar A, Yadegarazari R, Najafi R, Teimoori-Toolabi L. 2018. Through oxaliplatin resistance induction in colorectal cancer cells, increasing ABCB1 level accompanies decreasing level of miR-302c-5p, miR-3664-5p and miR-129-5p. Biomed Pharmacother. 108:1070–1080. doi:10.1016/j.biopha.2018.09.112.
- Guang MHZ, McCann A, Bianchi G, Zhang L, Dowling P, Bazou D, O'Gorman P, Anderson KC. 2018. Overcoming multiple myeloma drug resistance in the era of cancer ‘omics’. Leuk Lymphoma. 59:542–561. doi:10.1080/10428194.2017.1337115.
- Guo H, Zeng D, Zhang H, Bell T, Yao J, Liu Y, Huang S, Li CJ, Lorence E, Zhou S, et al. 2019. Dual inhibition of PI3K signaling and histone deacetylation halts proliferation and induces lethality in mantle cell lymphoma. Oncogene. 38:1802–1814. doi:10.1038/s41388-018-0550-3.
- Hao J, Huang K, Chen C, Liang Y, Wang Y, Zhang X, Huang H. 2018. Polydatin improves glucose and lipid metabolisms in insulin-resistant HepG2 cells through the AMPK pathway. Biol Pharm Bull. 41:891–898. doi:10.1248/bpb.b17-01027.
- Huang WT, Tsai YH, Chen SH, Kuo CW, Kuo YL, Lee KT, Chen WC, Wu PC, Chuang CY, Cheng SM, et al. 2017. HDAC2 and HDAC5 up-regulations modulate survivin and miR-125a-5p expressions and promote hormone therapy resistance in estrogen receptor positive breast cancer cells. Front Pharmacol. 8:902. doi:10.3389/fphar.2017.00902.
- Kandhavelu J, Subramanian K, Khan A, Omar A, Ruff P, Penny C. 2018. Computational analysis of miRNA and their gene targets significantly involved in colorectal cancer progression. MicroRNA. 8:68–75. doi:10.2174/2211536607666180803100246.
- Lin YL, Liu KL, Lin BR. 2020. Trifluridine/tipiracil in combination with local therapy may be a favorable option for refractory metastatic colorectal cancer patients: A case report. Medicine (Baltimore). 99:e22780. doi:10.1097/md.0000000000022780.
- Liu H, Wang S, Zhou S, Meng Q, Ma X, Song X, Wang L, Jiang W. 2019. Drug resistance-related competing interactions of lncRNA and mRNA across 19 cancer types. Mol Ther Nucleic Acids. 16:442–451. doi:10.1016/j.omtn.2019.03.011.
- Liu J, Gu J, Feng Z, Yang Y, Zhu N, Lu W, Qi F. 2016. Both HDAC5 and HDAC6 are required for the proliferation and metastasis of melanoma cells. J Transl Med. 14:7. doi:10.1186/s12967-015-0753-0.
- Masuishi T, Taniguchi H, Hamauchi S, Komori A, Kito Y, Narita Y, Tsushima T, Ishihara M, Todaka A, Tanaka T, et al. 2017. Regorafenib versus Trifluridine/tipiracil for refractory metastatic colorectal cancer: a retrospective comparison. Clin Colorectal Cancer. 16:e15–e22. doi:10.1016/j.clcc.2016.07.019.
- Moriwaki T, Fukuoka S, Taniguchi H, Takashima A, Kumekawa Y, Kajiwara T, Yamazaki K, Esaki T, Makiyama C, Denda T, et al. 2018. Propensity score analysis of Regorafenib versus Trifluridine/tipiracil in patients with metastatic colorectal cancer refractory to standard chemotherapy (REGOTAS): a Japanese society for cancer of the colon and rectum multicenter observational study. Oncologist. 23:7–15. doi:10.1634/theoncologist.2017-0275.
- Murakami Y, Kazuno H, Emura T, Tsujimoto H, Suzuki N, Fukushima M. 2000. Different mechanisms of acquired resistance to fluorinated pyrimidines in human colorectal cancer cells. Int J Oncol. 17:277–283. doi:10.3892/ijo.17.2.277.
- Perone Y, Farrugia AJ, Rodríguez-Meira A, Győrffy B, Ion C, Uggetti A, Chronopoulos A, Marrazzo P, Faronato M, Shousha S, et al. 2019. SREBP1 drives keratin-80-dependent cytoskeletal changes and invasive behavior in endocrine-resistant ERα breast cancer. Nat Commun. 10:2115. doi:10.1038/s41467-019-09676-y.
- Rasighaemi P, Ward AC. 2017. ETV6 and ETV7: siblings in hematopoiesis and its disruption in disease. Crit Rev Oncol Hematol. 116:106–115. doi:10.1016/j.critrevonc.2017.05.011.
- Reiner Z. 2014. Resistance and intolerance to statins. Nutr Metab Cardiovasc Dis. 24:1057–1066. doi:10.1016/j.numecd.2014.05.009.
- Ritchie ME, Phipson B, Wu D, Hu Y, Law CW, Shi W, Smyth GK. 2015. Limma powers differential expression analyses for RNA-sequencing and microarray studies. Nucleic Acids Res. 43:e47. doi:10.1093/nar/gkv007.
- Seyhan AA, Varadarajan U, Choe S, Liu W, Ryan TE. 2012. A genome-wide RNAi screen identifies novel targets of neratinib resistance leading to identification of potential drug resistant genetic markers. Mol BioSyst. 8:1553–1570. doi:10.1039/c2mb05512k.
- Shannon P, Markiel A, Ozier O, Baliga NS, Wang JT, Ramage D, Amin N, Schwikowski B, Ideker T. 2003. Cytoscape: a software environment for integrated models of biomolecular interaction networks. Genome Res. 13:2498–2504. doi:10.1101/gr.1239303.
- Si W, Shen J, Zheng H, Fan W. 2019. The role and mechanisms of action of microRNAs in cancer drug resistance. Clin Epigenetics. 11:25. doi:10.1186/s13148-018-0587-8.
- Slotta-Huspenina J, Drecoll E, Feith M, Habermehl D, Combs S, Weichert W, Bettstetter M, Becker K, Langer R. 2018. MicroRNA expression profiling for the prediction of resistance to neoadjuvant radiochemotherapy in squamous cell carcinoma of the esophagus. J Transl Med. 16:109. doi:10.1186/s12967-018-1492-9.
- Sun X, Wang X, Feng W, Guo H, Tang C, Lu Y, Xiang X, Bao Y. 2017. Gene signatures associated with drug resistance to irinotecan and oxaliplatin predict a poor prognosis in patients with colorectal cancer. Oncol Lett. 13:2089–2096. doi:10.3892/ol.2017.5691.
- Sung H, Ferlay J, Siegel RL, Laversanne M, Soerjomataram I, Jemal A, Bray F. 2021. Global cancer statistics 2020: GLOBOCAN estimates of incidence and mortality worldwide for 36 cancers in 185 countries. CA Cancer J Clin. 71:209–249. doi:10.3322/caac.21660.
- Szklarczyk D, Franceschini A, Kuhn M, Simonovic M, Roth A, Minguez P, Doerks T, Stark M, Muller J, Bork P, et al. 2011. The STRING database in 2011: functional interaction networks of proteins, globally integrated and scored. Nucleic Acids Res. 39:D561–D568. doi:10.1093/nar/gkq973.
- Tang J, Ma W, Zeng Q, Tan J, Cao K, Luo L. 2019. Identification of miRNA-based signature as a novel potential prognostic biomarker in patients with breast cancer. Dis Markers. 2019:3815952. doi:10.1155/2019/3815952.
- Tsai YC, Zeng T, Abou-Kheir W, Yeh HL, Yin JJ, Lee YC, Chen WY, Liu YN. 2018. Disruption of ETV6 leads to TWIST1-dependent progression and resistance to epidermal growth factor receptor tyrosine kinase inhibitors in prostate cancer. Mol Cancer. 17:42. doi:10.1186/s12943-018-0785-1.
- Tsunekuni K, Konno M, Asai A, Koseki J, Kobunai T, Takechi T, Doki Y, Mori M, Ishii H. 2017. MicroRNA profiles involved in Trifluridine resistance. Oncotarget. 8:53017–53027. doi:10.18632/oncotarget.18078.
- Van der Jeught K, Xu HC, Li YJ, Lu XB, Ji G. 2018. Drug resistance and new therapies in colorectal cancer. World J Gastroenterol. 24:3834–3848. doi:10.3748/wjg.v24.i34.3834.
- Wagner AH, Coffman AC, Ainscough BJ, Spies NC, Skidmore ZL, Campbell KM, Krysiak K, Pan D, McMichael JF, Eldred JM, et al. 2016. DGIdb 2.0: mining clinically relevant drug–gene interactions. Nucleic Acids Res. 44:D1036–D1044. doi:10.1093/nar/gkv1165.
- Xue Y, Lian W, Zhi J, Yang W, Li Q, Guo X, Gao J, Qu H, Lin W, Li Z, et al. 2019. HDAC5-mediated deacetylation and nuclear localisation of SOX9 is critical for tamoxifen resistance in breast cancer. Br J Cancer. 121:1039–1049. doi:10.1038/s41416-019-0625-0.
- Yang L, Zhang L, Lu L, Wang Y. 2020. lncRNA increases proliferation and multidrug resistance of retinoblastoma cells through downregulating miR-513a-5p. DNA Cell Biol. 39:69–77. doi:10.1089/dna.2019.5063.
- Yu G, Wang L, Han Y, He Q. 2012. Clusterprofiler: an R package for comparing biological themes among gene clusters. OMICS. 16:284–287. doi:10.1089/omi.2011.0118.
- Zhao D, Zhao X, Li W. 2020. Identification of differentially expressed metastatic genes and their signatures to predict the overall survival of uveal melanoma patients by bioinformatics analysis. Int J Ophthalmol. 13:1046–1053. doi:10.18240/ijo.2020.07.05.
- Zhao L, Jiang L, He L, Wei Q, Bi J, Wang Y, Yu L, He M, Zhao L, Wei M. 2019. Identification of a novel cell cycle-related gene signature predicting survival in patients with gastric cancer. J Cell Physiol. 234:6350–6360. doi:10.1002/jcp.27365.
- Zhou SS, Jin JP, Wang JQ, Zhang ZG, Freedman JH, Zheng Y, Cai L. 2018. miRNAS in cardiovascular diseases: potential biomarkers, therapeutic targets and challenges. Acta Pharmacol Sin. 39:1073–1084. doi:10.1038/aps.2018.30.