
Abstract
Ovarian cancer (OC) is the fifth leading cause of death in females. This study aims to identify new prognostic genes of OC through bioinformatics analysis. Based on two datasets from the NCBI GEO public database, we constructed two WGCNA networks. We then selected and intersected two key modules and 177 key genes were identified. The GO, KEGG and PPI network were determined based on the screened genes. According to the LASSO analysis and KM plotter, three hub genes were associated with the overall survival. GEPIA and IHC staining showed that CCDC80 expression level was lower while FBXO16 expression level was higher in OC tissues than in normal ovarian tissues. The relationship between hub genes and clinical characteristics was evaluated and the prognostic significance was validated in 60 clinical patients with OC. CIBERSORT shows that both CCDC80 and FBXO16 were significantly correlated with the immune cell content. Drug sensitivity analysis shows that CCDC80 affected the IC50 value of Gefitinib, and FBXO16 affected the IC50 value of Cisplatin and Docetaxel. CCDC80 and FBXO16 were identified as two robust prognostic factors in OC that could be explored further with respect to the diagnosis and treatment of OC patients.
Introduction
Ovarian cancer (OC) ranks first among all female reproductive system-related deaths due to tumors and fifth among the cancer-related deaths in women in the USA (Gutiérrez-Castañeda et al. Citation2020). The prevalence of OC in China has increased by 30% in the last decade (Ferlay et al. Citation2019). Although standard treatment (radical surgery followed by chemotherapy with paclitaxel and cisplatin) and new therapies, such as PARP and VEGF inhibitors, do improve the condition of patients and reduce mortality, a low survival rate of five years is due to the frequent relapse and drug resistance (Gadducci et al. Citation2019). The occurrence and development of OC are related to mutation, inactivation, and abnormal expression of many genes. Understanding the variation in expression of relevant genes and the discovery of novel pathogenic genes can help to develop therapies against OC, as well as explore the molecular mechanism underlying the occurrence and development of OC.
For the diagnosis of OC, various biomarkers have been identified, such as cancer antigen 125 (CA125) and HE4, which are prognostic indicators widely used in the diagnosis and monitoring of OC in patients (Urban et al. Citation2015; Wei et al. Citation2016). CEA (carcinoembryonic antigen) is more specific in mucinous ovarian carcinoma, especially in the advanced stages of cancer (Choi et al. Citation2018). B7-H4, combined with CA125, can increase the specificity and sensitivity of detecting OC and is associated with the clinical staging and metastasis of OC (Liang et al. Citation2016). Other valuable OC candidate markers, such as mesothelin (MSLN), lysophosphatidic acid (LPA), and osteopontin (OPN), have been studied as diagnostic and prognostic factors (Zhang et al. Citation2015; Hilliard Citation2018; Guo et al. Citation2019). The detection of one of the above-mentioned molecular biomarkers alone has certain limitations due to the lack of specificity and sensitivity. In clinical practice, combined detection of OC is commonly used for its diagnosis and prognosis. This is very important to elucidate the molecular pathways and mechanisms responsible for the progression and establishment of OC. Moreover, this can help to design and discover novel biomarkers. With the development of emerging technologies, such as tumor molecular biology, gene chips, and gene sequencing, comprehensive methods in bioinformatics can help in the detailed analysis and investigation of fundamental pathways involved in OC. We can find suitable and specific molecular markers and use them for targeted therapy to provide a reference for clinical prevention and prognosis and ultimately achieve individualized and efficient treatment to reduce the death rate.
Bioinformatics analysis is a method that is used for the exploration of target genes. Weighted gene co-expression network analysis (WGCNA) was adapted to build a free-scale gene co-expression network that would determine the correlations between gene sets and clinical features. It has also been utilized to screen and identify the biomarker candidate (Langfelder and Horvath Citation2008; Malki et al. Citation2013; Udyavar et al. Citation2013). WGCNA can group a series of genes with similar expression spectrum into modules but cannot assess the degree of correlation between the genes in the module and the prognosis of the tumor. Regression analysis can show the degree of correlation between the two variables by mathematical models. LASSO regression algorithm is a compression estimation method, which can obtain higher prediction accuracy and model generalization by introducing penalty items into model estimation, which has the advantage of having smaller mean square root error in dealing with high-dimensional data, multi-collinearity problems, and overall variable selection, and thus, effectively avoids overfitting (Ribbing et al. Citation2007). The algorithm provides conditions for extracting characteristic genes and has certain advantages in screening genes strongly related to tumor prognosis (Lin et al. Citation2013). Therefore, in our study, we downloaded two datasets from the NCBI GEO public database and constructed a WGCNA network to detect key modules and genes related to survival. From the TCGA database, we used the LASSO regression algorithm to further screen for biomarkers highly related to survival. IHC staining was conducted to validate the expression of hub genes in clinical tissues. GSVA, CIBERSORT, and GDSC were employed to explore the biological function, the immune infiltration and drug sensitivity of these hub genes. In short, we provided ideas for the study of new prognostic markers of OC.
Methods
Data source from GEO
The publicly available Gene Expression Omnibus database (GEO, https://www.ncbi.nlm.nih.gov/geo/) is a rich source of gene expression-related sequencing data obtained by DNA-microarray analysis and next-generation sequencing. The GEO is freely accessible by all users. Homo sapiens was selected as the species to obtain information on ovarian tissues. The datasets with more than 15 samples and containing complete information on survival were selected for the subsequent analyses. Two ovarian cancer gene expression profiles (GSE14001 and GSE54388) were obtained from the GPL570 platform. The array data of GSE14001 included 20 OC tissue samples and three normal ovarian tissue samples. The data of GSE54388 consisted of 16 OC samples and six normal ovarian tissue samples. Then, robust multi-array average (RMA) algorithm was applied on the original expression profile for background correction and quantile normalization. Subsequently, the mRNA expression matrices of patients with OC were developed. Moreover, the expression was estimated using variance analysis and ranked by variance. The top 5000 genes were selected to construct a co-expression network.
Weighted co-expression network analysis
First, 5000 variant genes were avaulated for availability, and then, the R package ‘WGCNA’ was employed to construct a gene co-expression network. The Pearson’s correlation coefficient was calculated between two genes. Next, an adjacency matrix was constructed to describe the correlation strength between the nodes. A soft threshold of 6 and 16 was set for analysis of GSE14001 and GSE54388, respectively (scale-free R2 = 0.9). This matrix was then transformed into a topological overlap matrix (TOM), which quantitates the similarity in the nodes by comparing the weighted correlation between the two nodes and other nodes (Ravasz et al. Citation2002). Subsequently, we established a hierarchical cluster to identify the modules, each containing at least 30 genes. Finally, the eigengene was calculated, the modules were clustered hierarchically, and similar modules were merged (MEDissThres = 0.2). According to the correlation coefficient and the associated p-value between the trait and the eigengene of each module, we selected the key module with the highest correlation coefficient and the smallest p-value, except the grey module. To screen for the key genes, we calculated the GS and MM of every gene. Gene significance (GS) indicates the correlations between individual genes and the trait of interest, while module membership (MM) represents the correlation between the module eigengene and the gene expression profile. Furthermore, the correlation between GS and MM implies that the genes and other elements are significantly associated with a specific trait. Finally, genes with GS > 0.5 and MM > 0.8 were selected to form the key module for further analysis.
Functional and pathway enrichment analysis and PPI network construction
The R package ‘Cluster Profiler’ was used for functional enrichment analysis and to annotate key genes for the comprehensive determination of biological correlations of various critical gene targets. Data available from the Gene Ontology (GO) and the Kyoto Encyclopedia of Genes and Genomes (KEGG) databases were used to evaluate the functional categories of the identified genes. All data used from GO and KEGG for the current analyses with p-values < 0.05 indicated statistical significance. The Search Tool for the Retrieval of Interacting Genes (STRING, http://string91.embl.de/) database was employed to construct a protein–protein interaction (PPI) network that was visualized using Cytoscape.
Data source from TCGA
The TCGA database (https://portal.gdc.cancer.gov/) is the world’s largest cancer-related genetic database that contains information on gene expression, miRNA, copy number variation, the status of DNA and histone methylation, SNPs, etc. We used relevant data on OC and the differential expression patterns and processed a total of 379 samples belonging to OC patients.
Detection and validation of hub genes
Least absolute shrinkage and selection operator (LASSO) is a compression estimation method that can compress the regression coefficients by constructing a penalty function to select variables. The samples from the TCGA OC database were used to determine the impact of each candidate gene as a single independent risk factor on survival. The R package ‘glmnet’ was used for LASSO regression model construction. The ten-fold cross-validation method was performed and lambda (λ) was selected when the mean square error is minimum. Through the LASSO regression model, the regression coefficients of most genes were compressed to 0, the genes whose regression coefficient were not 0 were those that were strongly related to survival. The correlation between the expression of the hub genes and the overall survival (OS) rate was confirmed using the Kaplan-Meier Plotter (http://kmplot.com/analysis/) with the hazard ratio (HR), 95% confidence intervals, and long-rank p-value. The GEPIA database was also used to verify the expression of the hub genes in OC and normal tissues.
Patients and tissue samples
Ovarian samples were obtained from 60 OC patients who underwent surgery between 2014 and 2016 and 30 non-cancer individuals with related clinical data for IHC. None of the patients received preoperative chemotherapy or radiotherapy. The clinicalpathological data, including age, FIGO stage, tumor differentiation status, lymph node metastasis of OC patients were recorded. A written informed consent was obtained from all patients prior to the study that was approved by the Ethics Committee of the Shengjing Hospital of China Medical University, China. The patients were followed up every 3 months for the first 2 years post-surgery, every 6 months thereafter, and annually after 5 years. The last follow-up was on May 30, 2021. The OS was defined as the time between surgery and death or the last follow-up (censored data for alive patients).
Immunohistochemistry
To further validate the protein expression of hub genes, immunohistochemistry assay was conducted in clinical samples. To perform immunostaining, an antibody-based detection kit was used (Solarbio, SP0041, China). The prepared tissue sections were incubated with specific antibodies—anti-CCDC80 (Ab224050, 1:200; Abcam) and anti-FBXO16(E-AB-17951, 1:200; Elabscience) at 4°C overnight. Diaminobenzidine (DAB) solution (Solarbio, DA1010, China) was used for counterstaining of the tissues, which were then treated with hematoxylin (Solarbio, H8070, China) for 1 min and dehydrated. The intensity of immunohistochemistry (IHC) staining was visualized and scored as 0 (no stain), 1 (weak), 2 (medium), and 3 (strong); the extent of staining was scored (from 0 to 4) that corresponded with the percentage of immune-reactive tumor cells (0%, 1–25%, 26–50%,51-75%, 76–100%). Moreover, a score of 0–12 was assigned based on the staining scores and the intensity of staining: negative (0–6) andpositive (8–12) for each sample.
Analysis using the cbioportal
The alteration frequencies of the hub genes in OC were determined using the cBioPortal for Cancer Genomics (http://www.cbioportal.org/).
Gene set variation analysis (GSVA)
GSVA is a non-parametric and unsupervised method used for assessing the enrichment of the transcriptome gene sets. It comprehensively scores the gene sets and transforms the gene-level changes into those of the pathway-level. The GSVA algorithm was used to assess the potential changes in biological functions between different risk groups (Hänzelmann et al. Citation2013).
Correlation analysis between the hub genes and the infiltrating immune cells
CIBERSORT is widely used to evaluate immune cell types in the tumor microenvironment. This method applies the principle of supporting vector regression for deconvolution analysis on the expression matrix of immune cell subtypes (Newman et al. Citation2015). It consists of 547 biomarkers and 22 human immune cell phenotypes, such as T cells, B cells, plasma cells, and myeloid cell subgroups. The Spearman’s correlation analysis of the hub genes and the infiltrating immune cells was conducted using the ‘ggstatsplot’ package in R (https://github.com/IndrajeetPatil/ggstatsplot). The corresponding result was visualized using the ‘ggplot2’ package.
Drug sensitivity analysis
GDSC (https://www.cancerrxgene.org/) is a large public collaborative project, dedicated to determining molecular biomarkers of drug sensitivity (Yang et al. Citation2013). GDSC provides information about molecular markers of drug sensitivity and drug sensitivity in cancer cells. Next, the R package ‘pRRophetic’ was applied to analyze the data obtained from GDSC to predict the chemotherapeutic sensitivity of each tumor sample. Regression analysis was performed to obtain the value at IC50, estimated for each specific drug treatment, and the GDSC training set was used for ten cross-validation tests to assess the regression and prediction accuracy. All parameters were to default values, including ‘combat’ to exclude the batch effects and the average expression value of repetitive genes.
Statistical analysis
The R Programming Language (version 3.6) was used in the analysis of WGCNA, LASSO, GO, KEGG, GSVA, CIBERSORT, and GDSC. Fisher’s exact test was used to analyze categorical data and a two-sample Mann–Whitney U test or Student’s t-test was used for continuous data. Correlation between two continuous variables was measured by Pearson’s correlation coefficient. The data of IHC scores were presented as mean ± SD and non-parametric tests compare dthe differences via GraphPad Prism 9.0 software. The chi-square test was used to evaluate the differences in CCDC80 and FBXO16 expression between the two groups of clinicopathological features. The survival curves were obtained using the Kaplan–Meier method and verified by the log-rank text by SPSS 19.0. P < 0.05 (two-tailed) indicated statistical significance.
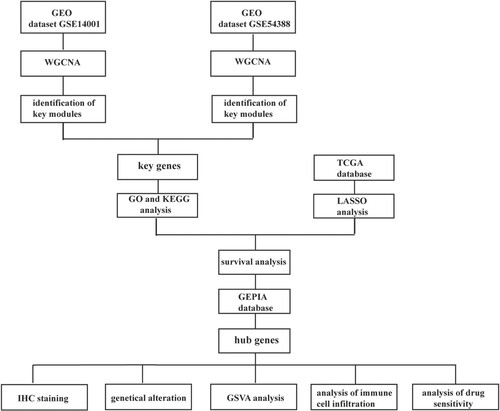
Figure 1. The framework of the study.
Results
WGCNA construction and identification of key modules from GSE14001
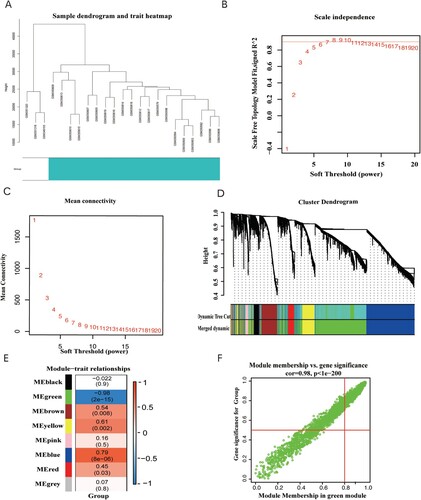
The holistic analytical framework of this study was shown (). The GSE14001 dataset was downloaded from the NCBI GEO database for 23 patients, along with healthy controls (n = 3) and OC patients (n = 20). Based on the observed clinical features of the samples from the patients, the WGCNA network was designed to identify significant genes that play key roles in the establishment of OC (Figure (a)). The function ‘sft$powerEstimate’ was applied to determine the soft threshold (β) value. The soft threshold was fixed as 6 and was detected based on the TOM matrix(Figure (b,c)). Eight gene modules were detected in this analysis, comprising black (169), blue (1,529), brown (458), green (2,099), grey (18), pink (89), red (194), and yellow (444) modules(Figure (d,e)). Further analysis of the modules and traits revealed that the green module was correlated with the tumor phenotype (cor = −0.98, P = 2e-15) (Figure (f)), and thus, was selected for subsequent verification.
Figure 2. (A) Clustering dendrogram of 23 samples from GSE14001. (B) Analysis of the scale-free fit index for various soft-thresholding powers (β). (C) Analysis of the mean connectivity for various soft-thresholding powers. (D) Dendrogram of the differentially expressed genes clustered together based on a dissimilarity measure (1-TOM), along with the assigned merged module colors and the original module colors. (E) Heatmap of the correlation between the modules and clinical traits of ovarian cancer; red represents positive correlation and blue represents negative correlation. (F) Scatter plot of GS vs. MM in the green module.
WGCNA construction and identification of key modules from GSE54388
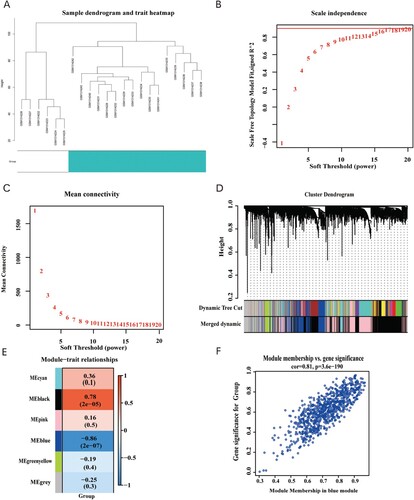
We downloaded GSE54388 from the NCBI GEO database for 22 patients, including both the healthy control group (n = 6) and the OC patient group (n = 16). The WGCNA network was constructed (Figure (a)) with the soft threshold set to 16 (Figure (b,c)). In this analysis, six gene modules were detected, comprising black (1991), blue (813), cyan (119), green-yellow (180), grey (706), and pink (1,191) modules (Figure (d,e)). Strikingly, the blue module showed the highest correlation with the tumor phenotype (cor = −0.86, P = 2e-07) (Figure (f)). Thus, the blue module was selected for subsequent verification.
Figure 3. (A) Clustering dendrogram of 22 samples from GSE54388. (B) Analysis of the scale-free fit index for various soft-thresholding powers (β). (C) Analysis of the mean connectivity for various soft-thresholding powers. (D) Dendrogram of the differentially expressed genes clustered together based on a dissimilarity measure (1-TOM), along with the assigned merged module colors and the original module colors. (E) Heatmap of the correlation between the modules and clinical traits of ovarian cancer; red represents positive correlation and blue represents negative correlation. (F) Scatter plot of GS vs. MM in the blue module.
Identification of key genes, enrichment analysis of functional pathways, and PPI construction
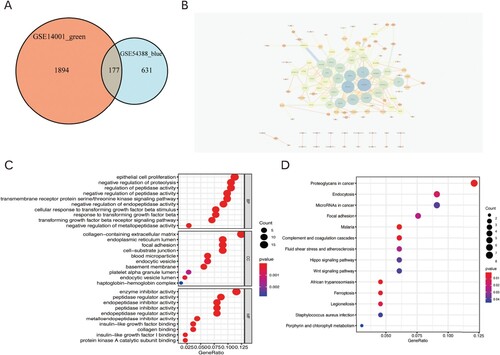
The modules with the highest correlation with tumor were obtained through the WGCNA analysis. By taking the intersection of the two modules, 177 key genes were obtained (Figure (a)). The interaction between the genes is shown in the PPI diagram (Figure (b)). GO analysis revealed that the GO pathway mainly enriched signal mechanisms such as downregulation activities of peptidase and endopeptidase, negative regulation of proteolysis, non-proliferation of epithelial cells, and inhibition of the transmembrane receptor protein serine/threonine kinase signaling pathway (Figure (c)). KEGG analysis showed that the pathway comprised of signal mechanisms such as proteoglycans in cancer, malaria, African trypanosomiasis, ferroptosis, and complement and coagulation cascades (Figure (d)).
Figure 4. (A) Venn diagram of the intersection of genes in key modules. (B) Protein-protein interaction (PPI) network of 177 key genes. (C) GO analysis of key genes. (D) KEGG enrichment analysis of key genes.
Screening and verification of hub genes
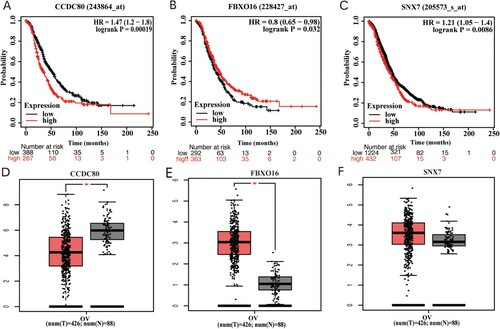
The 177 significant genes, identified in the prognostic modules of OC, were evaluated the impact of key genes on survival from the data of the OC patients obtained from the TCGA database and used the LASSO algorithm to screen molecular markers of OC. For the analysis, we downloaded 379 OC samples from the TCGA database. The R package ‘glmnet’ was used to screen for variability, and cross-validation was used for iterative analysis. When the variable was 3, the root mean square error (RMSE) of the model was the smallest. A prognostic prediction risk score model for OC was constructed (Figure (a,b)). Finally, three hub genes were obtained: CCDC80, FBXO16, and SNX7. The Kaplan-Meier tool was applied to confirm the correlation between the hub genes and the prognosis. We found that the OS rate of the OC patients with lower expression of CCDC80 and SNX7 was higher than that of the patients with higher expression of the two genes. The OS rate of the OC patients with higher expression of FBXO16 was higher than that of the patients with lower expression of the gene (log-rank P < 0.05, Figure (a–c)). According to the GEPIA database, the expression of CCDC80 was significantly lower in OC tissues (P < 0.01) and the expression of FBXO16 was significantly higher in OC tissues (P < 0.01) than in normal ovarian tissues. However, the expression of SNX7 in both OC and normal ovarian tissues was similar (P > 0.05) (Figure (d–f)). Therefore, CCDC80 and FBXO16 were selected for further analysis.
Figure 5. (A) Selection process of the cross-validation parameter (λ). (B) Dynamic-process of the LASSO screening variable.
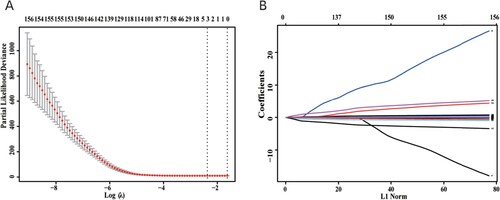
Figure 6. Relationship between the expression levels of (A) CCDC80, (B) FBXO16, and (C) SNX7 with the overall survival of patients with OC; red indicates high expression and black indicates low expression (log-rank P < 0.05). Comparison of the expression of (D) CCDC80, (E) FBXO16, and (F) SNX7 in OC tissues and normal healthy tissues; red indicates tumorous tissues and grey indicates normal tissues. CCDC80 was significantly downregulated, while FBXO16 was significantly upregulated in OV tissues compared to the expressions in normal tissues (P < 0.01). SNX7 was upregulated in OV tissues, but the difference was not significant (P > 0.05). The red asterisk (*) represents the level of significance at P < 0.01.
Expression validation in clinical samples
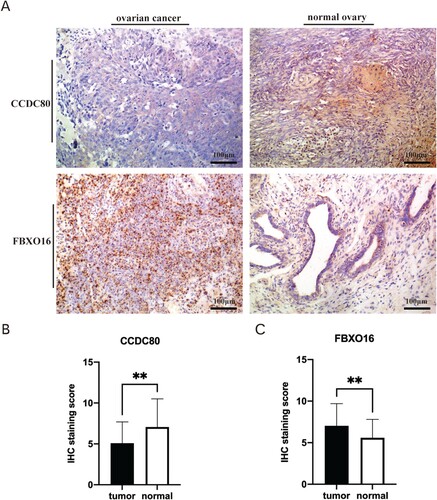
CCDC80 and FBXO16 expression were examined by immunohistochemistry assay. CCDC80 was detected in the cytoplasm of the OC cells, while FBXO16 was present in the nucleus (Figure (a)). Of the 60 included OC patients, 38 had a low expression of CCDC80, and 22 had a high expression of CCDC80. 36 OC patients had a high expression of FBXO16, and 24 had a low expression of FBXO16. In 30 normal ovarian tissues, 18 of them had a high expression of CCDC80 and 11 of them had a high expression of FBXO16. As predicted, CCDC80 expression was significantly higher in the normal ovarian tissues than in the OC tissues (P = 0.0051) (Figure (b)). The OC tissue specimens showed a significantly higher level of of FBXO16 than the normal ovarian tissues (P = 0.0099) (Figure (c)).
Figure 7. (A) Representative Immunohistochemical photographs stained with CCDC80 and FBXO16 in ovarian cancer tissues and normal ovarian tissues (B) The IHC staining score of CCDC80 in ovarian cancer tissues compared to the scores in normal ovarian tissues (P<0.05). (C) The IHC staining score of FBXO16 in ovarian cancer tissues compared to the scores in normal ovarian tissues (P<0.05).
Association between CCDC80/FBXO16 expression and clinical parameters and the prognostic significance in OC
Next, we analyzed the correlation between the expression of CCDC80 and FBXO16 and clinical characteristics of 60 patients with OC to evaluate the clinical significance of the two genes in OC (Table ). Consequently, high CCDC80 expression was associated with tumor clinical FIGO stage (P = 0.009) and tumor differentiation (P = 0.049). Low FBXO16 expression was significantly associated with clinical FIGO stage (P = 0.013), tumor differentiation (P = 0.039). The follow-up of the 60 patients revealed that the expression of CCDC80 and FBXO16 was significantly associated with OS. Moreover, patients with a high expression of CCDC80 exhibited poor prognosis (Log Rank P = 0.018, Figure (a)), and a low expression of FBXO16 was significantly related to a short OS (Log Rank P = 0.013, Figure (b)).
Figure 8. Kaplan-Meier overall survival analyses for CCDC80 and FBXO16 expressed in 60 patients with OC.
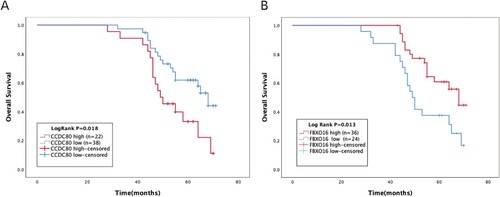
Table 1. Association Between CCDC80/FBXO16 Expression and Clinicopathological Parameters in 60 Patients with Ovarian Cancer.
Genetic alteration of the hub genes
The cBioPortal database was utulized to determine the mutations in the hub genes associated with the OC via TCGA-PanCancer dataset. The mutation rates were 9% for CCDC80 and 12% for FBXO16 (Figure (a)).
Figure 9. (A) Mutation rate of hub genes: CCDC80 (9%), FBXO16 (12%). GSVA enrichment pathway diagram of hub genes: (B) CCDC80 and (C) FBXO16.
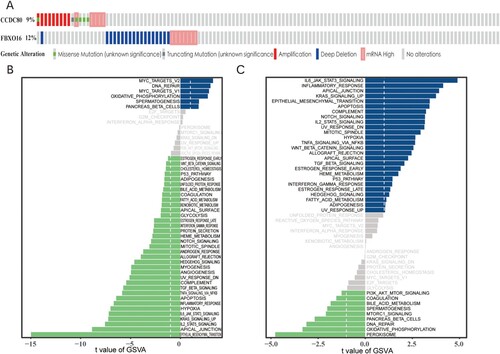
GSVA analysis
We analyzed the details of the signal pathways that were found to be liked with the two hub genes and investigated the underlying potential molecular mechanisms of action of CCDC80 and FBXO16 that affected OC progression. GSVA analysis revealed that the signalin pathways involved with a low expression of CCDC80 were part of the epithelial–mesenchymal transition (EMT), apical junction, IL2 STAT signaling, KRAS signaling, etc. High expression of CCDC80 was involved in signal pathways such as MYC, DNA repair, etc. (Figure (b)). The signal pathways involved with a low expression of FBXO16 were part of the peroxisome, oxidative phosphorylation, DNA repair, and PI3K-AKT-mTOR signaling. A high expression of FBXO16 was found in signal pathways such as IL6-JAK-STAT3 signaling, EMT, etc. (Figure (c)).
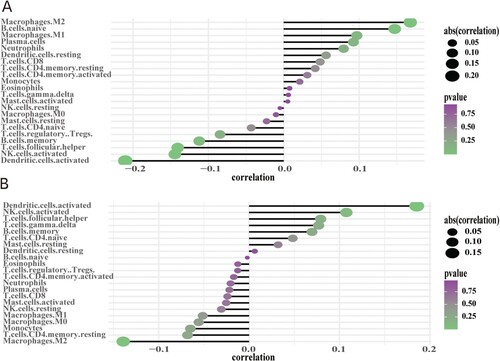
Analysis of immune cell infiltration
In order to analyze the correlation between the hub genes and tumor immune infiltration from the TCGA datasets, the CIBERSORT method was applied. Moreover, this method was used for the determination of the potential molecular mechanisms underlying the involvement of the hub genes in the progression of OC. The results showed that both genes had a strong correlation with the content of the immune cells. CCDC80 was significantly positively correlated with M2 macrophages and naïve B cells but negatively correlated with activated dendritic cells (P < 0.05) (Figure (a)). FBXO16 was positively correlated with activated dendritic cells and NK cells but was negatively correlated with M2 macrophages (P < 0.05) (Figure (b)).
Figure 10. Correlation between infiltrating immune cells and hub genes: (A) CCDC80 and (B) FBXO16; dot size represents the strength of the correlation between genes and immune cells – larger dots denote stronger correlation, and smaller dots denote weaker correlation. The greener the color, the lower the p-value.
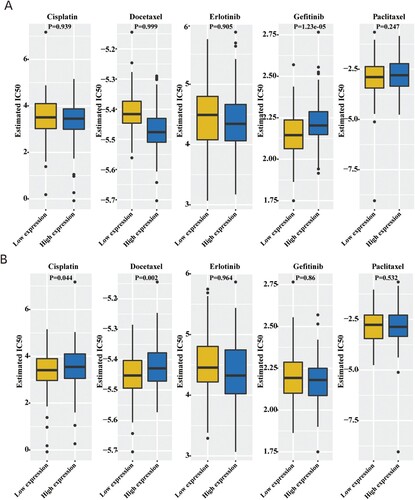
Drug sensitivity analysis of the hub genes in OC
Next, we analyzed the chemotherapy sensitivity data obtained from the GDSC database to determine the correlation between the hub genes and the commonly used chemotherapeutic drugs. The results showed that CCDC80 affected the IC50 value of Gefitinib, and FBXO16 affected the IC50 value of Cisplatin and Docetaxel (Figure ). This implied that the hub genes influenced the patient’s prognosis by affecting the sensitivity of the patients to chemotherapeutic drugs; CCDC80 and FBXO16 could be potential drug targets.
Figure 11. Relationship between the IC50 value of chemotherapeutic drugs and hub genes: (A) CCDC80 and (B) FBXO16.
Discussion
Due to advances in surgical and medical treatments, the overall mortality rate of OC patients has considerably improved over the past decades. The major reason behind the lethality of OC is the difficulty in early diagnosis and a lack of effective treatment methods for patients in the advanced stages of the disease (Wan et al. Citation2015). A technology based on gene chips is being developed rapidly and widely to understand genetic changes during disease progression, which might provide novel targets for early diagnosis of tumors, the treatment of the tumors, and prognosis.
CCDC80 (coiled-coil domain containing 80), also known as CL2 DRO1, was first found to be downregulated in thyroid cancer (Ferraro et al. Citation2013), as well as in various tumors such as OC, colon, breast, and pancreatic cancers, as a potential tumor suppressor (Bommer et al. Citation2005). In this study, based on the GEPIA analysis and IHC staining assay, the CCDC80 gene was downregulated in the OC tissues but upregulated in normal tissues, which was consistent with previous studies. The cl2/ccdc80 gene knockout mice demonstrated that the embryonic fibroblasts mice had a high proliferation rate but low susceptibility to apoptosis (Leone et al. Citation2015). Restoration of CCDC80 gene expression made human thyroid cancer cell lines apoptotic (Leone et al. Citation2015). AIB1 inhibits the DRO1 promoter, and its expression level is negatively correlated with DRO1, suggesting that DRO1 is a tumor suppressor, which targets AIB1-dependent apoptosis (Ferragud et al. Citation2011). In previous studies, it was speculated that CCDC80 plays a role of tumor suppressor by promoting cell apoptosis and inhibiting tumor cell proliferation. GSVA analysis in this study showed that CCDC80 was also enriched in apoptosis-related pathways, which supports the results above. Studies of thyroid cancer showed that CL2/CCDC80 gene expression increased E-cadherin expression. Loss of CL2/CCDC80 expression in tumors gave rise to undifferentiated and aggressive phenotypes, such as epithelial to mesenchymal transition (Ferraro et al. Citation2013) during the developmental process. The KM analysis presented a high survival rate of OC patients with a low expression of CCDC80. From the GSVA analysis in this study, low expression of CCDC80 was found to be enriched in EMT, apoptosis, P53 pathway, Wnt/β-catenin, and other pathways related to invasion and metastasis, suggesting that CCDC80 might affect the prognosis of OC through the pathways above, but the molecular mechanisms by which CCDC80 plays a role in OC needs to be confirmed empirically.
The FBXO16 gene on human chromosome 8p12, encodes the protein that is expressed in the heart, spleen, and colon tissues (Cheng et al. Citation2002). Similar to the other members of the F-box protein family, FBXO16 consists of the F-box, which is a 40-amino acid sequence. The F-box protein is one of the four components of the ubiquitin-protein ligase complex SCFs (skp1-cullin-F-box) in the ubiquitination process (Cenciarelli et al. Citation1999). Khan et al. (Citation2019) found that the expression of FBXO16 in glioblastoma (GBM) was low, and thus, acted as a tumor suppressor. Low expression of FBXO16 causes β-catenin to lose its target in the GBM cells, leading to its nuclear accumulation and excessive activation of Wnt signaling. The activated Wnt/β-catenin signaling pathway is one of the key molecular pathways in a variety of signaling pathways that are abnormally activated in GBM (Khan et al. Citation2019). Paul et al. (Citation2019) also found that the expression of FBXO16 was opposite to that of β-catenin in breast cancer, and high expression of FBXO16 could attenuate tumor progression. FBXO16 regulates β-catenin at the post-translational level and inhibits tumor EMT in breast cancer. The survival rate of breast cancer patients with high levels of FBXO16 was higher compared to those with low FBXO16 levels (Paul et al. Citation2019). In this study, the KM analysis showed that OC patients with a high expression of FBXO16 had a high survival rate, which was in line with the breast cancer data described above. The GEPIA and IHC findings presented high expression of FBXO16 in OC, which was contrary to the results obtained for other tumors.
Furthermore, the occurrence and clinical prognosis of tumors are closely related to the distribution and infiltration of immune cells in the tumor microenvironment (Hou et al. Citation2020). Also, tumor-associated macrophages, myeloid-derived suppressor cells, tumor-associated fibroblasts, and other immune cells are detected in the tumor microenvironment (Bi et al. Citation2020). Studies have shown that the components of the tumor microenvironment are dynamic and physiological behaviors, such as invasion and metastasis, are related to the tumor microenvironment (Binnewies et al. Citation2018). The immunotherapy response and the progression of OC are limited by the fact that the tumor microenvironment of OC is in a state of immunosuppression (Fialová et al. Citation2013). B cells could promote tumor progression by producing factors that inhibit T-cells (Khan et al. Citation2019); M2 macrophages might also have tumor-promoting effects (Paul et al. Citation2019). Dendritic cells present cancer cell antigens to T lymphocytes, triggering attacks on cancer cells (Hou et al. Citation2020). The NK cells eradicate tumor cells via cytolytic granules, proinflammatory cytokines, and chemokines (Terabe et al. Citation2000; Ma et al. Citation2013; Ichimura et al. Citation2016; Sarvaria et al. Citation2017). From the results of the CIBERSORT analysis, it is speculated that CCDC80 might affect the progression of OC by increasing the content of M2 macrophages and naïve B cells or reducing the content of activated dendritic cells. FBXO16 might enhance the anti-tumor immune response and inhibit tumor growth, invasion, and metastasis by increasing the content of activated dendritic cells and activated NK cells or by reducing the content of M2 macrophages or changing their polarity. It is inferred that the difference in gene expression might change the microenvironment in tumors, thus affecting the prognosis of patients. This phenomenon could be the basis ofpoor prognosis in patients with high CCDC80 expression, while those with a high FBXO16 expression had a favorable prognosis.
The analysis of data from the GDSC database showed that CCDC80 affected the IC50 value of Gefitinib, and FBXO16 affected the IC50 value of Cisplatin and Docetaxel. Gefitinib is an EGFR tyrosine kinase inhibitor that inhibits EGFR by binding to ATP. CCDC80 enriches multiple signaling pathways, and the mechanism of its interaction with Gefitinib remains unreported. Platinum is the main drug for OC chemotherapy. The current research on platinum resistance mechanism is mainly divided into the following aspects: cancer cells (including p53) (Reles et al. Citation2001; Yang-Hartwich et al. Citation2015) and whole gene mutations (Waddell et al. Citation2015), epigenetic changes (Chang et al. Citation2015), and function Disordered DNA repair (Shih et al. Citation2010). Additionally, the tumor microenvironment, angiogenesis, and hypoxia are also related to platinum resistance. These genetic mechanisms might work together to enable cancer cells to adapt to the DNA damage caused by platinum chemotherapy and help them survive (van Zyl et al. Citation2018). The GSVA analysis showed that low expression of FBXO16 was enriched in oxidative phosphorylation, peroxisome, and DNA repair pathways, suggesting that FBXO16 might affect platinum sensitivity through the pathways mentioned above. The two hub genes selected in this study are new gene targets for studying the molecular mechanism of the sensitivity or resistance of chemotherapeutic drugs.
Conclusion
Through WGCNA and LASSO regression analyses, we identified and validated CCDC80 and FBXO16 as new candidate genes that affect the prognosis of OC. Moreover, we found that the two genes were significantly related to the infiltration of immune cells and could affect the IC50 value of the commonly used chemotherapeutic drugs for OC. These data can guide the dfuture studies on the potential biomarkers and the mechanisms underlying OC to open new avenues for the diagnosis and treatment of the disease. However, the current study is based on the secondary mining and analysis of published datasets and thus has the limitation of lack of cell line- and animal-based experiments. Next, we will focus on the functions of CCDC80 and FBXO16 genes and design a complete in vivo and in vitro verification test.
Acknowledgments
The excellent technical assistance of Ling Ouyang is gratefully acknowledged. We would like to acknowledge the KEGG database developed by Kanehisa Laboratories. We also would like to acknowledge the GEPIA and TCGA databases for free use.
Disclosure statement
No potential conflict of interest was reported by the author(s).
Data availability statement
These data were derived from the following resources available in the public domain: TCGA with cancer type of ovarian cancer (https://tcga-data.nci.nih.gov/tcga/), and GEO database with Series ID of GSE14001 and GSE54388 (https://www.ncbi.nlm.nih.gov/geo/). The data that support the findings of this study are available in the data repository of Mendeley Data at doi: 10.17632/mtjvvmmmcw.2 (https://data.mendeley.com/datasets/mtjvvmmmcw/2).
References
- Bi G, Chen Z, Yang X, Liang J, Hu Z, Bian Y, Sui Q, Li R, Zhan C, Fan H. 2020. Identification and validation of tumor environment phenotypes in lung adenocarcinoma by integrative genome-scale analysis. Cancer Immunol Immunother. 69(7):1293–1305.
- Binnewies M, Roberts EW, Kersten K, Chan V, Fearon DF, Merad M, Coussens LM, Gabrilovich DI, Ostrand-Rosenberg S, Hedrick CC, et al. 2018. Understanding the tumor immune microenvironment (TIME) for effective therapy. Nat Med. 24(5):541–550.
- Bommer GT, Jäger C, Dürr EM, Baehs S, Eichhorst ST, Brabletz T, Hu G, Fröhlich T, Arnold G, Kress DC, et al. 2005. DRO1, a gene down-regulated by oncogenes, mediates growth inhibition in colon and pancreatic cancer cells. J Biol Chem. 280(9):7962–7975.
- Cenciarelli C, Chiaur DS, Guardavaccaro D, Parks W, Vidal M, Pagano M. 1999. Identification of a family of human F-box proteins. Curr Biol. 9(20):1177–1179.
- Chang CC, Chow CC, Tellier LC, Vattikuti S, Purcell SM, Lee JJ. 2015. Second-generation PLINK: rising to the challenge of larger and richer datasets. Gigascience. 4(1):s13742–015.
- Cheng H, Ma Y, Ni X, Jiang M, Guo L, Jin W, Xu W, Cao G, Ji C, Yin K, et al. 2002. cDNA cloning and expression analysis of a novel human F-box only protein. Mol Cells. 14(1):56–59.
- Choi JH, Sohn GS, Chay DB, Cho HB, Kim JH. 2018. Preoperative serum levels of cancer antigen 125 and carcinoembryonic antigen ratio can improve differentiation between mucinous ovarian carcinoma and other epithelial ovarian carcinomas. Obstet Gynecol Sci. 61(3):344–351.
- Ferlay J, Colombet M, Soerjomataram I, Mathers C, Parkin DM, Piñeros M, Znaor A, Bray F. 2019. Estimating the global cancer incidence and mortality in 2018: GLOBOCAN sources and methods. Int J Cancer. 144(8):1941–1953.
- Ferragud J, Avivar-Valderas A, Pla A, De Las Rivas J, de Mora J. F. 2011. Transcriptional repression of the tumor suppressor DRO1 by AIB1. FEBS Lett. 585(19):3041–3046.
- Ferraro A, Schepis F, Leone V, Federico A, Borbone E, Pallante P, Berlingieri MT, Chiappetta G, Monaco M, Palmieri D, et al. 2013. Tumor suppressor role of the CL2/DRO1/CCDC80 gene in thyroid carcinogenesis. J Clin Endocrinol Metab. 98(7):2834–2843.
- Fialová A, Partlová S, Sojka L, Hromádková H, Brtnický T, Fučíková J, Kocián P, Rob L, Bartůňková J, Spíšek R. 2013. Dynamics of T-cell infiltration during the course of ovarian cancer: the gradual shift from a Th17 effector cell response to a predominant infiltration by regulatory T-cells. Int J Cancer. 132(5):1070–1079.
- Gadducci A, Guarneri V, Peccatori FA, Ronzino G, Scandurra G, Zamagni C, Zola P, Salutari V. 2019. Current strategies for the targeted treatment of high-grade serous epithelial ovarian cancer and relevance of BRCA mutational status. J Ovarian Res. 12(1):1–8.
- Guo J, Yang WL, Pak D, Celestino J, Lu KH, Ning J, Lokshin AE, Cheng Z, Lu Z, Bast RC, Jr. 2019. Osteopontin, macrophage migration inhibitory factor and anti-interleukin-8 autoantibodies complement CA125 for detection of early stage ovarian cancer. Cancers (Basel). 11(5):596.
- Gutiérrez-Castañeda LD, Tovar-Parra D, Quintero G, Amezquita L, Guerrero C, Sanabria D. 2020. Isolation and phenotypic characterization of tumor cells of patients with a diagnosis of ovarian cancer. J Cell Physiol. 235(4):3320–3328.
- Hänzelmann S, Castelo R, Guinney J. 2013. GSVA: gene set variation analysis for microarray and RNA-seq data. BMC Bioinformatics. 14(1):1–15.
- Hilliard TS. 2018. The impact of mesothelin in the ovarian cancer tumor microenvironment. Cancers (Basel). 10(9):277.
- Hou P, Kapoor A, Zhang Q, Li J, Wu CJ, Li J, Lan Z, Tang M, Ma X, Ackroyd JJ, et al. 2020. Tumor microenvironment remodeling enables bypass of oncogenic KRAS dependency in pancreatic cancer. Cancer Discov. 10(7):1058–1077.
- Ichimura T, Abe H, Morikawa T, Yamashita H, Ishikawa S, Ushiku T, Seto Y, Fukayama M. 2016. Low density of CD204-positive M2-type tumor-associated macrophages in epstein-barr virus-associated gastric cancer: a clinicopathologic study with digital image analysis. Hum Pathol. 56:74–80.
- Khan M, Muzumdar D, Shiras A. 2019. Attenuation of tumor suppressive function of FBXO16 ubiquitin ligase activates Wnt signaling In glioblastoma. Neoplasia. 21(1):106–116.
- Langfelder P, Horvath S. 2008. WGCNA: an R package for weighted correlation network analysis. BMC Bioinformatics. 9:559.
- Leone V, Ferraro A, Schepis F, Federico A, Sepe R, Arra C, Langella C, Palma G, De Lorenzo C, Troncone G, et al. 2015. The cl2/dro1/ccdc80 null mice develop thyroid and ovarian neoplasias. Cancer Lett. 357(2):535–541.
- Liang L, Jiang Y, Chen JS, Niu N, Piao J, Ning J, Zu Y, Zhang J, Liu J. 2016. B7-H4 expression in ovarian serous carcinoma: a study of 306 cases. Hum Pathol. 57:1–6.
- Lin Y, Wang S, Chappell RJ. 2013. Lasso tree for cancer staging with survival data. Biostatistics. 14(2):327–339.
- Ma Y, Shurin GV, Peiyuan Z, Shurin MR. 2013. Dendritic cells in the cancer microenvironment. J Cancer. 4(1):36–44.
- Malki K, Tosto MG, Jumabhoy I, Lourdusamy A, Sluyter F, Craig I, Uher R, McGuffin P, Schalkwyk LC. 2013. Integrative mouse and human mRNA studies using WGCNA nominates novel candidate genes involved in the pathogenesis of major depressive disorder. Pharmacogenomics. 14(16):1979–1990.
- Newman AM, Liu CL, Green MR, Gentles AJ, Feng W, Xu Y, Hoang CD, Diehn M, Alizadeh AA. 2015. Robust enumeration of cell subsets from tissue expression profiles. Nat Methods. 12(5):453–457.
- Paul D, Islam S, Manne RK, Dinesh US, Malonia SK, Maity B, Boppana R, Rapole S, Shetty PK, Santra MK. 2019. F-box protein FBXO16 functions as a tumor suppressor by attenuating nuclear β-catenin function. J Pathol. 248(3):266–279.
- Ravasz E, Somera AL, Mongru DA, Oltvai ZN, Barabási AL. 2002. Hierarchical organization of modularity in metabolic networks. Science (New York, NY). 297(5586):1551–1555.
- Reles A, Wen WH, Schmider A, Gee C, Runnebaum IB, Kilian U, Jones LA, El-Naggar A, Minguillon C, Schönborn I, et al. 2001. Correlation of p53 mutations with resistance to platinum-based chemotherapy and shortened survival in ovarian cancer. Clin Cancer Res. 7(10):2984–2997.
- Ribbing J, Nyberg J, Caster O, Jonsson EN. 2007. The lasso–a novel method for predictive covariate model building in nonlinear mixed effects models. J Pharmacokinet Pharmacodyn. 34(4):485–517.
- Sarvaria A, Madrigal JA, Saudemont A. 2017. B cell regulation in cancer and anti-tumor immunity. Cell Mol Immunol. 14(8):662–674.
- Shih KK, Chi DS, Barakat RR, Leitao MM. 2010. Tertiary cytoreduction in patients with recurrent epithelial ovarian, fallopian tube, or primary peritoneal cancer: an updated series. Gynecol Oncol. 117(2):330–335.
- Terabe M, Matsui S, Noben-Trauth N, Chen H, Watson C, Donaldson DD, Carbone DP, Paul WE, Berzofsky JA. 2000. NKT cell-mediated repression of tumor immunosurveillance by IL-13 and the IL-4R-STAT6 pathway. Nat Immunol. 1(6):515–520.
- Udyavar AR, Hoeksema MD, Clark JE, Zou Y, Tang Z, Li Z, Li M, Chen H, Statnikov A, Shyr Y, et al. 2013. Co-expression network analysis identifies spleen tyrosine kinase (SYK) as a candidate oncogenic driver in a subset of small-cell lung cancer. BMC Syst Biol. 7(5):1–16.
- Urban N, Hawley S, Janes H, Karlan BY, Berg CD, Drescher CW, Manson JE, Palomares MR, Daly MB, Wactawski-Wende J, et al. 2015. Identifying post-menopausal women at elevated risk for epithelial ovarian cancer. Gynecol Oncol. 139(2):253–260.
- van Zyl B, Tang D, Bowden NA. 2018. Biomarkers of platinum resistance in ovarian cancer: what can we use to improve treatment. Endocr Relat Cancer. 25(5):R303–r318.
- Waddell N, Pajic M, Patch AM, Chang DK, Kassahn KS, Bailey P, Johns AL, Miller D, Nones K, Quek K, et al. 2015. Whole genomes redefine the mutational landscape of pancreatic cancer. Nature. 518(7540):495–501.
- Wan J, Shi F, Xu Z, Zhao M. 2015. Knockdown of eIF4E suppresses cell proliferation, invasion and enhances cisplatin cytotoxicity in human ovarian cancer cells. Int J Oncol. 47(6):2217–2225.
- Wei SU, Li H, Zhang B. 2016. The diagnostic value of serum HE4 and CA-125 and ROMA index in ovarian cancer. Biomed Rep. 5(1):41–44.
- Yang W, Soares J, Greninger P, Edelman EJ, Lightfoot H, Forbes S, Bindal N, Beare D, Smith JA, Thompson IR, et al. 2013. Genomics of drug sensitivity in cancer (GDSC): a resource for therapeutic biomarker discovery in cancer cells. Nucleic Acids Res. 41:D955–D961.
- Yang-Hartwich Y, Soteras MG, Lin ZP, Holmberg J, Sumi N, Craveiro V, Liang M, Romanoff E, Bingham J, Garofalo F, et al. 2015. P53 protein aggregation promotes platinum resistance in ovarian cancer. Oncogene. 34(27):3605–3616.
- Zhang YJ, Cao LY, Fu ZZ, Wang YJ, Wang GX, Gu T. 2015. Clinical significance of plasma lysophosphatidic acid levels in the differential diagnosis of ovarian cancer. J Cancer Res Ther. 11(2):375–380.