
Abstract
We aimed to investigate the prognostic value of costimulatory molecules in PAAD by generating a CMS. Gene expression data and clinical factors of PAAD patients were obtained from TCGA. The signature was constructed using the survival package progressive Cox risk proportional regression model. Analyses of CMS-related genes, pathways, immune cell infiltration, and somatic mutations were conducted. A five-gene-based CMS was developed, and the risk score for CMS could be an independent risk factor for PAAD patients. Patients were divided into high- and low-risk groups based on the median Y of the CMS model. Differential analysis revealed 341 DEGs between the groups, and KEGG analysis demonstrated that these positively related genes in the high-risk group were mainly involved in chemical synaptic transmission pathway modulation and trans-synaptic signaling pathway regulation. Immune cell infiltration analysis revealed that the high-risk patients had higher proportions of M1 macrophages and T+ CD4 cells, but a lower proportion of M2 macrophages than that of the low-risk group. Mutational analysis revealed that the high-risk group showed a higher proportion of somatic mutations compared with that of the low-risk group. A CMS was developed, and the risk score could be an independent risk factor for PAAD patients.
Highlights
A five gene-based CMS (TNFSF10, EDA, FAS, TNFSF9 and NGFR) was developed.
Risk score of CMS could be an independent risk factor for PAAD patients.
There was a difference in immune cell infiltration between high- and low- risk groups
High-risk patients showed a higher proportion of somatic mutations.
Introduction
Pancreatic adenocarcinoma (PAAD), one of the most deadly malignancies, is the third leading cause of cancer-related deaths worldwide, accounting for 8% of all cancer-related deaths (Neoptolemos et al. Citation2018; Crawford et al. Citation2019; Siegel et al. Citation2020). PAAD is predicted to be the second leading cause of cancer-related deaths in developed countries by 2030 (Siegel et al. Citation2019). PAAD is generally characterized by rapid progression, high recurrence, and metastasis. Due to the lack of specific clinical symptoms, PAAD is usually diagnosed at a late stage and has aggressive and metastatic characteristics with no effective therapies available (Rahib et al. Citation2014; Ferri et al. Citation2016; Yan et al. Citation2017). In recent decades, despite numerous efforts to improve the efficacy of treatment, including surgery radiotherapy and chemoradiotherapy, the prognosis of PAAD patients remains unsatisfactory, with 1-year survival of ≤ 25% and 5-year survival of < 5% (Niki A Ottenhof et al. Citation2009). Therefore, less invasive and more convenient diagnostic and prognostic indicators for PAAD are required.
Anti-tumor immunity is influenced by various factors of the tumor micro-environment (TME) that control the intensity and timing of host responses to tumors, and these responses are ultimately critical to tumor initiation, tumor growth, invasion, and metastasis (Catalano et al. Citation2013; Choi et al. Citation2017). Accumulating research has shown that costimulatory molecules and their signal transduction play vital roles in the TME and mediate the mutual regulation between tumor cells and their microenvironment during tumor pathology (Sun et al. Citation2010). Costimulatory molecules, are molecules involved in costimulus signaling, including the B7-CD28 and TNF families. They are expressed on tumor-infiltrating lymphocytes or cancer cells (Tang et al. Citation2018), and are also involved in the regulation of the antitumor immune response (Zhang et al. Citation2020). In several tumors, certain costimulatory molecules can be used as valuable diagnostic or prognostic markers to complement histopathological staging (Hua et al. Citation2012; Bin et al. Citation2014; Zhang et al. Citation2020). However, the diagnostic or prognostic value of costimulatory molecules in PAAD has not been reported.
In this study, based on the gene expression data and clinical parameters of PAAD from The Cancer Genome Atlas (TCGA), a costimulatory molecule-based signature (CMS) model was constructed to predict prognosis. Subsequently, CMS-related genes, biological processes, pathways, immune cell infiltration, and somatic mutations were detected. The flow chart of this study is illustrated in Figure S1.
Materials and methods
Data source
The gene expression and clinical data of 181 PAAD patients after the exclusion of the adjacent cancerous sample ‘TCGA-H6-A45N-11A’ were obtained from the UCSC Xena database of TCGA (http://xena.ucsc.edu) (Zweig et al. Citation2008). After the count value of PAAD transcriptome data was standardized with log2 (count+1), 60489 transcripts (EG.ENSG00000000003.13) were combined with the same transcripts, after which the genes with 50% expression of 0 were excluded, and 31385 Ensembl_ID were excluded. The genecode human gene transcriptome annotation file was used for gene annotation of the transcriptome; meanwhile, Ensembl_ID and Symbol were converted using Python. Finally, the ‘normalizeBetweenArrays’ function of the limma 3.9.19 package (Ritchie et al. Citation2015a) in R language was used to normalize the data, so as to conduct subsequent analysis. Furthermore, clinical indicators with missing values > 50% were identified in clinical phenotypic studies (Zhang et al. Citation2020), and indicators involved in the study included age, sex, lymphatic count, neoplasm histologic grade, M, N, T, race, and tumor stage.
Construction of risk prediction model based on CMS
First, according to the ratio of the training set: valid set = 3:1, the 181 sample data were divided into four random sequences, one of which was taken as the valid sample and the other three as the training samples. Second, based on the training samples with 136 cases, a total of 58 costimulatory molecules reported to be effective in previous studies (Croft et al. Citation2013; Janakiram et al. Citation2015; Schildberg et al. Citation2016; Dostert et al. Citation2019; Song et al. Citation2019) were included in the univariate Cox hazard ratio regression analysis in the R survival package. Subsequently, the significant correlation genes (P < 0.05) were selected for subsequent modeling. Third, the training set with genes significantly related to overall survival (OS) in univariate Cox analysis was further randomly divided into four parts, of which three parts were arbitrarily selected as the training set (102 cases), and the remaining part was used as the test set (32 cases). Furthermore, the training set was put into the survival package progressive Cox risk proportional regression model (Zhang et al. Citation2020) for 4-fold cross validation (Cawley and Talbot Citation2008), and the test set was used to calculate the area under the curve (AUC) value of the model (R 4.0.2ROCR package)(Citation2005). The model with the best AUC value was selected as the risk prediction model for the CMS. Besides, the 10 PAAD tissue samples and 10 paracancer tissue samples were collected from the department of hepatobiliary surgery, Xijing Hospital, Air Force Military Medical University of the people’s Liberation Army. Reverse Transcription-Polymerase Chain Reaction (RT–PCR) was used to detect the differential expression of significant correlation genes, and the primers were showed in Table . This study was approved by the Ethic Committees of the First Affiliated Hospital of people’s Liberation Army Air Force Military Medical University.
Table 1. Primers used in RT-PCR.
Validation of CMS model
The validation of the CMS model was conducted based on the training samples (136 cases), valid samples (45 cases), and total samples (181 cases), as well as the dataset of GSE57495 (including 51 cases) (https://www.ncbi.nlm.nih.gov/geo/query/acc.cgi?acc=GSE57495). Briefly, the R language survival package (Version 3.10.3, http://www.bioconductor.org/packages/release/bioc/html/survival.html) was used for survival analysis. The log-rank test provided in the package was used to estimate the survival probability of multiple subtypes (age, sex, and clinical stage) in the two groups (high risk vs. low risk; P < 0.05) (Pohar and Stare Citation2006).
The analysis of the stability of CMS
To explore the stability of the CMS model, univariate and multivariate Cox analyses (Zhang et al. Citation2020) were performed based on the clinical phenotypic data (including age, sex, lymphatic count, neohistologic grade, M, N, T, race, and tumor stage) and survival characteristics (including stage and tumor stage) of 181 PAAD patients. Additionally, in order to further determine whether the risk score is an independent factor of CMS, we selected the clinical phenotypes (P < 0.05) that were significantly correlated with the single factor above for the alignment diagram, which could predict the interrelationships among different variables in the model. The survival package and RMS package of R language (Jr Citation2015) were used to establish the multi-factor Cox proportional risk regression model, and the nomogram function was used for histogram analysis.
Enrichment analysis and identification of differentially expressed genes (DEGs)
The t-test in the limma package (Version 3.10.3) (Ritchie et al. Citation2015b) was used to calculate DEGs between the high- and low-risk groups. P < 0.01 and |Log FC| > 1 were defined as DEGs.
Functional and pathway enrichment analyses based on CMS-related genes were conducted using GO and KEGG with the ClusterProfiler package (Yu et al. Citation2012) in R language. A false discovery rate (FDR) < 0.05 was considered as significant enrichment.
Immune cell infiltration analysis
Based on the mRNAseq data of 181 PAAD samples from TCGA, the fractions of 22 immune cell types were estimated using the deconvolution method (Cameron et al. Citation1981) of the CIBERSORT (R 4.0.2) package (Chen et al. Citation2018). After calculating the proportion of immunoinfiltrating cells, the Mann–Whitney U test was used to analyze the differences between high- and low-risk groups (P < 0.05).
Mutational analysis
Based on the existing somatic mutation data of PAAD in TCGA, the Maftools (Mayakonda et al. Citation2018) package of R language was utilized for gene mutation analysis, and the TOP20 mutant genes were displayed.
Statistical analysis
The prognostic significance of the CMS between the high- and low-risk groups were calculated with Kaplan-Meier curves with the log-rank test. And the Mann–Whitney U test was used to analyze the differences between high- and low-risk groups. Other data analyses were conducted using R software version 3.5.1 (https://www.r-project.org).
Results
The prognostic value of costimulatory molecule genes in PAAD
Univariate Cox risk proportional regression analysis of the gene expression matrix in 136 training samples revealed that 16 genes were observably associated with OS (P < 0.05; Table ). Among these genes, 14 genes, namely TNFSF10, TNFRSF10A, TNFRSF21, TNFRSF10B, FAS, TNFSF11, VTCN1, HHLA2, TNFRSF11B, LTBR, EDAR, TNFSF9, TNFSF13, and TNFRSF12A, were risk factors for OS (HRS > 1), and 2 genes, namely EDA and NGFR, were protective factors for OS (HRS < 1).
Table 2. Univariate Cox analysis of costimulatory molecule genes in TCGA Cohort of PAAD.
Identification of CMS for PAAD prognosis
To establish CMS for PAAD prognosis, the Cox proportional hazards regression model was used to construct a prognostic model. Five risk score formulas for predicting PAAD patient survival were developed (Table ). Moreover, the CVLIST2 model with AUC = 0.73 was the best CMS risk prediction model (Figure ), and the formula was as follows: risk score = (0.5758*TNFSF10) + (−0.5364*EDA) + (0.5161*FAS) + (−0.2346*TNFSF9) + (−0.1601*NGFR). Additionally, the expression of the five genes (TNFSF10, EDA, FAS, TNFSF9, and NGFR) in the formula, their risk score distribution, and patient survival status are illustrated in Figure . The results of RT–PCR showed that the TNFSF10 and TNFSF9 were significantly upregulated in PAAD tissue group, while NGFR was significantly downregulated when compared to that in paracancer tissue group (all P < 0.01; Figure ).
Figure 1. Identification of the costimulatory molecule-based signature (CMS). The distribution of risk score, survival status, and the five-gene expression panel (A). Area under the curve (AUC) curves of different models (B).
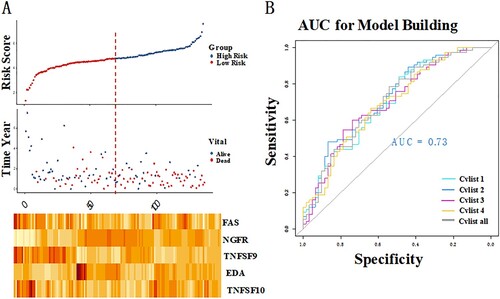
Figure 2. Reverse Transcription-Polymerase Chain Reaction (RT-PCR) used to detect the differential expression of five significant correlation genes in PAAD tissue samples and paracancer tissue samples. **P < 0.01 and ***P < 0.001.
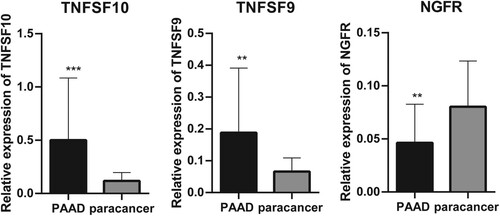
Table 3. The result of model construction (4-fold cross validation).
Evaluation of the value of CMS
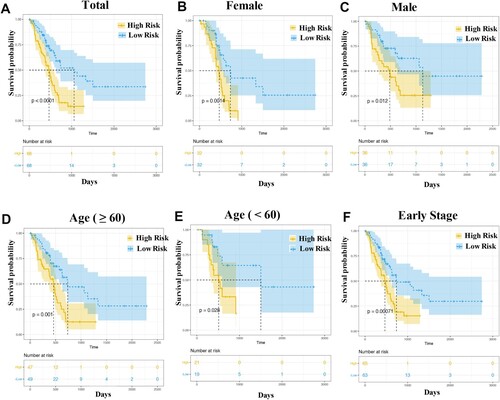
Based on the optimal critical value of Y = 4.7656, 136 patients in the training group were divided into high- (Y > 4.7656, n = 68) and low-risk groups (Y < 4.7656, n = 68). Moreover, to our knowledge, sex, age, and clinical stage were factors that influenced tumor development, and 136 patients were divided into different subgroups based on sex (male or female), age (older [age ≥ 60)] or younger [age < 60], and early clinical stage (stage I and II). Survival analysis demonstrated that all high-risk groups were associated with shorter survival times (all, P < 0.05; Figure ).
Figure 3. Kaplan–Meier curve analysis. The overall survival rate in the high- and low-risk groups of the subgroup, with total patients (A), female patients (B), male patients (C), patients with age ≥ 60 (D), patients with age < 60 (E) and patients at early stage (F), were estimated based on the risk score.
Additionally, validation of the CMS model was conducted in both the valid samples (45 cases) and total samples (181 cases). The results demonstrated that patients in the high-risk group had a shorter survival time than those in the low-risk group in all sample (P = 0.00083; Figure (A)) and GSE57495 dataset (P = 0.014; Figure (C)), respectively. However, there was no significant difference between the two groups in valid sample (P = 0.25; Figure (B)).
Figure 4. Evaluation of the value of CMS. Survival analysis in both total samples (A), valid samples (B), and GSE57495 dataset (C). The proportional-hazards assumption of the nomogram model (C). The area under the curve (AUC) of genes in model and previous studies (E).
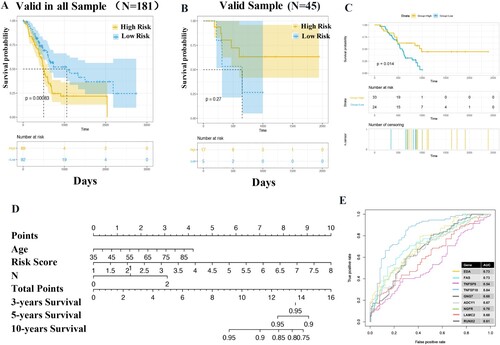
To further investigate whether the signature-based risk score was an independent factor in PAAD patients, univariate and multivariate Cox regression analyses were conducted. In univariate analysis, the risk score, age, histology, and N were associated with the survival time of PAAD patients. More importantly, the risk score was an independent predictor of the prognosis of PAAD (HR = 1.66, 95%CI 1.2645-2.1828, P = 2.70E-04; Table ), along with age (HR = 1.03, 95%CI 1.0060-1.0494, P = 1.20E-02) and N (HR = 1.90, 95%CI 1.1263-3.2014, P = 1.61E-02). The analysis of proportional-hazards assumption of the nomogram model suggested that the risk score had a greater influence on OS in comparison to age and N (Figure (D)), suggesting that the CMS model had high stability.
Table 4. Univariable and multivariable Cox regression analysis of the costimulatory molecule-based signature and survival in TCGA dataset.
Compare the CMS with the previous studies.
Based on the obtained model genes and the 5 genes (GNG7, ADCY1, RUNX2, LAMC2, and NGFR) reported in the previous reports (Wang et al. Citation2009; Agarwal et al. Citation2016; Jin et al. Citation2021), we used pancreatic cancer data and combined with e1071 packet SVM classifier to construct the model. The accuracy of model construction was judged by ROC curve. The results showed that the AUC of four genes in the model of our study was all above 0.70, and all the other genes were superior to other models except TNFSF9 (Figure (E)).
CMS-related genes, biological processes, and pathways
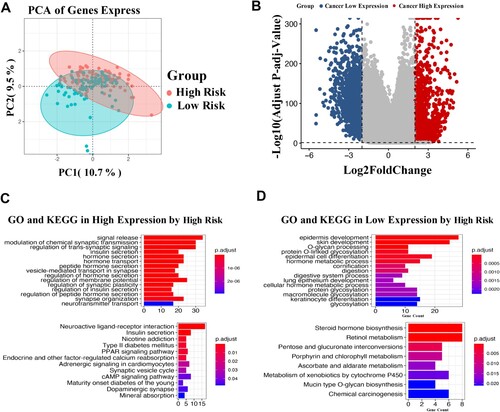
According to the median Y of the CMS model, all samples (181 cases) were divided into high- (89 cases) and low-risk groups (92 cases). Differential analysis showed that 341 DEGs were obtained between the two groups, including 59 upregulated genes and 282 downregulated genes in the high-risk group (Figure (A)). The volcano plot suggested that these DEGs could be significantly distinguished between the high- and low-risk groups (Figure (B)). Functional analysis demonstrated that these positively related genes in the high-risk group were primarily enriched in progress, such as modulation of chemical synaptic transmission and regulation of trans-synaptic, as well as pathways of neuroactive ligand–receptor interaction and PPAR signaling pathways (Figure ).
Figure 5. Differential gene expression analysis in CMS. Principal component analysis described the transcriptome distribution of the sample as a whole (A). Volcano plot of differentially expressed genes (B). GO and KEGG analyses of the highly expressed genes (C) and lowly expressed genes (D). The number of DEGs is shown on the X axis, while GO terms or KEGG pathway terms are shown on the Y axis.
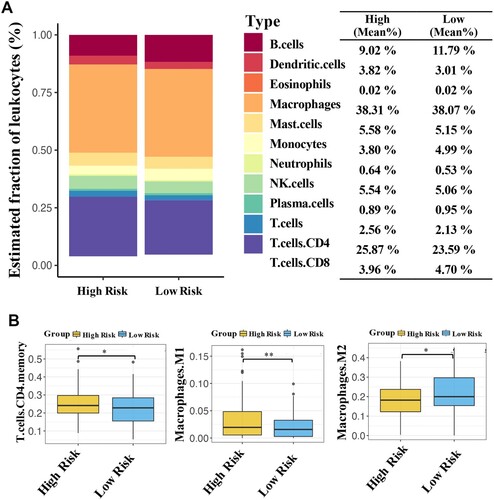
As shown in Figure (A), there is a significant difference in the panorama of immune cells between the two groups. Furthermore, the high-risk patients had an observably higher proportion of M1 macrophages and T+ CD4 cells than that of low-risk patients (both, P < 0.05; Figure (B)). In contrast, the proportion of M2 macrophages in high-risk patients was notably downregulated compared to that in low-risk patients (P < 0.05).
Figure 6. CMS-related immune cell infiltration and inflammatory activities. The average proportion of immune cells in the samples (A). Significant differences in the proportion of three immune cells between high- and low-risk patients (B). *P < 0.05 and **P < 0.01.
CMS-related somatic mutation
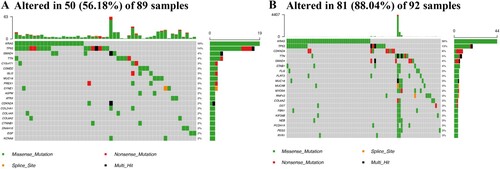
Using the Maftools of the R language, the relationship between CMS and somatic mutations was investigated. The results demonstrated a higher proportion of somatic mutations (88.04%) in the high-risk group than that of the low-risk group (56.18%; Figure ). In particular, KRAS gene expression was altered in both the high- and low-risk groups, which had a higher proportion of somatic mutations in high-risk patients (30%) than in low-risk patients (16%).
Figure 7. CMS-related somatic mutation. The mutant genes in the low- (A) and high-risk groups (B).
Discussion
Early recognition of PAAD is key for timely treatment. Till now, several clinical markers (Henriksen et al. Citation2017; Lee et al. Citation2019; Loosen et al. Citation2019) of PAAD survival have been identified; however, no prognostic signature in PAAD based on costimulatory molecule has been reported. In the present study, based on the costimulatory molecule genes, a novel survival prediction model with AUC = 0.73: Risk score = (0.5758*TNFSF10) + (−0.5364*EDA) + (0.5161*FAS) + (−0.2346*TNFSF9) + (−0.1601*NGFR) was developed. Survival analysis revealed that the CMS risk score could be an independent risk factor for PAAD patients. More importantly, based on the obtained model genes and the 5 genes reported in the previous reports (Wang et al. Citation2009; Jin et al. Citation2021; Zhang et al. Citation2021), ROC curve showed that the AUC of four genes in the model of our study was all above 0.70, and all the other genes were superior to other models except TNFSF9. Then, all patients were divided into high- and low-risk groups based on the median Y of the CMS model. Differential analysis showed that there were 341 DEGs between the two groups, and functional analysis demonstrated that these positively related genes in the high-risk group were mainly enriched in modulation of chemical synaptic transmission, and regulation of trans-synaptic signaling process. Immune cell infiltration analysis suggested that the patients in the high-risk group had higher proportions of M1 macrophages and T+ CD4 cells, but a lower proportion of M2 macrophages than that of the low-risk group. Furthermore, mutational analysis revealed that the high-risk group showed a higher proportion of somatic mutations (88.04%) compared with that of the low-risk group (56.18%).
An increasing number of studies have reported that costimulatory molecules are involved in the mutual regulation of tumor cells and their microenvironment in tumor pathological processes (Sun et al. Citation2010). In this study, based on the 60 costimulatory molecules reported to be effective in previous studies (Croft et al. Citation2013; Janakiram et al. Citation2015; Schildberg et al. Citation2016; Dostert et al. Citation2019; Song et al. Citation2019), five genes, namely TNFSF10, EDA, FAS, TNFSF9, and NGFR were included in the construction of the CMS risk prediction model, and the risk score of this CMS model could be an independent risk factor for PAAD patients. TNFSF9 and TNFSF 10, members of the tumor necrosis factor (TNF) ligand family, can induce tumor cell apoptosis (Philipp et al. Citation2016; Wu et al. Citation2020). A recent study reported that TNFSF10 might be a TNF, and TNFSF10 overexpression is a positive predictor of survival time in patients with clear CRCC (Shi et al. Citation2021). Similarly, TNFSF9 is highly expressed in tumors and can be a prognostic biomarker (Wu et al. Citation2021). EDA is reported to be a virulence gene in X-linked hypohidrotic ectodermal dysplasia (Citation1996). Moreover, EDA has been regarded as a unique signaling molecule in the TNF family (Kowalczyk-Quintas et al. Citation2014). FAS is involved in the apoptotic system, which is upregulated in human cancers (Chang et al. Citation2010). As a transmembrane protein receptor for the neurotrophin family, NGFR is reported to be a tumor suppressor in different tumors (Fernández-Nogueira et al. Citation2016). Furthermore, it has also been reported to act as a good prognostic indicator in basal patients (Reis-Filho et al. Citation2006). The potential effect of these genes has been investigated in various cancers, however, the combination and functions of these molecules have not been explored until now.
To further explore the molecular mechanism of action of CMS, the progress of CMS-related genes might be involved. In particular, the positively related genes in the high-risk group were mainly enriched in the processes of modulation of chemical synaptic transmission and regulation of trans-synaptic signaling. Synaptic plasticity includes multiple aspects, including synaptic modification, synaptic signaling, and synaptic structural changes (Nie and Yang Citation2017). Our data suggest that modulation of the processes of synaptic plasticity-related synapses and chemical synaptic transmission might be a possible underlying mechanism for the CMS-related genes in PAAD. To our knowledge, the immune microenvironment, which is infiltrated by immune cells, has a significant impact on the development of cancer (Li et al. Citation2017). In this study, our findings demonstrated that patients in the high-risk group had observably higher proportions of M1 macrophages and T+ CD4 cells. In the TME, M1 macrophages are involved in suppressing tumor progression by inducing an inflammatory state and increasing the expression of pro-inflammatory mediators (Murray and Wynn Citation2011). CD4+ T cells are the predominant T cell subset, which can diminish in circulation and tumor tissues in pancreatic cancer patients compared to healthy controls (Janakiram et al. Citation2017). Our findings indicated that CMS high-risk patients appeared to exhibit a high immune cell infiltration microenvironment.
In conclusion, this study is the first to investigate the prognostic value of CMS in PAAD patients. The CMS risk prediction model, including five genes of TNFSF10, EDA, FAS, TNFSF9, and NGFR, was constructed, and the risk score of this CMS model could be an independent risk factor for PAAD patients. Indeed, further experimental analysis is required to validate these results.
Supplemental Material
Download TIFF Image (1.3 MB)Acknowledgements
Zhengcai Liu conceived and designed the research, and Min Zhu participated in the acquisition of data. Rui Ding performed the analysis and interpretation of data. Xiao Li and Zhi Yang participated in the study design and performed the statistical analyses. Chao Wu and JingYue Yang conceived the study, participated in its design and coordination, and helped draft the manuscript and revised the manuscript for important intellectual content. All authors read and approved the final manuscript.
Disclosure statement
No potential conflict of interest was reported by the author(s).
Data availability statement
The data that support the findings of this study are available in UCSC Xena of TCGA database at http://xena.ucsc.edu, reference (Zweig et al. Citation2008), as well as GSE57495 dataset in GEO database at https://www.ncbi.nlm.nih.gov/geo/query/acc.cgi?acc=GSE57495 (doi: 10.1371/journal.pone.0133562), and the raw data of RT–PCR are available at https://figshare.com/s/9de1b322ce2af8fa3b84.
References
- Agarwal S, Loder S, Brownley C, Cholok D, Mangiavini L, Li J, et al. 2016. Inhibition of Hif1α prevents both trauma-induced and genetic heterotopic ossification. Proc Natl Acad Sci U S A. 201515397.
- Bin Z, Guangbo Z, Yan G, Huan Z, Desheng L, Xueguang Z. 2014. Overexpression of B7-H3 in CD133 + colorectal cancer cells is associated with cancer progression and survival in human patients. J Surg Res. 188(2):396–403. doi:10.1016/j.jss.2014.01.014.
- Cameron DG, Moffatt DJ, Mantsch HH, Kauppinen JK. 1981. Fourier self-deconvolution: A method for resolving intrinsically overlapped bands. Appl Spectrosc. 35(3):271–276.
- Catalano V, Turdo A, Di Franco S, Dieli F, Todaro M, Stassi G. 2013. Tumor and its microenvironment: a synergistic interplay. Sem Cancer Biol. 23:522–532. doi:10.1016/j.semcancer.2013.08.007.
- Cawley GC, Talbot NLC. 2008. Efficient approximate leave-one-out cross-validation for kernel logistic regression. Mach Learn. 71(2-3):243–264.
- Chang JS, Hsu YL, Kuo PL, Chiang LC, Lin C. 2010. Upregulation of Fas/Fas ligand-mediated apoptosis by gossypol in an immortalized human alveolar lung cancer cell line. Clin Exper Pharmacol Physiol. 31(10):716–722.
- Chen B, Khodadoust MS, Liu CL, Newman AM, Alizadeh AA. 2018. Profiling tumor infiltrating immune cells with CIBERSORT. Methods Mol Biol. 1711:243.
- Choi C, Bakir I, Hart A, Graham T. 2017. Clonal evolution of colorectal cancer in IBD. Nat Rev Gastroenterol Hepatol. 14(4):218–229. doi:10.1038/nrgastro.2017.1.
- Crawford H, Pasca di Magliano M, Banerjee S. 2019. Signaling networks that control cellular plasticity in pancreatic tumorigenesis, progression, and metastasis. Gastroenterology. 156(7):2073–2084. doi:10.1053/j.gastro.2018.12.042.
- Croft M, Benedict C, Ware C. 2013. Clinical targeting of the TNF and TNFR superfamilies. Nat Rev Drug Discov. 12(2):147–168. doi:10.1038/nrd3930.
- Dostert C, Grusdat M, Letellier E, Brenner D. 2019. The TNF family of ligands and receptors: communication modules in the immune system and beyond. Physiol Rev. 99(1):115–160. doi:10.1152/physrev.00045.2017.
- Fernández-Nogueira P, Bragado P, Almendro V, Ametller E, Rios J, Choudhury S, et al. 2016. Differential expression of neurogenes among breast cancer subtypes identifies high risk patients. Oncotarget. 7(5):5313–5326. doi:10.18632/oncotarget.6543.
- Ferri M, Saez M, Figueras J, Fort E, Sabat M, López-Ben S, et al. 2016. Improved pancreatic adenocarcinoma diagnosis in jaundiced and non-jaundiced pancreatic adenocarcinoma patients through the combination of routine clinical markers associated to pancreatic adenocarcinoma pathophysiology. PloS One. 11(1):e0147214. doi:10.1371/journal.pone.0147214.
- Henriksen S, Madsen P, Larsen A, Johansen M, Pedersen I, Krarup H, et al. 2017. Cell-free DNA promoter hypermethylation in plasma as a predictive marker for survival of patients with pancreatic adenocarcinoma. Oncotarget. 8(55):93942–93956. doi:10.18632/oncotarget.21397.
- Hua D, Sun J, Mao Y, Chen L, Wu Y, Zhang X. 2012. B7-H1 expression is associated with expansion of regulatory T cells in colorectal carcinoma. World J Gastroenterol. 18(9):971–978. doi:10.3748/wjg.v18.i9.971.
- Janakiram M, Chinai J, Zhao A, Sparano J, Zang X. 2015. HHLA2 and TMIGD2: new immunotherapeutic targets of the B7 and CD28 families. Oncoimmunology. 4(8):e1026534. doi:10.1080/2162402x.2015.1026534.
- Janakiram N, Mohammed A, Bryant T, Ritchie R, Stratton N, Jackson L, et al. 2017. Loss of natural killer T cells promotes pancreatic cancer in LSL-Kras mice. Immunology. 152(1):36–51. doi:10.1111/imm.12746.
- Jin G, Ruan Q, Shangguan F, Lan L. 2021. RUNX2 and LAMC2: promising pancreatic cancer biomarkers identified by an integrative data mining of pancreatic adenocarcinoma tissues. Aging. 13. doi:10.18632/aging.203589.
- Jr F. 2015. rms: Regression Modeling Strategies.
- Kere J, Srivastava AK, Montonen O, Zonana J, Thomas N, Ferguson B, Munoz F, Morgan D, Clarke A, Baybayan P, et al. 1996. X–linked anhidrotic (hypohidrotic) ectodermal dysplasia is caused by mutation in a novel transmembrane protein. Nat Genet. 13(4):409–416.
- Kowalczyk-Quintas C, Willen L, Dang A, Sarrasin H, Tardivel A, Hermes K, et al. 2014. Generation and characterization of function-blocking anti-ectodysplasin A (EDA) monoclonal antibodies that induce ectodermal dysplasia. J Biol Chem. 289(7):4273–4285. doi:10.1074/jbc.M113.535740.
- Lee B, Lipton L, Cohen J, Tie J, Javed A, Li L, et al. 2019. Circulating tumor DNA as a potential marker of adjuvant chemotherapy benefit following surgery for localized pancreatic cancer. Ann Oncol Off J Eur Soc Med Oncol. 30(9):1472–1478. doi:10.1093/annonc/mdz200.
- Li T, Fan J, Wang B, Traugh N, Chen Q, Liu J, et al. 2017. TIMER: A web server for comprehensive analysis of tumor-infiltrating immune cells. Cancer Res. 77(21):e108–e110. doi:10.1158/0008-5472.can-17-0307.
- Loosen S, Tacke F, Püthe N, Binneboesel M, Wiltberger G, Alizai P, et al. 2019. High baseline soluble urokinase plasminogen activator receptor (suPAR) serum levels indicate adverse outcome after resection of pancreatic adenocarcinoma. Carcinogenesis. 40(8):947–955. doi:10.1093/carcin/bgz033.
- Mayakonda A, Lin D, Assenov Y, Plass C, Koeffler H. 2018. Maftools: efficient and comprehensive analysis of somatic variants in cancer. Genome Res. 28(11):1747–1756. doi:10.1101/gr.239244.118.
- Murray P, Wynn T. 2011. Protective and pathogenic functions of macrophage subsets. Nat Rev Immunol. 11(11):723–737. doi:10.1038/nri3073.
- Neoptolemos J, Kleeff J, Michl P, Costello E, Greenhalf W, Palmer D. 2018. Therapeutic developments in pancreatic cancer: current and future perspectives. Nat Rev Gastroenterol Hepatol. 15(6):333–348. doi:10.1038/s41575-018-0005-x.
- Nie J, Yang X. 2017. Modulation of synaptic plasticity by exercise training as a basis for ischemic stroke rehabilitation. Cell Mol Neurobiol. 37(1):5–16. doi:10.1007/s10571-016-0348-1.
- Niki A Ottenhof ANAM, Morsink FHM, Drillenburg P, W ten Kate FJ, Maitra A, Johan Offerhaus G. 2009. Pancreatic intraepithelial neoplasia and pancreatic tumorigenesis: of mice and men. Arch Pathol Lab Med. 133(3):375.
- Philipp S, Sosna J, Adam D. 2016. Cancer and necroptosis: friend or foe? Cell Mol Sci CMLS. 73:2183–2193. doi:10.1007/s00018-016-2193-2.
- Pohar M, Stare J. 2006. Relative survival analysis in R. Comput Meth Progr Biomed. 81(3):272–278.
- Rahib L, Smith B, Aizenberg R, Rosenzweig A, Fleshman J, Matrisian L. 2014. Projecting cancer incidence and deaths to 2030: the unexpected burden of thyroid, liver, and pancreas cancers in the United States. Cancer Res. 74(11):2913–2921. doi:10.1158/0008-5472.can-14-0155.
- Reis-Filho J, Steele D, Di Palma S, Jones R, Savage K, James M, et al. 2006. Distribution and significance of nerve growth factor receptor (NGFR/p75NTR) in normal, benign and malignant breast tissue. Mod Pathol Off J US Canad Acad Pathol. 19(2):307–319. doi:10.1038/modpathol.3800542.
- Ritchie M, Phipson B, Wu D, Hu Y, Law C, Shi W, et al. 2015a. Limma powers differential expression analyses for RNA-sequencing and microarray studies. Nucl Acids Res. 43(7):e47. doi:10.1093/nar/gkv007.
- Ritchie ME, Belinda P, Wu D, Hu Y, Law CW, Wei S, et al. 2015b. Limma powers differential expression analyses for RNA-sequencing and microarray studies. Nucl Acids Res. 43(7):e47.
- Schildberg F, Klein S, Freeman G, Sharpe A. 2016. Coinhibitory pathways in the B7-CD28 ligand-receptor family. Immunity. 44(5):955–972. doi:10.1016/j.immuni.2016.05.002.
- Shi B, Ding J, Qi J, Gu Z. 2021. Characteristics and prognostic value of potential dependency genes in clear cell renal cell carcinoma based on a large-scale CRISPR-Cas9 and RNAi screening database DepMap. Intern J Med Sci. 18(9):2063–2075. doi:10.7150/ijms.51703.
- Siegel R, Miller K, Jemal A. 2019. Cancer statistics, 2019. CA Cancer J Clinic. 69(1):7–34. doi:10.3322/caac.21551.
- Siegel R, Miller K, Jemal A. 2020. Cancer statistics, 2020. CA Cancer J Clinic. 70(1):7–30. doi:10.3322/caac.21590.
- Sing T, Sander O, Berrenwinkel N, Lengauer T. 2005. ROCR: visualizing classifier performance in R. BIOINFORMATICS -OXFORD-.
- Song Q, Shang J, Yang Z, Zhang L, Zhang C, Chen J, et al. 2019. Identification of an immune signature predicting prognosis risk of patients in lung adenocarcinoma. J Translat Med. 17(1):70. doi:10.1186/s12967-019-1824-4.
- Sun J, Chen L, Zhang G, Jiang J, Zhu M, Tan Y, et al. 2010. Clinical significance and regulation of the costimulatory molecule B7-H3 in human colorectal carcinoma. Cancer Immunol Immunother: CII. 59(8):1163–1171. doi:10.1007/s00262-010-0841-1.
- Tang J, Jiang W, Liu D, Luo J, Wu X, Pan Z, et al. 2018. The comprehensive molecular landscape of the immunologic co-stimulator B7 and TNFR ligand receptor families in colorectal cancer: immunotherapeutic implications with microsatellite instability. Oncoimmunology. 7(10):e1488566. doi:10.1080/2162402x.2018.1488566.
- Wang W, Zhao H, Zhang S, Kang E, Chen Y, Ni C, et al. 2009. Patterns of expression and function of the p75(NGFR) protein in pancreatic cancer cells and tumours. J European Soc Surg Oncol Brit Assoc Surg Oncol. 35(8):826–832. doi:10.1016/j.ejso.2008.10.013.
- Wu J, Wang Y, Jiang Z. 2020. Fusobacterium nucleatumImmune induction identified by TMT proteomics analysis in autoinducer-2 treated macrophages. Expert Rev Proteom. 17(2):175–185. doi:10.1080/14789450.2020.1738223.
- Wu J, Wang Y, Jiang Z. 2021. TNFSF9 is a prognostic biomarker and correlated with immune infiltrates in pancreatic cancer. J Gastrointest Cancer. 52(1):150–159. doi:10.1007/s12029-020-00371-6.
- Yan Y, Gao R, Trinh T, Grant M. 2017. Immunodeficiency in pancreatic adenocarcinoma with diabetes revealed by comparative genomics. Clin Cancer Res Off J Amer Assoc Cancer Res. 23(20):6363–6373. doi:10.1158/1078-0432.ccr-17-0250.
- Yu G, Wang LG, Han Y, He QY. 2012. Clusterprofiler: an R package for comparing biological themes among gene clusters. Omics-a J Integr Biol. 16(5):284–287.
- Zhang C, Zhang Z, Sun N, Zhang G, Wang F, Luo Y, et al. 2020. Identification of a costimulatory molecule-based signature for predicting prognosis risk and immunotherapy response in patients with lung adenocarcinoma. Oncoimmunology. 9(1):1824641. doi:10.1080/2162402x.2020.1824641.
- Zhang Y, Yang J, Wang X, Li X. 2021. GNG7 and ADCY1 as diagnostic and prognostic biomarkers for pancreatic adenocarcinoma through bioinformatic-based analyses. Scient Rep. 11(1):20441. doi:10.1038/s41598-021-99544-x.
- Zweig AS, Karolchik D, Kuhn RM, Haussler D, Kent WJ. 2008. UCSC genome browser tutorial. Genomics. 92(2):75–84.