
Abstract
This study aimed to explore the candidate genes associated with simple steatosis (SS) using integrated bioinformatics analysis. Data in GSE89632 were used to identify differentially expressed genes (DEGs) between SS and healthy controls (HC). Kyoto Encyclopedia of Genes and Genomes (KEGG) pathway enrichment analysis for DEGs was conducted. Protein–protein interactions (PPI) network and transcription factor (TF)-gene network were constructed, followed by pathway analysis. Drug-gene interactions were also predicted. Finally, the expression level of hub genes was verified using GSE126848 and quantitative real-time PCR (qRT-PCR). A total of 418 (139 up-regulated and 279 down-regulated) DEGs were identified between SS and HC groups. PPI analysis revealed that FOS, MYC, IL1B, and EGR1 might be considered as hub genes. Pathway analysis showed that these genes were mainly involved in TNF signaling pathway. Drug-gene interaction analysis identified six gene targets (PTGS2, IL1B, MMP9, CCL2, JUN, and IL6) and 38 small molecules. Further experimental verification confirmed that the expression level of FOS, MYC, IL1B, and EGR1 was significantly down-regulated in the SS samples. In conclusion, these data may provide new insights into the pathogenesis and treatment of SS. These hub genes and candidate drugs may improve the individualized diagnosis and treatment of SS.
Introduction
Nonalcoholic fatty liver disease (NAFLD) is a kind of chronic fatty liver disorder, which is related to insulin resistance, fat deposition, and lipid metabolism (Manne et al. Citation2018). NAFLD includes a series of pathological processes from simple steatosis (SS), through nonalcoholic steatohepatitis (NASH), to fibrosis and ultimately cirrhosis, and even hepatocellular carcinoma (Chalasani et al. Citation2018). It is estimated that 20%–30% of prevalence occurs in patients with NAFLD and will rise in the coming decades especially in those patients association with obesity, hyperlipidaemia, and type 2 diabetes (Lionarons et al. Citation2016). Additionally, it is reported that more than 70% of patients with NAFLD has only SS (a nonmalignant stage) (Farrell and Larter Citation2006). Most patients have a good outcome if SS is identified in the early stages of NAFLD. Hence, it is necessary to identify key genes or biomarkers for detecting disease at an earlier stage; in addition, this is also helpful for the treatment of NAFLD.
At present, the molecular mechanisms of NAFLD or NASH have been reported extensively. For example, Dogru et al. (Citation2008) found that interleukin-6 (IL-6) as a major pro-inflammatory cytokine was significantly induced in the liver tissues of patients with NASH than those with SS. Similarly, in mice fed a high-fat diet, the expression level of IL-6 protein was significantly increased from SS to early NASH (Baumann et al. Citation2020). Moreover, the overexpressed secreted protein, acidic and rich in cysteine (SPARC) induced hepatocellular damage and pro-fibrogenic factor levels in liver, suggesting that SPARC is associated with liver injury and fibrogenic processes in NAFLD (Mazzolini et al. Citation2018). Many studies have indicated that lipogenic and cholesterol metabolic pathways are major actors in the progression of the disease from SS to NASH. For example, squalene epoxidase and cytochrome P450 family 51 subfamily A member 1 are central enzymes in cholesterol biosynthesis; in addition, fatty acid desaturase 1 (FADS1) and FADS2 regulate unsaturation of fatty acids, and FASN improved the synthesis of long-chain saturated fatty acids (Lorbek et al. Citation2015; Wruck et al. Citation2017). Omega-3 polyunsaturated fatty acids association with steatosis, inflammation, and fibrosis are down-regulated in patients with NASH, revealing a key treatment strategy (Jump et al. Citation2017). However, no pharmacological treatment has received approval till now (Chalasani et al. Citation2018). Although some studies have shown to reverse histological abnormalities or reduce clinical endpoints, there have been no successful cases in clinical trials, so we need to screen more candidate genes in the early stage to provide more possibilities for preventing the development of the disease.
In the present study, SS-related gene expression profile was downloaded from Gene Expression Omnibus (GEO) database. First, differentially expressed genes (DEGs) between SS and healthy controls (HC) samples were identified, followed by pathway enrichment analysis. Subsequently, protein–protein interaction (PPI) network was constructed and the transcription factors (TFs) regulated by DEGs were predicted. Next, drug-gene interactions were analyzed. Finally, the expression level of key genes was verified by an independent data set and experiment. According to these investigations, we hope to explore the molecular mechanisms of SS and provide potential targets in the clinical management.
Methods
Microarray data
Gene expression profile GSE89632 reported by Arendt et al. (Citation2015) was downloaded from GEO (http://www.ncbi.nlm.nih.gov/geo/) database, including 20 SS samples, 19 NASH samples, and 24 HC samples. The platform of this dataset was GPL14951 Illumina HumanHT-12 WG-DASL V4.0 R2 expression beadchip. In this study, we used this dataset as a training set to screen potential key genes involved in SS. Thus, we selected 20 SS and 24 HC samples for further analyses. In addition, an independent dataset (GSE126848) was used as the validation set to verify the expression level of identified potential key genes. This gene expression profile included 15 SS and 26 HC samples, which was based on the GPL18573 Illumina NextSeq 500 (Homo sapiens) platform (Suppli et al. Citation2019).
Data preprocessing and identification of DEGs
For GSE89632, the normalized matrix was downloaded from the GEO database and the probes were annotated to gene symbol in accordance with the annotations file. Probes that did not match the gene symbol were removed. In addition, for different probes mapped to the same gene symbol, the average value of these probes was regarded as the final expression value. Subsequently, classical Bayesian method in limma package (version 3.10.3, http://www.bioconductor.org/packages/2.9/bioc/html/limma.html) was used to identify DEG between SS and HC samples. |log fold change (FC)| ≥ 1 and adjusted p-value < 0.05 were defined as the threshold value for DEGs.
Meanwhile, for GSE126848, the raw count matrix was downloaded from the GEO database and the gene ensemble ID was converted into gene symbol according to the annotation information of human genome (GRCh38.p10). Next, the tMemMonitor (TMM) algorithm in the edgeR package (version 3.4, http://www.bioconductor.org/packages/release/bioc/html/edgeR.html) was used to standardize the raw count and convert it into a logCPM value. Furthermore, differential expression analysis was performed to screen the DEGs between SS and HC groups. Genes with adjusted p-value < 0.05 and |logFC| > 0.585 were considered as DEGs.
Pathway enrichment analysis of DEGs
In order to explore the biological function of DEGs, the Kyoto Encyclopedia of Genes and Genomes (KEGG) pathways analysis was performed using enrichment analysis tool DAVID (version 6.8, https://david-d.ncifcrf.gov/). Pathways with p value < 0.05 and count ≥ 2 were considered to be statistically significant.
PPI network construction and module analysis
The interactions among proteins encoded by DEGs were analyzed by using STRING database (version 10.0, http://www.string-db.org/) (Szklarczyk et al. Citation2015). The input gene set was all DEGs and the species was human. PPI interactions only with a combined score > 0.4 (median confidence) were selected. PPI network was constructed using Cytoscape (version 3.2.0, http://www.cytoscape.org/). CytoNCA was used to analyze the topology of node network with parameter set as ‘without weight’ (Tang et al. Citation2015). The key nodes of protein interaction in the PPI network were obtained according to the score ranking of each node. Next, the most significantly clustering modules in the PPI network were identified by using the MCODE plug-in (version1.4.2 http://apps.cytoscape.org/apps/MCODE) (Bandettini et al. Citation2012) in Cytoscape software with the cut-off value of score ≥ 5. Moreover, the KEGG pathway analysis was performed on genes in the module using DAVID.
Prediction of TFs-DEGs interactions
The TFs associated with DEGs in modules were predicted using the iRegulon plug-in (version 1.3, http://apps.cytoscape.org/apps/iRegulon) (Janky et al. Citation2014). The parameter was set to minimum identity between orthologous genes = 0.05 and maximum false discovery rate on motif similarity = 0.001. TFs-target gene interactions with normalized enrichment score (NES) > 4 were selected. In addition, the KEGG pathways analysis of the TFs and genes was conducted by using DAVID (version 6.8, https://david-d.ncifcrf.gov/) (Huang et al. Citation2009). KEGG pathways with the count of enriched gene ≥ 2 and p-value < 0.05 were considered as statistically significant.
Prediction of drug-gene interaction
Drug-Gene Interaction database (DGIdb) is a web resource that can be used to search drug-gene interactions and gene druggability information for human diseases (Wagner et al. Citation2016). In this study, DGIdb2.0 (http://www.dgidb.org/) was used to predict drug-gene interactions based on DEGs in the module. The parameter was set as ‘FDA approved’. Finally, the drug-gene interaction network was visualized by using Cytoscape software.
Expression level of candidate genes in validation set
The expression level of genes in PPI modules was verified using the GEO GSE126848 chip. The genes with the same up- and down-regulation in the two datasets were selected and visualized using a box plot. These genes might be considered as potential hub genes related to SS.
Experimental verification of hub genes
Further, the quantitative real-time polymerase chain reaction (RT-qPCR) assay was performed to determine the mRNA expression level of hub genes. The SS cases and HC participants were recruited from the First Affiliated Hospital of Wenzhou Medical University. These patients were all pathologically diagnosed by liver biopsy. SS patients meeting the following criteria were excluded: (1) they drank more than 20 g/day, (2) they had hepatitis B or C, autoimmune hepatitis, primary biliary cholangitis, or hepatolenticular degeneration, (3) they long-term treated with non-steroidal anti-inflammatory drugs, calcium antagonists, tamoxifen, amiodarone, corticosterone, isoniazid, and methotrexate, (4) pregnant or lactating women, and (5) patients with liver cancer or other benign/malignant tumors. Finally, 30 patients with SS (mean age 46.83 ± 9.02) were included in this analysis. In addition, 20 HC people (mean age 43.82 ± 8.34) were selected. Next, serum samples from these participants were collected, and total RNA was extracted by using an RNAprep pure blood kit (#DP443, TIANGEN, Inc., Beijing, China). The RT-qPCR reactions were performed in an Applied Biosystems 7500 real-time machine (Applied Biosystems, Waltham, MA, USA) by using Power SYBR green PCR Master Mix (Applied Biosystems, Carlsbad, CA). GAPDH was used as the reference and the relative expression of genes was calculated via using the 2−ΔΔCt method. The specific primers of genes are listed in Table S1.
This study was approved by the medical ethics committee of the First Affiliated Hospital of Wenzhou Medical University (2020-246). All participants signed the informed consent before experiment. In addition, the experimental procedures were conducted in accordance with relevant guidelines and regulations.
Statistical analysis
All statistical analyses were performed using GraphPad Prism software (version 6.0, GraphPad, Inc., La Jolla, CA, USA). Data were expressed as the mean ± standard deviation (SD). Moreover, the comparison between HC and SS groups was conducted by the Wilcox test, and P value < 0.05 was considered as statistically significant.
Results
DEGs between SS and HC samples
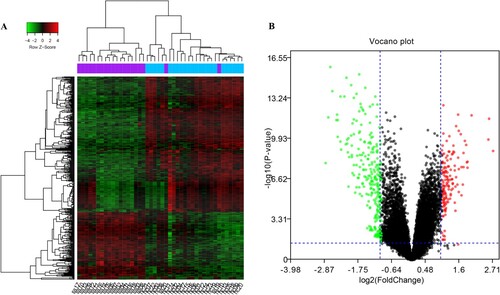
After data normalization, the median of the normalized gene expression value was on the same horizontal line, suggesting that the data could be used for subsequent analysis (Figure S1). A total of 418 DEGs were screened in SS samples compared to HC samples, including 139 up-regulated DEGs and 279 down-regulated DEGs. The heatmap and volcano plot of DEGs are shown in Figure .
Figure 1. Images representing DEGs between SS and HC. (A) Heatmap. Blue columns represent HC samples and purple columns represent SS samples. (B) Volcano plot. Red node indicates up-regulated DEGs and green node indicates down-regulated DEGs. DEGs, differentially expressed genes; HC, healthy control; SS, simple steatosis.
KEGG pathway analysis of DEGs
Pathways analysis showed that up-regulated DEGs were involved in three significant pathways and down-regulated DEGs were involved in 22 significant pathways. The specific results are listed in Table S2. In brief, up-regulated DEGs were mainly involved in systemic lupus erythematosus and glycerolipid metabolism; in addition, down-regulated genes were primarily enriched in TNF signaling pathway and osteoclast differentiation.
Analysis of PPI network and module subnetwork
In the PPI network, 238 nodes and 828 edges were contained (Figure (A)). After calculating the connective degree of genes, we found that genes such as IL-6, jun proto-oncogene, AP-1 transcription factor subunit (JUN), and MYC proto-oncogene, BHLH transcription factor (MYC) had higher degrees than other nodes. In addition, only one significantly enriched module was identified from the PPI network with score ≥ 5. This module (score = 13.571) composed of 15 nodes and 95 interactions (Figure (B)). These nodes are listed in Table . Among these, IL6, JUN, fos proto-oncogene, AP-1 transcription factor subunit (FOS), MYC, and interleukin 8 (IL8) might be considered as hub genes. Pathway analysis showed that genes in module were mainly involved in TNF signaling pathway, Chagas disease (American trypanosomiasis), rheumatoid arthritis, and hepatitis B (Table S3).
Figure 2. PPI prediction and module analysis. (A) PPI network. Yellow node represents up-regulated DEGs and green diamond indicates down-regulated DEGs. (B) Module network. The size of the node represents the degree of node. PPI, protein–protein interaction.
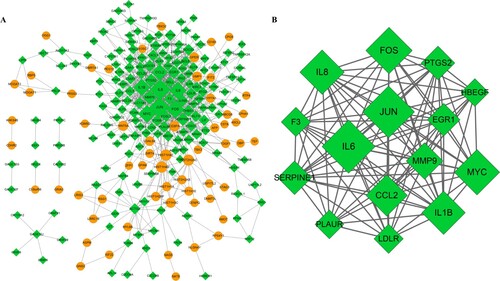
Table 1. Genes in the PPI module analysis.
TFs-target genes regulation network
Based on DEGs in the module, total eight TFs such as EHF, ARNT, CEBPD, MEF2A, NFIC, SRF, POLR2A, and RDBP were predicted. Then, a TF-targets network was constructed, including eight TFs, 15 DEGs, and 61 edges (Figure ). KEGG enrichment analysis revealed that these TFs and DEGs were mainly enriched in 25 significant pathways, such as TNF signaling pathway, Chagas disease (American trypanosomiasis), rheumatoid arthritis, and herpes simplex infection (Table ).
Figure 3. TFs-target genes regulation network. Green diamond indicates down-regulated DEGs and blue hexagon indicates TFs. DEGs, differentially expressed genes; TFs: transcription factors.
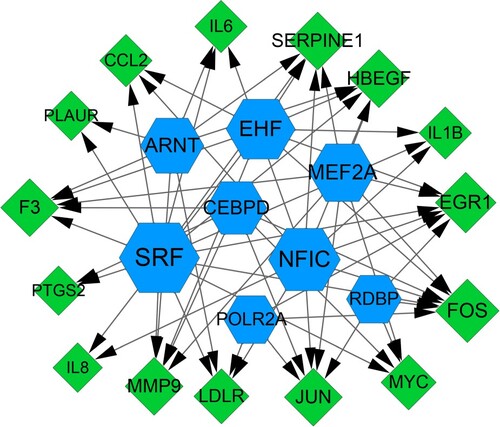
Table 2. KEGG pathway analysis for TFs and module genes.
Identification of drug-gene interaction
According to the DGIdb prediction results of 15 modular genes, we obtained 38 drug-gene interactions, including six down-regulated DEGs [prostaglandin-endoperoxide synthase 2 (PTGS2), interleukin 1B (IL1B), matrix metallopeptidase 9 (MMP9), C–C motif chemokine ligand 2 (CCL2), JUN, and IL6] and 38 drugs (Figure ). The specific interaction relationship is shown in Table . Results revealed that most potential drugs might interact with PTGS2 as inhibitors or antagonist.
Figure 4. Drug-gene interactions network. Green diamond indicates DEGs and white square indicates drug.
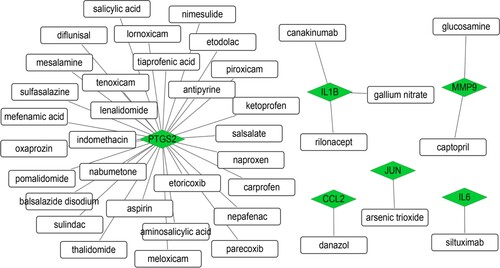
Table 3. Prediction of drug-gene interactions.
Verification of hub genes in a validation set
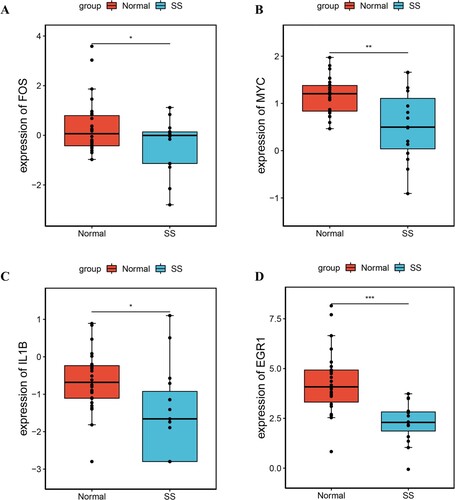
Based on the data in GSE126848, we confirmed that FOS, MYC, IL1B, and early growth response 1 (EGR1) were significantly down-regulated in SS samples (Figure ). The expression levels of these genes were consistent with the results of bioinformatics analysis. Among these, IL1B was an FDA approved drug target.
Figure 5. The expression level of hub genes validated by GSE126848. (A) FOS, (B) MYC, (C) IL1B, and (D) EGR1. Red represents normal group and blue represents SS group. * P value < 0.05 and ** P value < 0.01.
Validation of mRNA expression by qRT-PCR
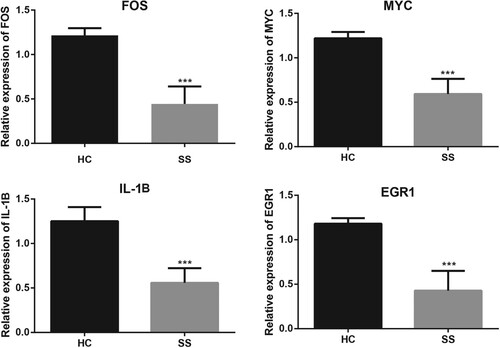
We further performed qRT-PCR assays to determine the expression levels of hub genes (FOS, MYC, IL1B, and EGR1). Results showed that the relative expression levels of the four genes were significantly lower in SS group than in HC group (all P value < 0.001, Figure ). These results were generally consistent with that shown in the bioinformatics analyses.
Figure 6. Validation of mRNA expression level of FOS, MYC, IL-1B, and EGR1 by qRT-PCR. *** P value < 0.001. qRT-PCR, quantitative real-time polymerase chain reaction.
Discussion
Approximately 25–30% of patients with SS will develop NASH, thus it is important to understand its related molecular mechanisms and how to treat or prevent this complex disease. In the present study, we identified the key pathogenic biomarkers involved in the occurrence of SS at the molecular level. A total of 418 DEGs were identified between SS and HC samples, and several hub genes such as MYC, IL1B, EGR1, and FOS were identified from PPI network and its module. In addition, KEGG pathway analysis revealed that these hub genes were mainly involved in TNF signaling pathway. Then, a TF-target network was constructed with eight TFs targeting 15 DEGs. Meanwhile, six down-regulated DEGs and 38 drugs were identified through DGIdb; among which, PTGS2 was associated with most potential drugs. Finally, verification analysis showed that hub genes such as FOS, MYC, IL1B, and EGR1 were down-regulated in SS samples compared with NC samples.
NAFLD is one of the main causes of chronic liver injury, which includes a variety of clinical symptoms from SS to NASH, advanced fibrosis, and cirrhosis (Enomoto et al. Citation2015). Hepatic SS is a benign, non-inflammatory condition that has no adverse consequences in itself. Therefore, it is necessary to screen the genes associated with SS to inhibit the progression of disease. In this analysis, we found that DEGs between SS and HC samples were mainly involved in TNF signaling pathway. Wree et al. (Citation2018) revealed that TNF was key cytokine involved in amplifying and perpetuating the liver damage and fibrosis resulting from NLRP3 activation. Osawa et al. (Citation2018) reported that overexpressed TNF-α in the steatotic liver induced fibrosis and hepatocyte apoptosis in mice with NASH. In addition, the enhanced TNF-α signaling via activating Kupffer cells involved in the pathogenesis of liver fibrosis in a NASH animal model (Tomita et al. Citation2006). Moreover, previous study indicated that TNF might be involved liver homeostasis in the context of a healthy diet (Lana et al. Citation2016), revealing the important role of TNF in liver dysfunction. Taken together, we speculated that genes might affect the development of SS via regulating the TNF signaling pathway. However, there was no study reported the relationship between SS and TNF signaling pathway. Therefore, further studies are needed to confirm this finding.
Though a series of bioinformatics analysis, several genes that may serve a crucial role in the pathogenesis of SS have been identified. In brief, IL1B and EGR1 were considered as hub genes in the PPI analysis, and IL1B was a predicted drug target. The protein encoded by IL1B is an important mediator of the inflammatory response and localized tissue injury repair, which is involved in cell proliferation, differentiation, and apoptosis (Dinarello Citation2009). Nelson et al. (Citation2016) showed that the common variants in IL1B might increase NASH susceptibility and confer a higher risk of hepatic parenchymal damage, including enlarged balloons and bridging fibrosis or cirrhosis. In addition, study reported that endoplasmic reticulum stress induced by environmental pollutants could induce the expression of inflammatory genes (such as IL1B) and potentially triggered the development of NAFLD in male (Qin et al. Citation2020). These studies emphasized the potential role of IL1B in the progression of NAFLD. In this analysis, we observed IL1B was a hub gene in PPI and module networks. Thus, we speculated that IL1B might affect multiple processes involved in the pathogenesis of SS. Drug-genes interaction analysis showed that IL1B was a drug target for SS. Our analysis showed that IL1B was interacted with canakinumab and rilonacept. These drugs were regarded as anti-inflammatory drugs. Tilg et al. (Citation2020) suggested canakinumab might impact NAFLD in humans; however, no data on hepatic steatosis was available from this trial. Another gene, EGR1, evidence indicates the proteins encoded by it are nuclear proteins and function as transcriptional regulators. Li et al. (Citation2019) indicated that EGR1 was negatively correlated with the degree of steatosis and promoted understanding of the molecular mechanisms underlying insulin resistance related to the progression of NAFLD, which might be a novel therapy target for NAFLD. This study suggested a potential relationship between EGR1 and SS.
Furthermore, we also found that PTGS2 targeted by most potential drugs. PTGS2 also named COX-2, is responsible for the prostanoid biosynthesis involved in inflammation and mitogenesis (Cox et al. Citation2004). In addition, genetic variants in COX-2 promoters might play an important role in mediating susceptibility to NAFLD in Chinese populations (Cao et al. Citation2010). Some studies suggested that COX-2 might promote fat accumulation in liver cells, leading to the progression from NAS to NASH (Hui et al. Citation2004; Hsieh et al. Citation2009). COX-2 appears as potential therapeutic strategy against obesity-associated metabolic dysfunction. In this regard, stable analogs of COX-2 could be considered as therapeutic alternatives to prevent steatosis progression and they were clinically used to ameliorate liver pathologies (Korhonen et al. Citation1995). Drug-gene interaction network showed that nimesulide was associated with PTGS2. In an animal experiment, the histopathological examination of mouse liver tissues showed that nimesulide suppressed hepatic steatosis, suggesting that the COX-2 selective inhibitor suppressed hepatic steatosis by suppressing the expression and activation of PPARγ (Tsujimoto et al. Citation2016). Taken together, these studies confirmed that PTGS2 might be a potential therapeutic target for SS. This study had several limitations. The sample size included in this study was small. The patients came from different countries and varied greatly in age. Moreover, the specific functions of each gene in SS pathogenesis were not explored. Therefore, studies with a large sample size are needed to reveal the biological functions of these genes in SS. Although there are some limitations in the present study, the identified genes of SS is helpful for early diagnosis and timely prevention, which can control the disease progression to a certain extent. Moreover, we also predicted the drug-gene interaction, which provided new clues for drug development of SS. Taken together, the research significance of this study should not be ignored.
In conclusion, bioinformatics analyses were conducted to detect several candidate biomarkers and explore molecular mechanisms of SS. Results indicated that several hub genes such as EGR1, IL1B, and PTGS2, together with TNF signaling pathway, may be responsible for the pathogenesis of SS. In addition, some potential targeted drugs related to these hub genes were identified, which may contribute to understanding the mechanisms of SS. Taken together, our study investigated the pathogenesis of SS and provided candidate target genes for SS therapy.
Ethics approval statement
This study was approved by the medical ethics committee of the First Affiliated Hospital of Wenzhou Medical University (2020-246) and all participants signed the informed consent before experiment.
Supplemental Material
Download Zip (132.6 KB)Acknowledgements
Authors contributions: Conception and design of the research: GX; acquisition of data: MM-Y; analysis and interpretation of data: YJ-M; statistical analysis: YJ-M; obtaining funding: GX; drafting the manuscript: YJ-M, MM-Y; revision of manuscript for important intellectual content: GX. All authors read and approved the final manuscript.
Disclosure statement
No potential conflict of interest was reported by the author(s).
Data availability statement
The data that support the findings of bioinformatics analysis are available in GEO database at http://www.ncbi.nlm.nih.gov/geo/ with number GSE89632 and GSE126848. The data supporting the findings of experimental verification are openly available in 4TU. ResearchData at http://do.org/10.4121/16778755.
Additional information
Funding
References
- Arendt BM, Comelli EM, Ma DW, Lou W, Teterina A, Kim T, Fung SK, Wong DK, Mcgilvray I, Fischer SE, Allard JP. 2015. Altered hepatic gene expression in nonalcoholic fatty liver disease is associated with lower hepatic n-3 and n-6 polyunsaturated fatty acids. Hepatology. 61:1565–1578. doi:10.1002/hep.27695.
- Bandettini WP, Kellman P, Mancini C, Booker OJ, Vasu S, Leung SW, Wilson JR, Shanbhag SM, Chen MY, Arai AE. 2012. Multicontrast delayed enhancement (MCODE) improves detection of subendocardial myocardial infarction by late gadolinium enhancement cardiovascular magnetic resonance: a clinical validation study. J Cardiovasc Magn Reson. 14:83. doi:10.1186/1532-429X-14-83.
- Baumann A, Jin CJ, Brandt A, Sellmann C, Nier A, Burkard M, Venturelli S, Bergheim I. 2020. Oral supplementation of sodium butyrate attenuates the progression of Non-alcoholic steatohepatitis. Nutrients. 12:951. doi:10.3390/nu12040951.
- Cao MB, Yang YX, Dong L. 2010. Relationship between single nucleotide polymorphisms in the promoter of COX-2 gene and hereditariness to NAFLD. Chinese J Hepatol. 18:773–777. doi:10.3760/cma.j.issn.1007-3418.2010.10.012.
- Chalasani N, Younossi Z, Lavine JE, Charlton M, Cusi K, Rinella M, Harrison SA, Brunt EM, Sanyal AJ. 2018. The diagnosis and management of nonalcoholic fatty liver disease: practice guidance from the American Association for the Study of Liver Diseases. Hepatology. 67:328–357. doi:10.1002/hep.29367.
- Cox DG, Pontes C, Guino E, Navarro M, Osorio A, Canzian F, Moreno V. 2004. Polymorphisms in prostaglandin synthase 2/cyclooxygenase 2 (PTGS2/COX2) and risk of colorectal cancer. Br J Cancer. 91:339–343. doi:10.1038/sj.bjc.6601906.
- Dinarello CA. 2009. Immunological and inflammatory functions of the interleukin-1 family. Annu Rev Immunol. 27:519–550. doi:10.1146/annurev.immunol.021908.132612.
- Dogru T, Ercin CN, Erdem G, Sonmez A, Tapan S, Tasci I. 2008. Increased hepatic and circulating interleukin-6 levels in human nonalcoholic steatohepatitis. Am J Gastroenterol. 103:3217–3218. doi:10.1111/j.1572-0241.2008.02161_17.x.
- Enomoto H, Bando Y, Nakamura H, Nishiguchi S, Koga M. 2015. Liver fibrosis markers of nonalcoholic steatohepatitis. World J Gastroenterol. 21:7427–7435. doi:10.3748/wjg.v21.i24.7427.
- Farrell GC, Larter CZ. 2006. Nonalcoholic fatty liver disease: from steatosis to cirrhosis. Hepatology. 43:S99–S112. doi:10.1002/hep.20973.
- Hsieh PS, Jin JS, Chiang CF, Chan PC, Chen CH, Shih KC. 2009. COX-2-mediated inflammation in fat is crucial for obesity-linked insulin resistance and fatty liver. Obesity (Silver Spring). 17:1150–1157. doi:10.1038/oby.2008.674.
- Huang DW, Sherman BT, Lempicki RA. 2009. Systematic and integrative analysis of large gene lists using DAVID bioinformatics resources. Nat Protoc. 4:44–57. doi:10.1038/nprot.2008.211.
- Hui AY, Dannenberg AJ, Sung JJ, Subbaramaiah K, Du B, Olinga P, Friedman SL. 2004. Prostaglandin E2 inhibits transforming growth factor beta 1-mediated induction of collagen alpha 1(I) in hepatic stellate cells. J Hepatol. 41:251–258. doi:10.1016/j.jhep.2004.04.033.
- Janky R, Verfaillie A, Imrichová H, Van DSB, Standaert L, Christiaens V, Hulselmans G, Herten K, Naval SM, Potier D. 2014. Iregulon: from a gene list to a gene regulatory network using large motif and track collections. PLoS Comput Biol. 10:e1003731. doi:10.1371/journal.pcbi.1003731.
- Jump DB, Lytle KA, Depner CM, Tripathy S. 2017. Omega-3 polyunsaturated fatty acids as a treatment strategy for nonalcoholic fatty liver disease. Pharmacol Ther. 181. doi:10.1016/j.pharmthera.2017.07.007.
- Korhonen T, Savolainen MJ, Jääskeläinen T, Kesäniemi YA. 1995. Effect of a synthetic prostaglandin E2 analogue, RS-86505-007, on plasma lipids and lipoproteins in patients with moderate hypercholesterolaemia: efficacy and tolerance of treatment and response in different apolipoprotein polymorphism groups. Eur J Clin Pharmacol. 48:97–102. doi:10.1007/bf00192732.
- Lana JP, Martins LB, Oliveira MC, Menezes-Garcia Z, Yamada LT, Vieira LQ, Teixeira MM, Ferreira AV. 2016. TNF and IL-18 cytokines may regulate liver fat storage under homeostasis conditions. Appl Physiol Nutr Metab. 41:1295–1302. doi:10.1139/apnm-2016-0265.
- Li Z, Yu P, Wu J, Tao F, Zhou J. 2019. Transcriptional regulation of early growth response gene-1 (EGR1) is associated with progression of nonalcoholic fatty liver disease (NAFLD) in patients with insulin resistance. Med Sci Monit. 25:2293–3004. doi:10.12659/msm.914044.
- Lionarons DA, Michal H, Van GRF, Alles LK, Van DMVA, Kloek JJ, De WDR, Marsman HA, Henny R, Joanne V. 2016. Simple steatosis sensitizes cholestatic rats to liver injury and dysregulates bile salt synthesis and transport. Sci Rep. 6:31829. doi:10.1038/srep31829.
- Lorbek G, Perše M, Jeruc J, Juvan P, Gutierrezmariscal FM, Lewinska M, Gebhardt R, Keber R, Horvat S, Björkhem I. 2015. Lessons from hepatocyte-specific Cyp51 knockout mice: impaired cholesterol synthesis leads to oval cell-driven liver injury. Sci Rep. 5:8777. doi:10.1038/srep08777.
- Manne V, Handa P, Kowdley KV. 2018. Pathophysiology of nonalcoholic fatty liver disease/nonalcoholic steatohepatitis. Clin Liver Dis. 22:23–37. doi:10.1016/j.cld.2017.08.007.
- Mazzolini G, Atorrasagasti C, Onorato A, Peixoto E, Schlattjan M, Sowa J-P, Sydor S, Gerken G, Canbay A. 2018. SPARC expression is associated with hepatic injury in rodents and humans with non-alcoholic fatty liver disease. Sci Rep. 8:725. doi:10.1038/s41598-017-18981-9.
- Nelson JE, Handa P, Aouizerat B, Wilson L, Vemulakonda LA, Yeh MM, Kowdley KV. 2016. Increased parenchymal damage and steatohepatitis in Caucasian non-alcoholic fatty liver disease patients with common IL1B and IL6 polymorphisms. Aliment Pharmacol Ther. 44:1253–1264. doi:10.1111/apt.13824.
- Osawa Y, Kojika E, Hayashi Y, Kimura M, Nishikawa K, Yoshio S, Doi H, Kanto T, Kimura K. 2018. Tumor necrosis factor-α-mediated hepatocyte apoptosis stimulates fibrosis in the steatotic liver in mice. Hepatol Commun. 2:407–420. doi:10.1002/hep4.1158.
- Qin J, Ru S, Wang W, Hao L, Ru Y, Wang J, Zhang X. 2020. Long-term bisphenol S exposure aggravates non-alcoholic fatty liver by regulating lipid metabolism and inducing endoplasmic reticulum stress response with activation of unfolded protein response in male zebrafish. Environ Pollut. 263:114535. doi:10.1016/j.envpol.2020.114535.
- Suppli MP, Rigbolt KTG, Veidal SS, Heebøll S, Eriksen PL, Demant M, Bagger JI, Nielsen JC, Oró D, Thrane SW, et al. 2019. Hepatic transcriptome signatures in patients with varying degrees of nonalcoholic fatty liver disease compared with healthy normal-weight individuals. Am J Physiol Gastrointest Liver Physiol. 316:G462–g472. doi:10.1152/ajpgi.00358.2018.
- Szklarczyk D, Franceschini A, Wyder S, Forslund K, Heller D, Huertacepas J, Simonovic M, Roth A, Santos A, Tsafou KP. 2015. STRING v10: protein–protein interaction networks, integrated over the tree of life. Nucleic Acids Res. 43:D447–D452. doi:10.1093/nar/gku1003.
- Tang Y, Li M, Wang J, Pan Y, Wu FX. 2015. CytoNCA: a cytoscape plugin for centrality analysis and evaluation of protein interaction networks. Biosystems. 127:67–72. doi:10.1016/j.biosystems.2014.11.005.
- Tilg H, Effenberger M, Adolph TE. 2020. A role for IL-1 inhibitors in the treatment of non-alcoholic fatty liver disease (NAFLD)? Expert Opin Investig Drugs. 29:103–106. doi:10.1080/13543784.2020.1681397.
- Tomita K, Tamiya G, Ando S, Ohsumi K, Chiyo T, Mizutani A, Kitamura N, Toda K, Kaneko T, Horie Y. 2006. Tumour necrosis factor alpha signalling through activation of Kupffer cells plays an essential role in liver fibrosis of non-alcoholic steatohepatitis in mice. Gut. 55:415–424. doi:10.1136/gut.2005.071118.
- Tsujimoto S, Kishina M, Koda M, Yamamoto Y, Tanaka K, Harada Y, Yoshida A, Hisatome I. 2016. Nimesulide, a cyclooxygenase-2 selective inhibitor, suppresses obesity-related non-alcoholic fatty liver disease and hepatic insulin resistance through the regulation of peroxisome proliferator-activated receptor γ. Int J Mol Med. 38:721–728. doi:10.3892/ijmm.2016.2674.
- Wagner AH, Coffman AC, Ainscough BJ, Spies NC, Skidmore ZL, Campbell KM, Krysiak K, Deng P, Mcmichael JF, Eldred JM. 2016. DGIdb 2.0: mining clinically relevant drug–gene interactions. Nucleic Acids Res. 44:D1036–D1044. doi:10.1093/nar/gkv1165.
- Wree A, Mcgeough MD, Inzaugarat ME, Eguchi A, Schuster S, Johnson CD, Peña CA, Geisler LJ, Papouchado BG, Hoffman HM, Feldstein AE. 2018. NLRP3 inflammasome driven liver injury and fibrosis: roles of IL-17 and TNF in mice. Hepatology. 67:736–749. doi:10.1002/hep.29523.
- Wruck W, Graffmann N, Kawala MA, Adjaye J. 2017. Concise review: current status and future directions on research related to nonalcoholic fatty liver disease. Stem Cells. 35:89–96. doi:10.1002/stem.2454.