
Abstract
Objective: This study aimed to explore the molecular mechanisms underlying MU development.
Methods: Six MU and matched para-cancerous scar tissues were collected and subjected to transcriptome sequencing. Differentially expressed genes (DEGs) were screened, followed by function enrichment analysis. Gene set enrichment analysis (GSEA) was performed to investigate changes in pathways. Expression patterns of hub genes were confirmed by quantitative RT–PCR.
Results: A total of 1109 DEGs were identified between MU and para-cancerous scar tissues, including 471 upregulated and 638 downregulated genes. These DEGs mainly participated in extracellular matrix organization-related pathway, cytokine−cytokine receptor interaction, cytokine activity, and IL-17 signalling pathway. GSEA revealed 48 significantly altered pathways. Four common pathways were identified in different enrichment analyses, including PPAR signalling pathway. Among the genes in the PPAR pathway, 18 DEGs were found. Upstream transcription factors RXRG and PPARG were downregulated, while downstream target genes FABP6, OLR1, and MMP1 were upregulated, and FABP3, LPL, and ADIPOQ were downregulated. These results were confirmed by quantitative RT–PCR.
Conclusions: PPARγ-mediated PPAR signalling pathway is important during the development of MU. This study promotes future research on the molecular mechanisms of MU and provides novel insights for the prevention and treatment of this disease.
Highlights:
A total of 1109 DEGs were identified in MU tissue.
These DEGs were mainly involved in extracellular matrix organization and inflammation-associated pathways.
Various enrichment analyses identified four common pathways, including the PPAR signalling pathway.
Introduction
Marjolin ulcers (MU) are a well-defined but rare cutaneous malignancy that usually occurs in traumatized skin, longstanding scars, and chronic wounds (Esther et al., Citation1999), and its malignant development generally originates in burn wounds. Many previous studies have reported that other types of non-healing wounds are also implicated in the malignant development of MU, such as traumatic wounds, osteomyelitis, and fistulas (Pavlovic et al., Citation2011). Well-differentiated squamous cell carcinoma (SCC) is the most common histopathologic type and tends to degenerate malignantly after approximately 25 years on average (Grenier et al., Citation1993; Baldursson et al., Citation1995). The slow transformation of MU results in inadequate treatment, which leads to poor prognosis (Pavlovic et al., Citation2011). Radical surgical excision remains the best choice of treatment (Xiang et al., Citation2019). However, surgical treatment is not suitable for some patients because of the considerable surgical difficulties and high risks (Xiang et al., Citation2019). Hence, the management and control of MU development is pivotal. In other words, there is an urgent need to investigate the molecular mechanisms of malignant degeneration and provide timely and effective therapeutic strategies.
The etiopathogenesis of MU has been investigated for over 100 years, but remains indistinct (Shah & Crane, Citation2022). Several etiological factors have been implicated in the malignant development of MU, such as immune deficiency in chronic scar tissues, which may be vulnerable and prone to malignant transformation (BOSTWICK et al., Citation1976; Kerr-Valentic et al., Citation2009). Long-standing chronic irritation and repeated stimulation of the wound may affect cell proliferation and accelerate spontaneous mutations. Chemokines, especially toxins released by surrounding necrotic tissues, may promote cell mutations (Treves, Citation1930). Mutations in genes involved in cell division and apoptosis are responsible for the increase in the incidence rate of carcinomas. Previous studies have reported that mutations in these genes are detected in patients with MU (Harland et al., Citation1997; Lee et al., Citation2000). The microenvironment of chronic wounds, which is modulated by the immune system, is also involved in the malignant development of MU (Bazaliński et al., Citation2017). In addition, the activity of matrix metalloproteinases and collagen and the function of the epithelium have been reported to be related to MU transformation (Bazaliński et al., Citation2017). Taken together, these studies indicate that the etiopathogenesis of MU is connected to multiple factors, including environmental conditions, immune systems, and genetics; however, the crucial element remains unclear.
RNA sequencing (RNA-seq) is a time-saving and high-throughput approach for transcriptome analysis that has promoted the precise investigation of eukaryotic transcriptomes (Wang et al., Citation2009). RNA-seq-based gene expression analysis has provided novel insights into the underlying molecular mechanisms of multiple diseases, such as osteoarthritis (Shi et al., Citation2019), pediatric acute myeloid leukemia (Shiba et al., Citation2019), coronary artery disease (Wang et al., Citation2021) and diabetes (Gong et al., Citation2017). In this study, we explored the transcriptome profiles of MU cancer and adjacent para-cancerous scar tissues. Genes that were differentially expressed in MU and their functions were investigated. In particular, the key pathways were screened, and the genes in these pathways were investigated. This study could serve as a reference for future research on the degeneration mechanism of MU and provide novel insights into the innovative prevention and therapy of MU.
Materials and methods
Sample collection
From May 2019 to August 2020, ten MU patients who received surgical treatments in the burn department of Beijing Jishuitan Hospital were recruited. Patients were included in this study when met the following two criteria: 1) patients were pathologically diagnosed; 2) patients with squamous cell carcinoma. Patients were excluded when met any of the following criteria: 1) patients with types of cancers other than squamous cell carcinoma; 2) patients who dropped out; 3) patients who failed to sign a consent form. Finally, six patients were included in this study. The details of the included patients were listed in Table S1. A total of 12 tissue samples consisting of six MU cancer tissues and six matched para-cancerous scar tissues were collected from the six MU patients. Informed consent was obtained from all patients. This study was conducted in accordance with the Declaration of Helsinki and was authorized by the Ethics Committee of Beijing Jishuitan Hospital (Approval No. 202203-69). All tissue samples were immediately frozen in liquid nitrogen and stored at −80°c after excision.
RNA extraction and library construction
Total RNA was isolated from all tissue samples using TRIzol® Reagent (Invitrogen), as described in the manufacturer's manual. RNA quantity and quality were assessed using a NanoDrop 2000 (Thermo Fisher Scientific) and 2100 Bioanalyzer (Agilent Technologies), respectively. Agarose gel electrophoresis was used to confirm RNA integrity. All RNA samples were stored at −80°C. The TruSeq® RNA Library Prep Kit v2 (Illumina) was used to construct the RNA-seq libraries, and subsequent paired-end sequencing of these libraries was conducted on the HiSeq/MiSeq Illumina sequencing platform.
Raw data filtering and transcriptome assembly
To obtain high-quality clean reads, SeqPrep software (Sturm et al., Citation2016) and Sickle software (Piel et al., Citation2017) were employed to remove the low-quality raw reads using the following four strategies: 1) reads with adapters and adapter-polluted reads were removed; 2) after trimming the low quality bases (Q < 30) from the 3 ‘end of the reads, there were still bases with quality score Q less than 10 in the reads, and the reads were excluded; 3) reads with a frequency of unrecognized bases of more than 10% were filtered out; and 4) reads with a length of less than 50 base pairs after trimming were removed. The remaining reads were considered as clean reads, and the quality of these reads was evaluated using fastx_toolkit_0.0.14 software (version: 0.0.14). The clean reads were aligned with the genome of Homo sapiens (GRCh38.p13), which was regarded as the reference genome, using HISAT software (version 2.1.0) (Kim et al., Citation2015) under default parameters. StringTie software (version 1.3.3b) (Pertea et al., Citation2015) was used to further reconstruct the transcriptome of the RNA-seq reads. Protein databases, including NCBI_NR, Swiss-Prot, Pfam, COG, GO, and KEGG, were used to annotate the assembled transcriptome.
Identification of DEGs
To obtain the expression profiles, the read counts of individual genes were calculated using RSEM software (version: 1.3.1) (Li & Dewey, Citation2011). The transcripts per kilobase million (TPM) were calculated based on the read counts, which represent the expression level of each gene. The DEGs between the cancer tissue samples and the para-cancerous scar tissue samples were identified on the basis of the TPM via the edgeR R package (version: 3.28.0) (Robinson et al., Citation2010). The absolute value of the logarithmic fold change (|logFC|) >2 and a p-value <0.05 indicated that the corresponding gene was differentially expressed between the cancer tissue samples and the para-cancerous scar tissue samples.
Functional enrichment analysis
KEGG (Kanehisa & Goto, Citation2000) and GO (Citation2019) are two powerful and pragmatic databases that uncover the biological functions of the genes of interest. The DEGs between the cancer tissue samples and para-cancerous scar tissue samples were submitted to the KEGG and GO databases for enrichment analysis using the clusterProfiler tool (version: 3.16.0) (Yu et al., Citation2012). Enriched gene counts ≥2 and p <0.05 were considered to be significantly enriched pathways.
Gene set enrichment analysis (GSEA)
Based on the reference KEGG pathway gene sets (c2.cp.kegg.v7.2.symbols.gmt) from the MSigDB database, GSEA was performed for all genes (ranked by LogFC descending) using the clusterProfiler tool, followed by Benjamini-Hochberg corrections. KEGG pathways with an adjusted p <0.05 was selected.
Construction of the PPI network
To explore the protein–protein interactions (PPI) network in the intricate biological system, the Search Tool for the Retrieval of Interacting Genes/Proteins (STRING) database (version: 11.0) (Keshava Prasad et al., Citation2009) was employed to uncover potential interactions among the DEGs. The threshold of the PPI confidence score was set to 0.4, which is a commonly used value. Based on the data provided by the STRING database, the Cytoscape software (version 3.6.1) (Shannon et al., Citation2003) was used to construct the PPI network.
Verification of the transcriptome analysis
Total RNA was isolated from all tissue samples using TRIzol® Reagent (Invitrogen), as described in the manufacturer's manual. First-strand cDNA was synthesized using the PrimeScript™ RT Master Mix (Perfect Real Time) (Takara Biomedical Technology), as described in the manual. Gene-specific primers are listed in Table S2. PowerUp SYBR Green PCR Master Mix (Thermo) was used to conduct quantitative PCR as described in the manual. Quantitative PCR was carried out on an Applied Biosystems 7900HT Fast Real-Time PCR system (Applied Biosystems, USA) with 10-µL volumes comprised of 5 µL PowerUp SYBR Green PCR Master Mix, 0.2 µL forward primer, 0.2 µL reverse primer, 1 µL cDNA, and 3.6 µL RNase free water. The assay was conducted in triplicate for each sample. GAPDH was used as a reference gene.
Statistical analysis
R version 4.0.5 was used for all bioinformatics analyses. Quasi-likelihood (QL) F-test provided in edgeR package was used for differential expression analysis. DEGs was selected using |log2 FC|>2 and P <0.05. The ‘ggplot2’package and ‘pheatmap’ package were used to generate volcano plot and heatmap, respectively. Benjamini-Hochberg method was used for multiple tests correction in GSEA. Data in quantitate RT–PCR was presented as mean ± standard deviation, and were statistically analyzed using GraphPad Prism 8.0. Expression of genes between two groups were compared using t-test. P < 0.05 was used to show statistical significance.
Results
Mapping results of the RNA-seq data
A total of 606,820,478 paired-end raw reads were obtained for the 12 tissue samples, ranging from 48,738,424–55,553,030 for each tissue sample (Table ). Among these reads, 308,404,500 raw reads were generated from the six cancer tissue samples, and 298,415,978 raw reads belonged to the six para-cancerous scar tissue samples. On average, 50.6 million raw reads were obtained from each tissue sample. Only 0.7% of the raw reads were ruled out by filtration of the raw data, and the Q30 of each sample was more than 93%. These results suggest that our data were of high quality. Based on the alignment using HISAT software, 95.38% of the clean reads were mapped to the reference genome of Homo sapiens (GRCh38.p13), ranging from 94.16–96.29% of the reads for each sample. Additionally, 91.32% of the clean reads were uniquely mapped to the reference genome (Table ).
Table 1. Descriptive statistics of RNA-seq data.
Identification of DEGs
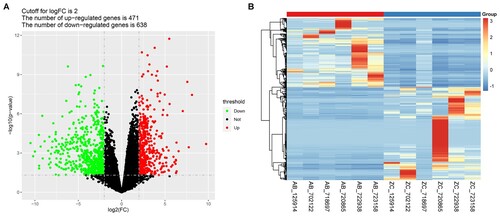
A total of 1109 DEGs were identified between the cancer tissue samples and the para-cancerous scar tissue samples, consisting of 471 upregulated genes and 638 downregulated genes (Figure A, Table S3). The heat map of hierarchical clustering analysis visually showed the detailed expression levels of the DEGs in different samples (Figure B).
Figure 1. Identification of the Differentially Expressed Genes. A) Volcano plots of differentially expressed genes (DEGs) between the cancer tissues and the para-cancerous scar tissues. The red and green dots indicate the significantly upregulated and downregulated genes, respectively. B) Hierarchical clustering analysis of the DEGs. AB represents the MU tumor tissue samples, while ZC represents the matched para-cancerous scar tissues.
Functional enrichment for DEGs
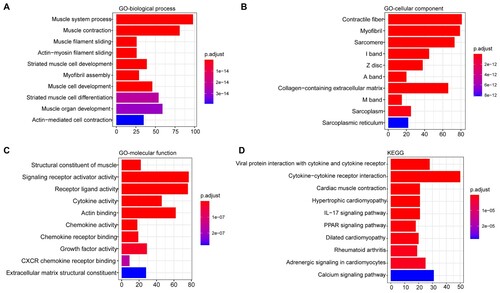
In order to investigate the biological functions of these DEGs, enrichment analysis was performed to explore their involved GO annotation terms, and 444 biological process terms, 99 cellular component terms and 145 molecular function terms were obtained (Table S4). The top 10 enriched biological process terms contained muscle system process, muscle contraction, striated muscle cell development and so on (Figure A), and the top 10 enriched cellular component terms included contractile fiber, myofibril, sarcomere, sarcoplasm and collagen−containing extracellular matrix and so on (Figure B). The top 10 enriched molecular function terms are shown in Figure C, including signaling receptor activator activity, receptor ligand/ cytokine/ chemokine/ growth factor activity, etc (Figure C). In addition, 42 KEGG pathways were significantly enriched (Table S4). The top 10 KEGG pathways are shown in Figure D, including cytokine−cytokine receptor interaction, cardiac muscle contraction, the interleukin (IL)−17 signalling pathway, and the PPAR signalling pathway.
Figure 2. Functional enrichment analysis of the DEGs. A) The top 10 enriched biological processes terms; B) The top 10 enriched cellular component terms; C) The top 10 enriched molecular function terms; D) The top 10 enriched KEGG pathways. The x-axis indicates the number of DEGs, and the y-axis represents the enriched pathways. The adjusted p-value was represented by the color key on the right.
GSEA
GSEA revealed that 48 KEGG pathways showed significant differences between MU and para-cancerous scar tissues (Table S5), including 18 negatively correlated pathways (NES <0) and 30 positively correlated pathways (NES >0). Among them, the cell cycle, cytokine-cytokine receptor interaction, and primary immunodeficiency pathways were the top three positively correlated pathways, whereas cardiac muscle contraction, dilated cardiomyopathy, and hypertrophic cardiomyopathy were the top three negatively correlated pathways (Table ).
Table 2. The significant enriched top 5 positively and negatively correlated KEGG pathways in GSEA.
Identification of key pathways and DEGs
Based on the enrichment results of GO, KEGG, and GSEA analyses, Pathview Web (Luo et al., Citation2017) was employed to explore the common significant enrichment pathway. Four pathways, including the hsa03320 PPAR signalling pathway, hsa04260 cardiac muscle contraction, hsa04020 calcium signalling pathway, and hsa05414 dilated cardiomyopathy, were identified (Figure A).
Figure 3. Identification of key pathways and DEGs. A) GSEA enrichment score curves of the four common pathways. The top panel shows the enrichment scores of each pathway. The middle vertical bars display the position of each hit. The bottom panel indicates the ranking metric scores. B) Protein-protein interactions between the important pathways and genes. The different pathways are represented by different big light color ellipses and the hub genes are represented by the small dark color ellipses. The grey lines indicated the associations between the hub genes.
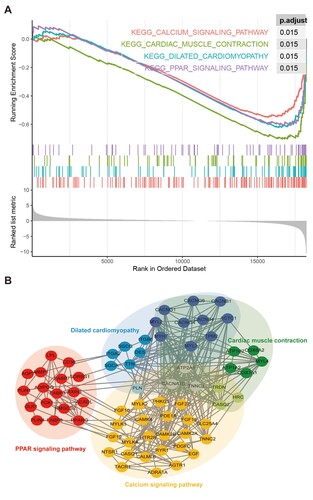
PPI analysis was performed for all genes in these four pathways. As shown in Figure B, the genes in the calcium signalling, cardiac muscle contraction, and dilated cardiomyopathy pathways showed close interactions with each other, and ATP2A1, CACNA1S, and TNNC1 were common between these pathways. No genes were common to either the PPAR signalling pathway or the other three pathways. Increasing evidence indicates that the PPAR signalling pathway could be a potential molecular target for the prevention or treatment of SCC (Ren & Konger, Citation2019). Peroxisome proliferator activated receptor gamma (PPARG), a crucial gene of PPAR pathway, has been linked to mediate the invasion, differentiation and tumor growth of various SCC (Masuda et al., Citation2005; Nijsten et al., Citation2005; Konger et al., Citation2019). Moreover, change of PPARG expression has been found to drive multiple molecules to involve the chemosensitivity of hypopharyngeal SCC (Lian et al., Citation2020; Lian et al., Citation2021). Therefore, we focused on the PPAR pathway in this study.
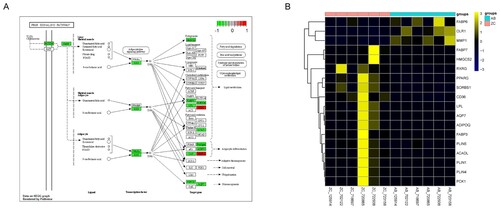
Among the genes in the PPAR signalling pathway, 18 were differentially expressed in MU (Figure ). Fatty acid-binding protein 6 (FABP6), oxidized low-density lipoprotein receptor 1 (OLR1), and matrix metallopeptidase 1 (MMP1) were upregulated in MU. The other genes were downregulated in MU, including FABP3, lipoprotein lipase (LPL), retinoid X receptor gamma (RXRG), PPARG, and adiponectin, C1Q, and collagen domain containing (ADIPOQ). Of these, FABP3, LPL, ADIPOQ, OLR, and MMP1 are downstream target genes, while RXRG and PPARG might be upstream transcription factors in the PPAR signalling pathway.
Figure 4. Identification of key pathways and DEGs. A) The diagram of the PPAR signalling pathway. B) The heat map of the DEGs in the PPAR signalling pathway. AB represents the MU tumor tissue samples, while ZC represents the matched para-cancerous scar tissues.
Validation of hub genes in the PPAR signalling pathway
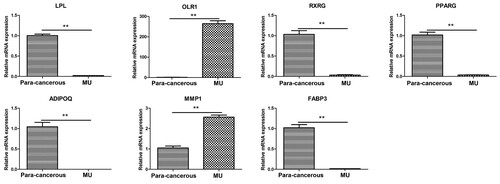
We performed quantitative RT–PCR to confirm the changes in the expression of several genes in the PPAR signalling pathway, including OLR1, FABP3, PPARG, MMP1, RXRG, ADIPOQ, and LPL. As shown in Figure , LPL, RXRG, PPARG, ADIPOQ, and FABP3 were significantly downregulated in MU cancer tissues, while the expression level of OLR1 and MMP1 were significantly upregulated in cancer tissues. The expression patterns of these genes were consistent with the transcriptome data.
Figure 5. qRT-PCR analysis of the hub genes in the PPAR signalling pathway. GAPDH was used as the reference gene. ** indicates that the gene expression was significantly different between the MU and the para-cancerous scar tissues (p <0.01).
Discussion
In the current study, we performed systematic transcriptome analysis based on RNA-seq data of MU cancer tissues and para-cancerous scar tissues. A total of 1109 DEGs, including 471 upregulated and 638 downregulated genes, were identified. Further functional enrichment analysis revealed that these DEGs mainly participated in the extracellular matrix organization-related pathway, cytokine−cytokine receptor interaction, cytokine activity, and the IL-17 signalling pathway. Chronic inflammation is considered a common etiological factor for MU (Pekarek et al., Citation2011). Severe inflammation causes DNA damage and mutagenic assault, which are responsible for tumor transformation (Coussens & Werb, Citation2002). Similar with our findings, previous studies also revealed a large-scale of expression changes of genes in the development of MU (Sinha et al., Citation2017; Liu et al., Citation2018). Sinha et al. identified 665 DEGs between MU tumor cells and epithelial cells and 1673 DEGs between SCC cells and epithelial cells (Sinha et al., Citation2017). Further functional enrichment analysis of these DEGs suggested that mainly three pathways were affected, including the extracellular matrix organization/degradation-related pathways, DNA damage-related pathways, and cytokine signalling pathways (Sinha et al., Citation2017). Liu et al. revealed that there were 9867 genes and 7130 long noncoding RNAs differentially expressed among normal skin, scar, and MU tissues, and they were mainly implicated in p53 signal pathway, cell cycle and immune response (Liu et al., Citation2018). These results suggest that there was a large-scale of changes at molecular level during the scar carcinogenesis and development of MU, and the dysregulation at the molecular level might contribute to scar carcinogenesis and development of MU by regulating various important biological functions and pathways.
Based on the integration of the enrichment results, four KEGG pathways, including the PPAR signalling pathway, were obtained. The peroxisome proliferator-activated receptor (PPAR) is an important family of nuclear transcription factors (TFs), including PPARα, PPARβ/δ, and PPARγ (Berger and & Moller, Citation2002; Michalik et al., Citation2006). A variety of genes are regulated by PPARs, including sugar-, lipid-, and energy metabolism-associated genes (Fucci et al., Citation2012). Four PPARG transcriptional splice variants under the control of the corresponding promoters were identified: PPARG1–4 (Fucci et al., Citation2012). Interestingly, the proteins encoded by PPARG1, PPARG3, and PPARG4 were identical (PPARγ1), whereas the PPARγ2 protein was encoded by PPARG2 (Sahu et al., Citation2012). To bind to DNA targets, PPARγ forms a heterodimer with the retinoid X receptor (RXR) (Ren & Konger, Citation2019). PPARγ is considered essential for regulating the expression of genes associated with cell proliferation, differentiation, and inflammatory responses in human and mouse skin (Man et al., Citation2006). To bind to DNA targets, PPARγ forms a heterodimer with the retinoid X receptor (RXR) (Ren & Konger, Citation2019). Later studies have demonstrated that PPARγ agonists play a protective role in the development of oral cavity and oesophageal SCC (Sawayama et al., Citation2014; Tseng, Citation2014). Our transcriptional analysis and quantitative RT–PCR results suggested that PPARG and its potential chaperone RXRG were extremely downregulated in MU tissue, suggesting that dysregulation of the PPAR signalling pathway is involved in the progression of MU.
During epidermal differentiation, lipids are synthesized in keratinocytes and squeezed into the extracellular region to form lipid-enriched extracellular layers, which represent a part of the skin barrier (Jensen & Proksch, Citation2009). Skin diseases can occur when the skin barrier is damaged. Among the genes in the PPAR signalling pathway, 18 genes were differentially expressed in MU, including the downstream target genes FABP3, LPL, and OLR1. FABP3, a member of the FABP family, has been reported to participate in the uptake, intracellular metabolism, and transport of long-chain fatty acids (Kleine et al., Citation1992). In the PPAR signalling pathway, FABP3 is the target of PPAR that is involved in the lipid metabolism (Tsukahara et al., Citation2014). LPL encodes lipoprotein lipase, a crucial lipid-modulating enzyme that participates in lipid metabolism and transport (Xu et al., Citation2018). OLR encodes a low-density lipoprotein receptor that regulates lipid metabolism (Khaidakov et al., Citation2011). Therefore, we speculated that dysregulation of the PPAR signalling pathway plays a role in the progression of MU by regulating lipid metabolism-related genes that damage the skin barrier.
This study has some limitations. 1) the low number of samples was the major limitation of this study, with only six samples in each group. We advocate that analysis based on a high number of samples may lead to more convincing conclusions, in spite of this, many studies were performed using a small sample size (Chen et al., Citation2020; Xu et al., Citation2021). 2) Only MU cancer tissues and matched para-cancerous scar tissues were analyzed, and normal skin should also be analyzed together to obtain more comprehensive and reliable results. 3) This study proposed that the PPAR signalling pathway might be important in the development and progression of MU. However, the role of the PPAR signalling pathway has not been effectively investigated and further study is required.
In conclusion, systematic transcriptome analysis of cancer tissues and para-cancerous scar tissues of MU was performed. Changes in the expression patterns of large-scale genes were observed in MU. These genes are involved in the extracellular matrix organization and inflammation-associated pathways. This study found that the PPARγ-mediated PPAR signalling pathway is a key pathway in the development and progression of MU.
Authors’ contributions
Cheng Wang and Lin Cheng conceived and designed the study. Ying Zhang and Huijun Zhang conducted the data analysis and interpretation. Xiaozhuo Zhao participated in the study design and performed the statistical analysis. Yuming Shen and Cheng Wang conceived the study, participated in its design and coordination, and helped draft and revise the manuscript for important intellectual content. All authors have read and approved the final manuscript.
Data availability statement
The raw sequencing data used in this study were deposited in the National Center for Biotechnology Information (NCBI) Sequence ReadArchive (SRA) database with accession number PRJNA821549 (http://www.ncbi.nlm.nih.gov/bioproject/821549). The data for RT-qPCR has been uploaded to 4TU. ResearchData repositories with doi:10.4121/19375049 (https://figshare.com/s/fa15a0a8ef60ee34f0e8).
Disclosure statement
No potential conflict of interest was reported by the author(s).
Additional information
Funding
References
- Baldursson B, Sigurgeirsson B, Lindelöf B. 1995. Venous leg ulcers and squamous cell carcinoma a large-scale epidemiological study. Br J Dermatol. 133:571–574.
- Bazaliński D, Przybek-Mita J, Barańska B, Więch P. 2017. Marjolin’s ulcer in chronic wounds - review of available literature. Contemp Oncol (Poznan, Poland). 21:197–202.
- Berger J, Moller DE. 2002. The mechanisms of action of PPARs. Annu Rev Med. 53(1):409–435.
- Bostwick J, PendergrastJrWJ, Vasconez LOJP, Surgery R. 1976. Marjolins ulcer. Plast Reconstr Surg. 57(1):66–69.
- Chen S, Xu H, Hu F, Wang T. 2020. Identification of Key players involved in CoCl2 hypoxia induced pulmonary artery hypertension in vitro. Front Genet. 11:232.
- Coussens LM, Werb Z. 2002. Inflammation and cancer. Nature. 420:860–867.
- Esther RJ, Lamps L, Schwartz HS. 1999. Marjolin ulcers: secondary carcinomas in chronic wounds. J South Orthop Assoc. 8:181–187.
- Fucci A, Colangelo T, Votino C, Pancione M, Sabatino L, Colantuoni V. 2012. The role of peroxisome proliferator-activated receptors in the esophageal, gastric, and colorectal cancer. PPAR Res. 2012:1.
- Gene Ontology Consortium. 2019. The gene ontology resource: 20 years and still GOing strong. Nucleic Acids Res. 47:D330–D338.
- Gong R, Chen M, Zhang C, Chen M, Li H. 2017. A comparison of gene expression profiles in patients with coronary artery disease, type 2 diabetes, and their coexisting conditions. Diagn Pathol. 12:44.
- Grenier JM, Barrière I, Rouffy J. 1993. Transformation maligne des ulcères des membres inférieurs. Rev Med Interne. 14:51–53.
- Harland DL, Robinson WA, Franklin WA. 1997. Deletion of the p53 gene in a patient with aggressive burn scar carcinoma. J Trauma: Inj Infection Crit Care. 42(1):104–107.
- Jensen JM, Proksch E. 2009. The skin’s barrier. G Ital Dermatol Venereol. 144:689–700.
- Kanehisa M, Goto S. 2000. KEGG: kyoto encyclopedia of genes and genomes. Nucleic Acids Res. 28:27–30.
- Kerr-Valentic MA, Samimi K, Rohlen BH, Agarwal JP, Rockwell WB. 2009. Marjolin’s ulcer: modern analysis of an ancient problem. Plastic Reconstructive Surgery. 123:184–191.
- Keshava Prasad TS, Goel R, Kandasamy K, Keerthikumar S, Kumar S, Mathivanan S, Telikicherla D, Raju R, Shafreen B, Venugopal A, Balakrishnan L. 2009. Human protein reference database–2009 update. Nucleic Acids Res. 37:D767–D772.
- Khaidakov M, Mitra S, Kang BY, Wang X, Kadlubar S, Novelli G, Raj V, Winters M, Carter WC, Mehta JL. 2011. Oxidized LDL receptor 1 (OLR1) as a possible link between obesity, dyslipidemia and cancer. PLoS One. 6:e20277.
- Kim D, Langmead B, Salzberg SL. 2015. HISAT: a fast spliced aligner with low memory requirements. Nat Methods. 12:357–360.
- Kleine AH, Glatz JFC, Van Nieuwenhoven FA, Van Der Vusse GJ. 1992. Release of heart fatty acid-binding protein into plasma after acute myocardial infarction in man. Mol Cell Biochem. 116:155–162.
- Konger RL, Derr-Yellin E, Ermatov N, Ren L, Sahu RP. 2019. The PPARγ agonist rosiglitazone suppresses syngeneic mouse SCC (squamous cell carcinoma) tumor growth through an immune-mediated mechanism. Molecules. 24:2192.
- Lee SH, Shin MS, Kim HS, Park WS, Kim SY, Jang J, Lee HK, Park JY, Oh RR, Han SY, Lee JH. 2000. Somatic mutations of Fas (Apo-1/CD95) gene in cutaneous squamous cell carcinoma arising from a burn scar. J Invest Dermatol. 114:122–126.
- Li B, Dewey CN. 2011. RSEM: accurate transcript quantification from RNA-Seq data with or without a reference genome. BMC Bioinformatics. 12:323.
- Lian M, Chen J, Shen X, Hou L, Fang J. 2020. Pparg may promote chemosensitivity of hypopharyngeal squamous cell carcinoma. PPAR Res. 2020:1.
- Lian M, Tao Y, Chen J, Shen X, Hou L, Cao S, Fang J. 2021. Variation of PPARG expression in chemotherapy-sensitive patients of hypopharyngeal squamous cell carcinoma. PPAR Res. 2021:1.
- Liu Z, Ren L, Tian J, Liu N, Hu Y, Zhang P. 2018. Comprehensive analysis of long noncoding RNAs and messenger RNAs expression profiles in patients with marjolin ulcer. Med Sci Monit. 24:7828–7840.
- Luo W, Pant G, Bhavnasi YK, Blanchard SG, Jr, Brouwer C. 2017. Pathview Web: user friendly pathway visualization and data integration. Nucleic Acids Res. 45:W501–W508.
- Man MQ, Choi EH, Schmuth M, Crumrine D, Uchida Y, Elias PM, Holleran WM, Feingold KR. 2006. Basis for improved permeability barrier homeostasis induced by PPAR and LXR activators: liposensors stimulate lipid synthesis, lamellar body secretion, and post-secretory lipid processing. J Invest Dermatol. 126:386–392.
- Masuda T, Wada K, Nakajima A, Okura M, Kudo C, Kadowaki T, Kogo M, Kamisaki Y. 2005. Critical role of peroxisome proliferator-activated receptor γ on anoikis and invasion of squamous cell carcinoma. Clin Cancer Res. 11:4012–4021.
- Michalik L, Auwerx J, Berger JP, Chatterjee VK, Glass CK, Gonzalez FJ, Grimaldi PA, Kadowaki T, Lazar MA, O’rahilly S, et al. 2006. International union of pharmacology. LXI. Peroxisome Proliferator-Activated Receptors. 58:726–741.
- Nijsten T, Geluyckens E, Colpaert C, Lambert J. 2005. Peroxisome proliferator-activated receptors in squamous cell carcinoma and its precursors. J Cutan Pathol. 32:340–347.
- Pavlovic S, Wiley E, Guzman G, Morris D, Braniecki M. 2011. Marjolin ulcer: an overlooked entity. Int Wound J. 8:419–424.
- Pekarek B, Buck S, Osher L. 2011. A comprehensive review on marjolin’s ulcers: diagnosis and treatment. J Am Col Certif Wound Spec. 3:60–64.
- Pertea M, Pertea GM, Antonescu CM, Chang TC, Mendell JT, Salzberg SL. 2015. Stringtie enables improved reconstruction of a transcriptome from RNA-seq reads. Nat Biotechnol. 33:290–295.
- Piel FB, Steinberg MH, Rees DC. 2017. Sickle cell disease. N Engl J Med. 376:1561–1573.
- Ren L, Konger RL. 2019. Evidence that peroxisome proliferator-activated receptor γ suppresses squamous carcinogenesis through anti-inflammatory signaling and regulation of the immune response. Mol Carcinog. 58:1589–1601.
- Robinson MD, Mccarthy DJ, Smyth GK. 2010. Edger: a bioconductor package for differential expression analysis of digital gene expression data. Bioinformatics. 26:139–140.
- Sahu RP, Dasilva SC, Rashid B, Martel KC, Jernigan D, Mehta SR, Mohamed DR, Rezania S, Bradish JR, Armstrong AB, et al. 2012. Mice lacking epidermal PPARγ exhibit a marked augmentation in photocarcinogenesis associated with increased UVB-induced apoptosis, inflammation and barrier dysfunction. Int J Cancer. 131:E1055–E1066.
- Sawayama H, Ishimoto T, Watanabe M, Yoshida N, Sugihara H, Kurashige J, Hirashima K, Iwatsuki M, Baba Y, Oki E, et al. 2014. Small molecule agonists of PPAR-γ exert therapeutic effects in esophageal cancer. Cancer Res. 74:575–585.
- Shah M, Crane JS. 2022. Marjolin ulcer. In: Statpearls. StatPearls publishing copyright © 2022. Treasure Island (FL): StatPearls Publishing LLC.
- Shannon P, Markiel A, Ozier O, Baliga NS, Wang JT, Ramage D, Amin N, Schwikowski B, Ideker T. 2003. Cytoscape: a software environment for integrated models of biomolecular interaction networks. Genome Res. 13:2498–2504.
- Shi T, Shen X, Gao G. 2019. Gene expression profiles of peripheral blood monocytes in osteoarthritis and analysis of differentially expressed genes. BioMed Res Int. 2019:4291689.
- Shiba N, Yoshida K, Hara Y, Yamato G, Shiraishi Y, Matsuo H, Okuno Y, Chiba K, Tanaka H, Kaburagi T, Takeuchi M. 2019. Transcriptome analysis offers a comprehensive illustration of the genetic background of pediatric acute myeloid leukemia. Blood Adv. 3:3157–3169.
- Sinha S, Su S, Workentine M, Agabalyan N, Cheng M, Gabriel V, Biernaskie J. 2017. Transcriptional analysis reveals evidence of chronically impeded ECM turnover and epithelium-to-mesenchyme transition in scar tissue giving rise to marjolin’s ulcer. J Burn Care Res. 38:e14–e22.
- Sturm M, Schroeder C, Bauer P. 2016. Seqpurge: highly-sensitive adapter trimming for paired-end NGS data. BMC Bioinformatics. 17:208.
- Treves NJSGO. 1930. The development of cancer in burn scars: an analysis and report of thirty-four cases. Surg Gynecol Obstet. 51:749–782.
- Tseng CH. 2014. Pioglitazone and oral cancer risk in patients with type 2 diabetes. Oral Oncol. 50:98–103.
- Tsukahara R, Haniu H, Matsuda Y, Tsukahara T. 2014. Heart-type fatty-acid-binding protein (FABP3) is a lysophosphatidic acid-binding protein in human coronary artery endothelial cells. FEBS Open Bio. 4:947–951.
- Wang C, Song C, Liu Q, Zhang R, Fu R, Wang H, Yin D, Song W, Zhang H, Dou K. 2021. Gene expression analysis suggests immunological changes of peripheral blood monocytes in the progression of patients With coronary artery disease. Front Genet. 12:641117.
- Wang Z, Gerstein M, Snyder M. 2009. RNA-Seq: a revolutionary tool for transcriptomics. Nat Rev Genet. 10:57–63.
- Xiang F, Song HP, Huang YS. 2019. Clinical features and treatment of 140 cases of marjolin’s ulcer at a major burn center in southwest China. Exp Ther Med. 17:3403–3410.
- Xu F, Lu C, Wu Q, Gu W, Chen J, Fang F, Zhao B, Du W, You M. 2018. Studies on the lipid-regulating mechanism of alisol-based compounds on lipoprotein lipase. Bioorg Chem. 80:347–360.
- Xu G, Wang YM, Ying MM, Chen SD, Li ZR, Ma HL, Zheng MH, Wu J, Ding C. 2021. Serum lipocalin-2 is a potential biomarker for the clinical diagnosis of nonalcoholic steatohepatitis. Clin Mol Hepatol. 27:329–345.
- Yu G, Wang LG, Han Y, He QY. 2012. Clusterprofiler: an R package for comparing biological themes among gene clusters. OMICS: A J Integr Biol. 16:284–287.