
 ?Mathematical formulae have been encoded as MathML and are displayed in this HTML version using MathJax in order to improve their display. Uncheck the box to turn MathJax off. This feature requires Javascript. Click on a formula to zoom.
Abstract
Fractures of pelvis and acetabulum are at high risk of death worldwide. However, the capability of mortality prediction by the conventional system Simple Acute Physiologic Score (SAPS) II remains limited. Here, we hypothesized that the use of machine learning (ML) algorithms could provide better performance of prediction than SAPS II for traumatic patients in the intensive care unit (ICU). Customized ML models were built including support vector machine, decision tree, logistic regression and random forest based on MIMIC-III clinical database. 307 patients were enrolled with an ICD-9 diagnosis of pelvic, acetabular or combined pelvic and acetabular fractures. Feature expansion method was used for experimental models by extending SAPS II features to the first 72 hours after ICU admission, compared with the traditional first-24-hours ones that were used to build respective control models. A comparison of each model’s performance was made through the area under the receiver-operating characteristic curve (AUROC). All the ML models outperformed SAPS II system (AUROC = 0.73), among which the experimental random forest model had the supreme performance (AUROC of 0.90). The results suggested that ML models could aid in better performance of mortality prediction for pelvic and acetabular injuries and potentially support decision-making for orthopedics and ICU practitioners.
Introduction
The role of big data and artificial intelligence (AI) in medicine has been receiving increasing attention from researchers in both industrial and academic circles. Healthcare giants and interdisciplinary groups at universities have combined big data and AI algorithms to build better health profiles and predictive models around individual patients for improved diagnosis and disease treatment. For example, Roche and IBM joined hands in predicting the early risk of diabetes-related chronic kidney disease (CKD) based on real-world data; results showed that the Roche/IBM algorithm had the best predictive performance as compared with published ones (Ravizza et al. Citation2019). FDNA company created a facial image analysis framework called Deep Gestalt by incorporating computer vision and deep learning algorithms to predict genetic syndromes, making enhanced accuracy than reports from clinicians in most of the scenarios (Gurovich et al. Citation2019). Yet, there remain significant challenges in the convergence of AI and medicine. Enhanced dialogue and teamwork between two fields need developing towards precision medicine.
Although previous comparison studies suggested that machine learning (ML) methods are superior to traditional regression in terms of real-time risk prediction (Singal et al. Citation2013; Held et al. Citation2016), it is the uncertainty that the same method from them can be reproduced to obtain better accuracy for a different patient cohort, not to mention in a distinct clinical context. Thus, efforts to study and implement AI in various biomedical settings are far from sufficient.
In terms of the early mortality rate, fractures of pelvis and acetabulum top the list of orthopedic traumas, for most of which are severe high-energy injuries (Hak et al. Citation2009; Guthrie et al. Citation2010). Many factors make the treatment of pelvic and acetabular fractures challenging and its corresponding high risk of death. First, the fracture site is usually surrounded by extensive soft tissues, which means more bleeding and a higher possibility of accompany with large-area trauma when damaged. Second, patients with pelvic and acetabular fractures often suffer from secondary or simultaneous multiple organ injuries, potentially ranging from limbs to thoracic and abdominal organs, urinary system, brain, or and spinal injury (Hauschild et al. Citation2008; Testerman et al. Citation2013). Even for a sophisticated doctor with high qualifications, it is full of uncertainty to judge a patient's mortality and the influencing factors through subjective experience.
The development of predicting hospital mortality for ICU patients has roughly gone through three eras since the past three decades. The first version of the APACHE (Acute Physiology and Chronic Health Evaluation) scoring model that proposed in 1981 represents the first stage of subjective experience from medical experts. The second stage dates back to the era of statistical analysis with logistic regression, and the third one is the era of machine learning and big data that is in full swing today. Both SAPS and APACHE are death prediction systems that remain the most widely used in clinical practice, which have formed inherent variables and model formulas. However, several external validation studies have suggested that neither the most recent versions of SAPS nor of APACHE succeeded to accurately predict the actual probability of death (GiViTI et al. Citation2012). Clinicians, therefore, are calling for a data-based auxiliary tool to predict the in-hospital mortality for a better clinical decision-making.
Here, we linked the popular ML methods and the Multiparameter Intelligent Monitoring in Intensive Care III (MIMIC-III) database, with the representative traumatic disease in orthopedics for the first time. To predict mortality among patients with pelvic, acetabular or combined pelvic and acetabular fractures, we established customized ML models including decision tree, logistic regression and random forest by capturing two sets of physiological features from Simple Acute Physiologic Score (SAPS) II – the first set of variables is obtained within 72 hours after ICU admission; the second as control is from first 24 hours. And we compared the ML experiment models with controls and SAPS II to (1) determine whether the model based on the new technique and MIMIC-III can improve mortality prediction under this specific clinical context; (2) to explore whether the use of evolution of physiological features over time, rather than traditional feature snapshots within the first 24 hours, is supportive to produce a better prediction model.
Materials and methods
Overall, the approval to access to MIMIC III database has been obtained after completing the required online courses and requirements according to the instructional manual on the official homepage (https://mimic.physionet.org/) (Johnson et al. Citation2016). On the website, two methods were introduced to have access to the dataset: one is to access the metadata on BigQuery, which is a serverless online platform that supports to directly query data using SQL language; the other is to download the database that is composed of comma-separated (CSV) files and import data into the database system on the local server. The latter has more complete functions with all information, supports flexible operation and queries without overloading. Therefore, we first downloaded a virtual machine with the operating system Linux Centos 7, and installed the large-scale relational database PostgreSQL11 (The PostgreSQL Global Development Group, California, USA) on the remote server. Next, we imported the target data with total uncompressed size (6.2G) into Postgres to build the clinical database, utilized SQL scripts to build MIMIC-III database with a collection of materialized views. We finally conducted data processing, feature selection, model building, training and prediction evaluation in Python 3.6.3 (Python Software Foundation, Vienna, Austria).
Dataset and patients
The MIMIC III dataset is an openly available database developed by The Laboratory of Computational Physiology at Massachusetts Institute of Technology (MIT), which consists of data from more than 25,000 patients who were admitted to the Beth Israel Deaconess Medical Center (BIDMC) since 2003 and who have been de-identified for information safety (Johnson et al. Citation2016).
The BIDMC is a 621-bed teaching hospital affiliated to the Harvard Medical School with a level I Trauma Center of 77 critical care beds. The intensive care units (ICU) within the center are composed of medical (MICU), trauma-surgical (TSICU), coronary (CCU), cardiac surgery recovery (CSRU) and medico-surgical (MSICU) critical care units. An Institutional Review Board (IRB) approval was obtained from both MIT and BIDMC for the development, maintenance and public use of a de-identified ICU database.
Here, we identified patients who were diagnosed as pelvic, acetabular, or combined pelvic and acetabular fractures according to ICD-9 code and who survived at least 72 hours after the ICU admission. All the data within the first 72 hours following ICU admission were collected and extracted from the MIMIC-III clinical database version 1.4. The final datasets for this project were uploaded on a public website. Table shows the details of each dataset and provides links to access them.
Table 1. Overview of datasets.
SAPS II and feature selection
To date, the SAPS II scoring system is known to discriminate potential survivors and non-survivors well for ICU patients and remains the most widely used in clinical practice. Here, the SAPS scores of individual patients were converted to prediction mortality according to the following formula (Le Gall Citation1993):
(1)
(1)
(2)
(2) Variables in the SAPS II system only contain physiological parameters (except for variables including age, type of admission and three underlying diseases) within 1 day after the ICU admission, however, we hypothesized that, by increasing the set of predictors and simultaneously expanding the observation period (from the first 24 hours to 72 hours in ICU), we could improve models’ prediction performance. Hence, we here kept the same variables in the original SAPS II scoring system yet captured their values within 72 hours after ICU admission. Another set of values from the first 24 hours were extracted to establish the control models. The missing values were replaced with the median of each variable.
Establishing models and evaluation
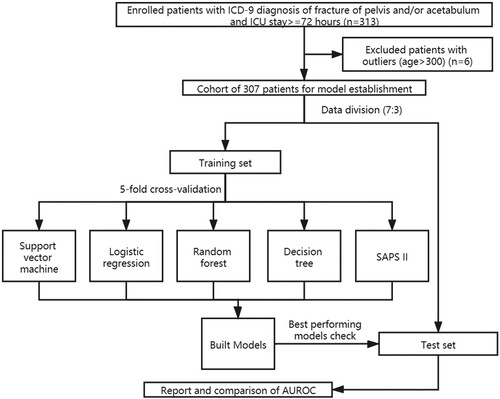
Based on this customized variable selection, support vector machine, logistic regression, decision tree and random forest models were built to predict in-hospital mortality. Here, the candidate samples were randomly divided into two separate subsets, with one taken as the training set and the other as the test set (the assignment proportion is 7:3). All models were built on a training dataset by using five-fold cross-validation – 80% of the data were used for training and the remaining 20% were used for validation – and the best-performing models were evaluated on the test set. 16 predictor variables from the first 24 hours (same as SAPS II system parameters) were used as inputs for ML control models, while extended variables from 72 hours were used for the ML experiment models. The outputs were the same as SAPS II model, which were the estimated in-hospital survival probability for enrolled patients. The evaluation procedure was implemented and presented through the cross-validated area under the receiver-operating characteristic curve (AUROC), with graphically illustrated receiver-operating (ROC) curves. To visualize the contribution of the predictor variables in ML models, we applied feature importance visualization, which refers to a class of techniques for assigning scores to input features to a predictive model that indicates the relative importance of each feature when making a prediction. Here, a variable importance measure that utilized coefficients for each input variable were used for logistic regression models, while the change in the Gini index was used for decision tree and random forest classifiers (Venables and Ripley Citation2002; Churpek et al. Citation2016). Figure shows the workflow of this study.
Figure 1. Flowchart of patient selection and study design.
Logistic regression
The logistic regression method has been widely used in mortality prediction in differing clinical cases (Eftekhar et al. Citation2005; Stylianou et al. Citation2015; Hou et al. Citation2020; Hsu et al. Citation2020). It provides knowledge of the relationships among the multiple independent variables and the response variable. Therefore, it is useful in finding statistically significant variables to model tasks with binary outcomes. Two logistic regression models (control and experiment), which utilized different predictor variables, were compared in this study.
Support vector machine
Support vector machines are supervised learning methods used primarily for classification (Vapnik Citation1998). A support vector machine model treats its input data as two sets of vectors in n-dimensional space: positive and negative examples. In this space, it constructs an optimal hyperplane that preserves the maximum distance between the two sets (Joachims Citation1998). Support vector machines are unique in that they primarily utilize the data points from each outcome class that are closest to the class boundary or that are misclassified when determining the structure of the boundary (Hastie et al. Citation2009; Kuhn and Johnson Citation2013). Being able to handle large feature spaces, it has been used successfully to solve many real-world problems, such as text categorization, image classification, protein analysis, cancer data classification, and handwriting recognition (Furey et al. Citation2000).
Decision tree
Decision trees partition the sample data by splitting the variables at discrete cut-points and are often presented graphically in the form of a tree (Hastie et al. Citation2009; Kuhn and Johnson Citation2013). Decision trees are easy to understand and the position of a predictor variable at the root shows its dominance compared with other variables. In addition, it is likely to be more practical in a clinical setting due to its easy interpretation (Long et al. Citation1993; Tsien et al. Citation1998), and is useful in decision making for long-term patient care (Quartararo et al. Citation1995). In this study, we used a cost complexity parameter, which penalizes more complex trees, to control the size of the final tree. The optimal value was determined using five-fold cross-validation.
Random forest
Random forests have been widely reported to be improving the performance of risk predictions by exploiting large data repositories to identify novel risk predictors and more complex interactions between them (Alaa et al. Citation2019; Lin et al. Citation2019; Yang et al. Citation2020). Because decision trees often have suboptimal predictive accuracy, several methods were used to combine multiple trees together. A random forest is therefore developed as composed of multiple decision trees, each of which has undergone relatively independent training and has its own independent prediction and classification capability. This model derived consecutive decision trees using random samples of the training data to predict the residuals of the previous models, thus creating a combination of trees that weight the ‘difficult to predict’ events to a greater degree (Kuhn and Johnson Citation2013). The training of decision trees in a random forest model utilizes the same learning algorithm, which uses Gini index (Venables and Ripley Citation2002; Churpek et al. Citation2016) as the criterion for selecting appropriate variables for different nodes in tree growing. Interestingly, if we compare each tree in the model to an individual expert, the random forest model effectively avoids an individual's misjudgment and bias as a result of the combination of multiple experts’ voting according to certain rules.
Results
Distribution of patients
In total, 313 patients with an ICD-9 diagnosis of fracture of pelvis and/or acetabulum were admitted. After excluding patients with outliers (age > 300), we finally enrolled 307 patients (210 males and 97 females), among which 84 expired (marked as 1, 27.4% mortality) and 223 survived (marked as 0) as showed in Figure (a). Figure (b) shows the admission types of the 307 patients: 28 patients were admitted for unscheduled surgery (9.1%), with 278 patients for medical reasons (90.6%) and the left one for scheduled surgery (0.3%). Figure shows the distributions of age and SAPS II score among survivors and non-survivors in the entire patient cohort. Here, we also described the 16 features from first-24 hours as baseline characteristics of the cohort in Table .
Figure 2. Distributions of the characteristics in the survivors and non-survivors. (a) Gender distribution; (b) Admission type distribution.
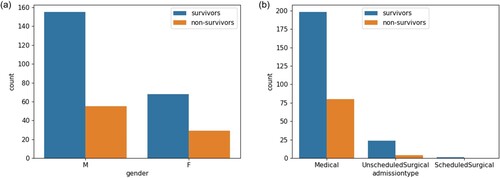
Figure 3. Distributions of selected variables in the survivors and non-survivors. (a) Age distribution. (b) SAPS II score distribution. SD = Standard deviation.
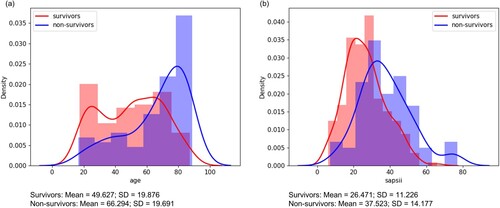
Table 2. First-24 hours characteristics of enrolled patients with pelvis and/or acetabulum fractures in MIMIC-III.
Comparison of ML models with SAPS II
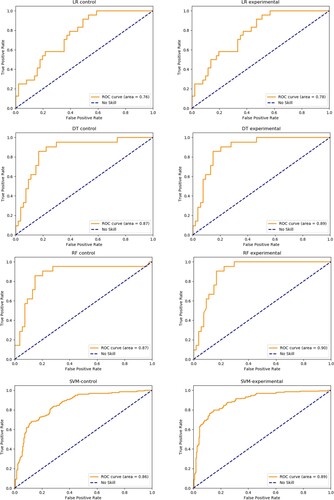
The prediction performance of the optimal logistic regression, random forest and decision tree, and SAPS II scoring is shown in Table . Results showed all ML models had better performance of prediction than SAPS II (AUROC = 0.73, Hosmer-Lemeshow p < .001). Among all ML models, the random forest model combined with first-72-hours-SAPS-features achieved the best performance with an AUROC up to 0.90, followed by the decision tree experiment model (AUROC = 0.89), the support vector machine experiment model (AUROC = 0.89) and the logistic regression experiment model (AUROC = 0.78).
Table 3. Comparison of customized mortality prediction models with SAPS II.
The influence of feature expansion on model’s performance
As is shown in Table , all the experiment groups with first-72-hours variables performed better than their controls, with comparison of respective ROC presented in Figure . For logistic regression models, the Hosmer-Lemeshow (HL) p values of both experiment and control models remained non-significant (>.05), suggesting goodness of fit. Although a slightly lower HL p value was showed in the experiment model after incorporation in first-72-hours variables, it obtained significant improvement in the AUROC than the control model.
Figure 4. Receiver-operating characteristics (ROC) curves of customized machine learning models. LR = logistic regression; DT = decision tree; RF = random forest.
Feature importance
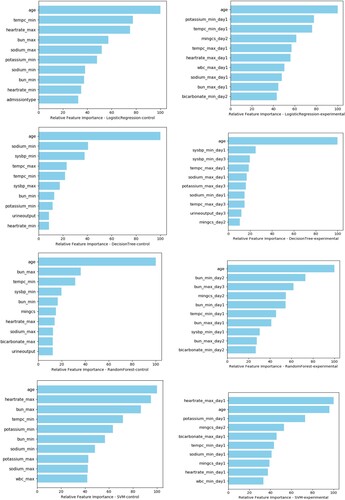
Top 10 features or risk predictors of each model were showed in Figure . Age, BUN (minimum value on day 2), and BUN (maximum value on day 3) were the top 3 predictor variables in the best fitted random forest experiment model, while age, BUN (maximum value) and the lowest temperature were top 3 risks of mortality in its control models. In the optimal decision tree model, the top 3 risk factors were age, the lowest systolic blood pressure on day 1 and the same value on day3. It showed that heart rate (maximum at day 1), age and potassium (minimum at day 1) were top 3 significant predictors in the support vector machine experiment model, compared with age, heart rate maximum and BUN maximum as key features in the control model. Although ranking of feature variables varied in different models, age remained the top of feature importance for all classifiers except for the support vector machine experiment model.
Figure 5. Feature importance of customized machine learning models.
Discussion
The purpose of this study is to establish customized modeling that can provide better performance of mortality prediction for patients with representative orthopedic trauma, as compared to the current standard severity scoring system SAPS II. All models were based on the training data of patients with pelvis and/or acetabulum fractures in the MIMIC-III database. The MIMIC-III database is derived from a large-scale critical care database in the United States. It has a large amount of data, rich variables, and high data quality. Meanwhile, we linked the mainstream ML algorithms with the use of evolution of physiological features over time to further enhance the performance of each model.
A good prediction model should have both satisfying sensitivity and specificity. AUROC, as an index of comprehensive judgment for two were reported here. Based on the results, all the ML models outperformed SPAS II (AUROC of 0.73), among which the random forest topped (AUROC = 0.90) and was followed by the decision tree model (AUROC = 0.89), the support vector machine experiment model (AUROC = 0.89), and then the logistic regression (AUROC = 0.78). The decision tree method is a process of classifying data through a series of rules, which conforms to cosmic human decision thinking. Similarly, the disease diagnosis of a clinician can be regarded as a classification process, that is, the doctor classifies patients into a specific disease group through his knowledge and experience. The results of the decision tree are concise and clear, easy to understand, and helpful to extract the corresponding diagnosis rules. Its application to the classification and diagnosis of diseases can often improve the diagnosis accuracy, making it widely used in clinical practice. In this study, the AUROC of the optimal decision tree model is higher than the traditional SAPS II system (0.89 vs 0.73), reflecting an improved prediction performance.
Although the decision tree achieves the best balance between accuracy and interpretability, the single decision tree model always fails to achieve the most ideal prediction accuracy. Therefore, scholars have developed a new algorithm based on the decision tree called random forest. As its name suggests, a random forest is composed of multiple decision trees, each of which has undergone relatively independent training and has its own independent prediction and classification capability. On the other hand, if we compare each tree in the model to an individual expert, the random forest model effectively avoids an individual's misjudgment and bias as a result of the combination of multiple experts’ voting according to certain rules. In this view, we can obtain a better understanding of the reason why a random forest performs better than a decision tree. In this study, we obtained the consistency on this point that the best fitted random forest model performs best among all ML models, with an AUROC of 0.90 versus 0.89 in the decision tree. This is also consistent with the results of previous studies. For example, Fernandez-Delgado et al. Citation2014 compared more than 100 model algorithms based on 121 datasets and found that the random forest algorithm has the highest prediction accuracy (Fernandez-Delgado et al. Citation2014). Pirracchio et al. established a death prediction model based on the clinical data of 24,508 ICU patients (Pirracchio et al. Citation2015). The results showed that the ‘Super Computing’ model customized by combining multiple machine learning algorithms outperformed the disease scoring system, with the finding that the random forest model and the ‘Super Compu-ting’ is comparable in prediction performance (each contained an AUROC as high as 0.880). However, the performance of the model is unavoidable to vary with the application to differing scenarios. Through a single-center clinical study, Mao et al. compared the predictive value of a logistic regression model and two other ML algorithms (decision tree and support vector machine) in early disease warning (Mao et al. Citation2011). The results showed that the predictive accuracy of logistic regression was higher than the other two. Badriyah et al. applied a decision tree model to predict the probability of inpatients in general wards to enter the ICU, and the results showed that its prediction accuracy is comparable to the traditional National Early Warning System (MEWS) (Badriyah et al. schmidt pe, featherstone pi, prytherch dr, smith gb. Citation2014). In other fields, logistic regression is more accurate than other machine learning methods. Yet in this study, the AUROC of the logistic regression model with extended variables is 0.78, which is less than that of the random forest model.
The results revealed an increasing AUROC when comparing each set of ML models before and after feature expansion: the physiological parameters included in SAPS II as key factors were kept, yet we expanded the features by capturing the measurements obtained within the first 72 hours rather than 24-hours snapshot after ICU admission. This suggests that the evolution of physiologic variables over time is more predictive to the clinical outcome than the physiologic snapshot of the ICU patients on admission, which is the basis of current severity scoring systems. The result from this improvement of method is consistent with the experience from clinical observation: it is not the initial presentation after ICU admission yet how a patient responds to treatments reflects the trend of deterioration or improvement, thus determining the outcome of each patient. The similar method was used by Celi et al. (Celi et al. Citation2011) who reported that the use of the evolution of physiologic variables over time facilitated the ML models’ performance in predicting mortality among ICU patients with acute kidney injury (AKI). This method of feature selection may set a good example for the integration of clinician’s experience and AI’s strength.
Comprehensively, the top 3 important factors affecting the morality of pelvic and/or acetabular fractures were age, systolic BP, and BUN. In our findings, the mean value of age of the non-survivors is 66.29, which is significantly higher than that of the survivors. Similarly, some studies reported that patients aged greater than 65 with pelvic fractures had higher case fatality despite equivalent measures of injury severity, with a mortality rate of approximately 20% (Dechert et al. Citation2009). Moreover, both the systolic BP and BUN are indicators of extensive bleeding. According to the results of a retrospective cohort study, a substantial number of patients with pelvic injuries died within the first 24 hours of hospital arrival primarily due to massive hemorrhage (Wang et al. Citation2016). Our finding is consistent with literature (Papakostidis and Giannoudis Citation2009; Mardanpour et al. Citation2018) reporting that bleeding-related risks are reliable risk factors predictive of early mortality, suggesting the significance of initial bleeding control in the management of hemorrhagic shock.
Our study has some limitations. First, the patient cohort was from a single center in the United States, and the number of enrolled patients didn’t meet the standard of a set of big data. It remains an issue that the big data sharing between regional health system is not sufficient. Major systems may be digital, but many organizations and smaller providers are still paper-based. This fragmentation of datasets makes it difficult to develop a complete picture of healthcare scenarios. In addition, this study only conducted internal verification of the model and limited ML methods were compared with each other. In all, further research is needed to verify the external data to generalize the model for other settings. Besides, MIMIC-III in this study is not a specialized database for orthopedic trauma, which means there is a lack of relevant detailed information (such as clinical classification of fractures of pelvis and acetabulum, patient trauma scores, etc.) which could be potential features of importance. Furthermore, here we only utilized traditional machine learning methods, further study will focus on more advanced algorisms to better improve the prediction performance of each model. As ML algorithms and big data are complementary, enhanced dialogue and teamwork between computer scientists, data scientists and clinicians could play a significant role in the progression of AI in medicine.
Conclusion
This study applied customized ML models to decision support for patients with the representative traumatic disease in emergency and orthopedics medicine. We found that customized modeling with ML methods could produce better performance of mortality prediction than the traditional severity scoring system SAPS II in the context of pelvic or/and acetabular fractures, potentially facilitating clinical decision-making for orthopedist or ICU practitioners in practice. While this is a pioneer study, we consider that integrated experience with both fields of AI and medicine represents the future of personalized medicine. It is promising that utilization of AI approach could meaningfully decrease the in-hospital mortality of trauma patients on a global scale.
Data availability statement
All the data utilized in our research came from the MIMIC-III database, developed by The Laboratory of Computational Physiology at the Massachusetts Institute of Technology (MIT), which can be accessed from the official website: https://mimic.physionet.org/ (Johnson et al. Citation2016). The final datasets for this project are freely and openly accessed on the Science Data Bank under (http://www.dx.doi.org/10.11922/sciencedb.00787) (Cai Citation2021). Please see Table and reference list for details and link to the data. The original codes are open to be required for other researchers.
Author contributions
All authors made a significant contribution to the work reported, whether that is in the conception, study design, execution, acquisition of data, analysis and interpretation, or in all these areas; took part in drafting, revising or critically reviewing the article; gave final approval of the version to be published; have agreed on the journal to which the article has been submitted; and agree to be accountable for all aspects of the work.
Ethics approval and consent to participate
The use of the MIMIC database was approved by the institutional review boards of both Beth Israel Deaconess Medical Center and Massachusetts Institute of Technology and requirement for individual patient consent was waived according to IRB protocol 2001-P-001699/3 (Ghassemi et al. Citation2014; Pirracchio et al. Citation2015).
Acknowledgments
The authors would like to thank the developers who built the MIMIC database and provided the open access for this study.
Disclosure statement
No potential conflict of interest was reported by the author(s).
Additional information
Funding
References
- Alaa AM, Bolton T, Di Angelantonio E, Rudd JHF, van der Schaar M. 2019. Cardiovascular disease risk prediction using automated machine learning: a prospective study of 423,604 UK Biobank participants. PLOS ONE. 14(5):e0213653. doi:10.1371/journal.pone.0213653.
- Badriyah T, Briggs JS, Meredith P, Jarvis SW, Schmidt PE, Featherstone PI, Prytherch DR, Smith GB. 2014. Decision-tree early warning score (DTEWS) validates the design of the National Early Warning Score (NEWS). Resuscitation. 85(3):418–423. doi:10.1016/j.resuscitation.2013.12.011.
- Cai Y. 2021. Mortality Prediction MIMIC-III. V1. Science Data Bank. 2021. doi:10.11922/sciencedb.00787.
- Celi L, Tang R, Villarroel M, Davidzon G, Lester W, Chueh H. 2011. A clinical database-driven approach to decision support: predicting mortality among patients with acute kidney injury. J Healthc Eng. 2(1):97–110. doi:10.1260/2040-2295.2.1.97.
- Churpek MM, Yuen TC, Winslow C, Meltzer DO, Kattan MW, Edelson DP. 2016. Multicenter comparison of machine learning methods and conventional regression for predicting clinical deterioration on the wards. Crit Care Med. 44(2):368–374. doi:10.1097/CCM.0000000000001571.
- Dechert TA, Duane TM, Frykberg BP, Aboutanos MB, Malhotra AK, Ivatury RR. 2009. Elderly patients with pelvic fracture: interventions and outcomes. Am Surg. 75(4):291–295. doi:10.1177/000313480907500405.
- Eftekhar B, Mohammad K, Ardebili HE, Ghodsi M, Ketabchi E. 2005. Comparison of artificial neural network and logistic regression models for prediction of mortality in head trauma based on initial clinical data. BMC Med Inform Decis Mak. 5(3). doi:10.1186/1472-6947-5-3
- Fernandez-Delgado M, Cernadas E, Barro S, Amorim D. Do we need hundreds of classifiers to solve real world classification problems? J Mach Learn Res. 15:49.
- Furey TS, Cristianini N, Duffy N, Bednarski DW, Schummer M, Haussler D. 2000. Support vector machine classification and validation of cancer tissue samples using microarray expression data. Bioinforma Oxf Engl. 16(10):906–914. doi:10.1093/bioinformatics/16.10.906.
- Ghassemi M, Marshall J, Singh N, Stone DJ, Celi LA. 2014. Leveraging a critical care database. Chest. 145(4):745–752. doi:10.1378/chest.13-1722.
- GiViTI PD, Rossi C, et al. 2012. Comparison between SAPS II and SAPS 3 in predicting hospital mortality in a cohort of 103 Italian ICUs. Is new always better? Intensive Care Med. 38(8):1280–1288. doi:10.1007/s00134-012-2578-0.
- Gurovich Y, Hanani Y, Bar O, et al. 2019. Identifying facial phenotypes of genetic disorders using deep learning. Nat Med. 25(1):60–64. doi:10.1038/s41591-018-0279-0.
- Guthrie HC, Owens RW, Bircher MD. 2010. Fractures of the pelvis. J Bone Joint Surg Br. 92-B(11):1481–1488. doi:10.1302/0301-620X.92B11.25911.
- Hak DJ, Smith WR, Suzuki T. 2009. Management of hemorrhage in life-threatening pelvic fracture. J Am Acad Orthop Surg. 17(7):447–457. doi:10.5435/00124635-200907000-00005.
- Hastie T, Tibshirani R, Friedman J. 2009. The elements of statistical learning. New York: Springer. doi:10.1007/978-0-387-84858-7
- Hauschild O, Strohm PC, Culemann U, et al. 2008. Mortality in patients with pelvic fractures: results from the German pelvic injury register. J Trauma Inj Infect Crit Care. 64(2):449–455. doi:10.1097/TA.0b013e31815982b1.
- Held E, Cape J, Tintle N. 2016. Comparing machine learning and logistic regression methods for predicting hypertension using a combination of gene expression and next-generation sequencing data. BMC Proc. 10(S7):34. doi:10.1186/s12919-016-0020-2.
- Hou N, Li M, He L, et al. 2020. Predicting 30-days mortality for MIMIC-III patients with sepsis-3: a machine learning approach using XGboost. J Transl Med. 18(1):462. doi:10.1186/s12967-020-02620-5.
- Hsu Y-T, He Y-T, Ting C-K, Tsou M-Y, Tang G-J, Pu C. 2020. Administrative and claims data help predict patient mortality in intensive care units by logistic regression: a nationwide database study. BioMed Res Int. 2020:9076739. doi:10.1155/2020/9076739.
- Joachims T. 1998. Text categorization with support vector machines: learning with many relevant features. In: Nédellec C, Rouveirol C, editors. Machine learning: ECML-98. vol 1398. Lecture Notes in Computer Science. Berlin, Heidelberg: Springer; p. 137–142. doi:10.1007/BFb0026683
- Johnson AEW, Pollard TJ, Shen L, et al. 2016. MIMIC-III, a freely accessible critical care database. Sci Data. 3(1):160035. doi:10.1038/sdata.2016.35.
- Kuhn M, Johnson K. 2013. Applied predictive modeling. New York: Springer. doi:10.1007/978-1-4614-6849-3
- Le Gall JR. 1993. A new Simplified Acute Physiology Score (SAPS II) based on a European/North American multicenter study. JAMA J Am Med Assoc. 270(24):2957–2963. doi:10.1001/jama.270.24.2957.
- Lin K, Hu Y, Kong G. 2019. Predicting in-hospital mortality of patients with acute kidney injury in the ICU using random forest model. Int J Med Inf. 125:55–61. doi:10.1016/j.ijmedinf.2019.02.002.
- Long WJ, Griffith JL, Selker HP, D’Agostino RB. 1993. A comparison of logistic regression to decision-tree induction in a medical domain. Comput Biomed Res Int J. 26(1):74–97. doi:10.1006/cbmr.1993.1005.
- Mao Y, Chen Y, Hackmann G, et al. 2011. Medical data mining for early deterioration warning in general hospital wards. In: 2011 IEEE 11th International Conference on Data Mining Workshops. IEEE; p. 1042–1049. doi:10.1109/ICDMW.2011.117
- Mardanpour K, Mardanpour N, Elham Zarei MR. 2018. Incidence of pelvic trauma and relative risk factors for mortality: a population based study in Iran. Clin Pract. Published Online. doi:10.4172/clinical-practice.1000401.
- Papakostidis C, Giannoudis PV. 2009. Pelvic ring injuries with haemodynamic instability: efficacy of pelvic packing, a systematic review. Injury. 40:S53–S61. doi:10.1016/j.injury.2009.10.037.
- Pirracchio R, Petersen ML, Carone M, Rigon MR, Chevret S, van der Laan MJ. 2015. Mortality prediction in intensive care units with the Super ICU Learner Algorithm (SICULA): a population-based study. Lancet Respir Med. 3(1):42–52. doi:10.1016/S2213-2600(14)70239-5.
- Quartararo M, Glasziou P, Kerr CB. 1995. Classification trees for decision making in long-term care. J Gerontol A Biol Sci Med Sci. 50(6):M298–M302. doi:10.1093/gerona/50a.6.m298.
- Ravizza S, Huschto T, Adamov A, et al. 2019. Predicting the early risk of chronic kidney disease in patients with diabetes using real-world data. Nat Med. 25(1):57–59. doi:10.1038/s41591-018-0239-8.
- Singal AG, Mukherjee A, Elmunzer JB, et al. 2013. Machine learning algorithms outperform conventional regression models in predicting development of hepatocellular carcinoma. Am J Gastroenterol. 108(11):1723–1730. doi:10.1038/ajg.2013.332.
- Stylianou N, Akbarov A, Kontopantelis E, Buchan I, Dunn KW. 2015. Mortality risk prediction in burn injury: comparison of logistic regression with machine learning approaches. Burns. 41(5):925–934. doi:10.1016/j.burns.2015.03.016.
- Testerman GM, West MR, Hensley S. 2013. Full-time orthopedic traumatologists enhance value and increase pelvic fracture caseloads at a rural level I trauma center. Am Surg. 79(5):549–550.
- Tsien CL, Fraser HS, Long WJ, Kennedy RL. 1998. Using classification tree and logistic regression methods to diagnose myocardial infarction. Stud Health Technol Inform. 52(Pt 1):493–497.
- Vapnik VN. 1998. Statistical learning theory. Wiley.
- Venables WN, Ripley BD. 2002. Modern applied statistics with S. New York: Springer. doi:10.1007/978-0-387-21706-2
- Wang H, Robinson RD, Moore B, et al. 2016. Predictors of early versus late mortality in pelvic trauma patients. Scand J Trauma Resusc Emerg Med. 24(1):1–8. doi:10.1186/s13049-016-0220-9.
- Yang L, Wu H, Jin X, et al. 2020. Study of cardiovascular disease prediction model based on random forest in eastern China. Sci Rep. 10(1):1–8. doi:10.1038/s41598-020-62133-5.