
Abstract
We aimed to identify potential molecular biomarkers through integrated analysis of microbiome and transcriptome data in colon cancer. Microbiome, transcriptome, and clinical phenotype data were downloaded from TCMA and TCGA databases. Intestinal flora subtypes were identified, followed by screening feature genes of each subtype. Univariate and LASSO Cox regression analyses were conducted to identify optimal prognostic genes to establish prognostic model. Survival, clinical phenotypes, pathways, and immune infiltration within different risk groups were compared. Three intestinal flora subtypes were identified: Proteobacteria, Fusobacteria, and Bacteroidetes subtypes. Bacteroidetes subtype tended to have worse survival. Feature genes of Bacteroidetes subtype were mainly implicated in immune-related functional terms, whereas those of Fusobacteria and Proteobacteria subtypes were mainly implicated in functions associated with inflammatory response and transcription, respectively. LASSO Cox regression identified 6 optimal prognostic genes: CSF1R, HLA-DOA, NOS3, HOXB4, PLA1A, and RPL3, to establish prognostic risk model. High-risk patients were associated with worse survival and had high proportions of Bacteroidetes subtype and high immune infiltration. Proteobacteria, Fusobacteria, and Bacteroidetes largely dominated the gut microbial flora in colon cancer patients. Prognostic model based on feature genes of intestinal flora subtypes can predict survival in colon cancer.
Introduction
Colon cancer is a common malignant tumor of the digestive tract. Worldwide, the incidence of colon cancer is on the rise in most countries and regions (Orangio Citation2018; Ahmed Citation2020). Therefore, in-depth study of colon cancer pathogenesis and identification of practical intervention methods are currently urgent problems in the medical field (Brown and Koh Citation2020). The human large bowel is densely populated with microbes, and the human colon possesses the largest amount of microbes throughout the body (Sears and Garrett Citation2014). The intestinal microbiota colonizing the colon is an important component for maintaining the stability of the intestinal micro-ecosystem, and it exceeds 100 trillion cells. It directly or indirectly participates in the processes of immune regulation, substance metabolism, digestion, and absorption in the human body and plays important roles in protecting the intestinal mucosa, maintaining intestinal homeostasis, maintaining normal function of the body, and fighting diseases (Wieczorska et al. Citation2020). Recent studies have proposed associations between intestinal microbes and the risk of colon cancer (O'keefe Citation2016; Garrett Citation2019). Therefore, there is an urgent need to explore how to utilize microbiome data for the prevention, diagnosis, and therapy of colon cancer.
Currently, it remains unclear whether the development of colon cancer causes changes in intestinal microbes or whether changes in intestinal microbes contribute to colon cancer occurrence (Song et al. Citation2020). It is suggested that bacterial flora release large amounts of bacterial toxins and induce inflammatory bowel diseases such as colitis. Subsequently, damage to intestinal barrier function causes the translocation of non-pathogenic bacteria, which affects the homeostasis of the immune system, transforms it to a carcinogenic-related immune response, and induces the occurrence of colon cancer (Caprara et al. Citation2020). Bacterial toxins bind specifically to pattern recognition receptors, such as Toll-like receptors (TLRs) and Nod-like receptors, which can activate the corresponding signal pathways and then inhibit tumor cell apoptosis and anti-tumor immune response and promote tumor cell proliferation, invasion, angiogenesis, and other malignant biological behaviors (Wieczorska et al. Citation2020).
Nevertheless, the intestinal flora and its metabolites can be used as biomarkers for the diagnosis and prognosis of colon cancer (Temraz et al. Citation2019). For example, commensal Bifidobacterium has been demonstrated to contribute to anti-tumor immunity and may be used as a promising biomarker to predict the clinical benefit of PD-L1 blockade therapy in colorectal cancer. As the preferred energy source for colonocytes, the metabolite butyrate plays crucial roles in maintaining mucosal integrity and colonic health as well as suppressing carcinogenesis (Mcnabney and Henagan Citation2017; Li et al. Citation2018), and decreased butyrate levels in feces could be used as a biomarker of colorectal cancer risk, progression, and severity (Hu et al. Citation2016). However, integrated analysis of microbiome and transcriptome data to identify potential molecular biomarkers has not yet been investigated. In this study, using data from the Cancer Microbiome Atlas (TCMA) and the Cancer Genome Atlas (TCGA) databases, the intestinal flora subtypes and corresponding feature genes were identified in colon cancer. Then, a feature gene-based prognostic model was established, and associations of the prognostic model with survival, clinical phenotype, and immune infiltration were investigated.
Methods
Data acquisition and preprocessing
The microbiome data of human colon cancer (including 125 primary tumor and 21 normal solid tissue samples) were acquired from TCMA database. In TCMA database, the relative abundances of the microbial community were obtained by aligning the whole-genome sequencing and exon sequencing data of TCGA samples to the microbial community. The RNA-seq data and corresponding clinical phenotype data were acquired from TCGA database. After matching to samples with microbiome data and selecting samples with a sample number of ‘−01A,’ a total of 114 samples were retained, of which 109 samples had detailed survival data. The log2 (FPKM+1) data were firstly converted into log2 (TPM+1) and then were annotated according to the hg38 annotation file (version 22) provided in GENCODE database. Only genes with expression data in more than 5% of samples were retained. In addition, two microarray datasets GSE17538 and GSE39582 in Gene Expression Omnibus (GEO) database were acquired for external validation. GSE17538 dataset contained 244 tumor samples, and 232 samples with detailed survival data were selected for analysis. GSE39582 dataset contained 562 samples with detailed survival data for analysis. Data in these two datasets were all generated on the GPL570 [HG-U133_Plus_2] Affymetrix Human Genome U133 Plus 2.0 Array platform, and genes were annotated using the annotation file of this platform. The mean expression data were selected when multiple probes matched one gene symbol. All data from these databases were analyzed according to the workflow in Figure . Table lists the clinical characteristics of all samples.
Figure 1. The workflow of this study.
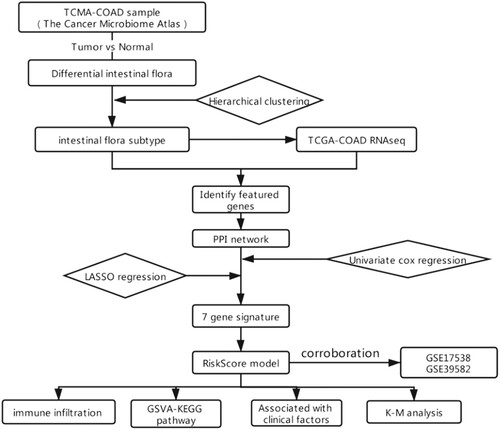
Table 1. The clinical characteristics of samples.
Differential analysis for intestinal flora
The differences in the relative abundance of intestinal flora at phylum, class, order, family, and genus levels within tumor and normal samples were compared by t tests using R 3.6.1. The results were displayed in a bar chart plotted utilizing ggplot Version 3.2.1, and intestinal flora with P < 0.05 was considered to be involved in tumorigenesis.
Identification of intestinal flora subtypes
On the basis of the differential intestinal flora with higher relative abundance in samples, centered Pearson correlation algorithm-based bidirectional hierarchical clustering analysis was performed using pheatmap package (version 1.0.8) to identify intestinal flora subtypes. Kaplan-Meier (KM) survival analysis was then conducted using Survival package (version2.41-1) to evaluate the correlations with patient survival among different intestinal flora subtypes.
Identification of feature genes among intestinal flora subtypes
The genes that were differentially expressed in one subtype vs. in other subtypes were screened using limma package (version 3.34.7), and the top 100 up-regulated genes were considered as the feature genes of this subtype, as described previously (Chen et al. Citation2017). Heatmaps of all feature genes were plotted using ComplexHeatmap package (version 2.2.0).
Functional enrichment and protein–protein interaction (PPI) network for feature genes
The involved Gene Ontology (GO) annotations (mainly biological process terms) and Kyoto Encyclopedia of Genes and Genomes (KEGG) pathways for these feature genes were enriched using DAVID (version 6.8). P < 0.05 and count > 2 were the cut-off values to select significant results. The interactions among proteins encoded by feature genes were analyzed using STRING database (version 10.5) with a PPI score of 0.7, and the PPI network was visualized using Cytoscape software (version 3.6.1). The topological properties of the network were analyzed using CytoNCA plug-in (version 2.1.6) with the parameter setting as without weight.
Prognostic model construction and validation
The associations of feature genes in the PPI network with overall patient survival were evaluated using univariate cox regression analysis, and prognostic genes were screened with P < 0.05. LASSO Cox regression was used to crop the less contributive genes, in which genes were analyzed with 50-fold cross-validation using the glmnet package (version 4.0-2). The genes with non-zero regression coefficients were obtained and used to establish the prognostic model according to the formula: Risk score = βgene1*exprgene1 + βgene2*exprgene2 + … +βgenen*exprgenen. In the formula, β refers to the regression coefficient in LASSO Cox regression, and expr refers to the expression value of each gene. Risk scores were calculated as per the formula, and then patients were assigned into two different risk groups based on the median risk score. KM-survival analysis with log-rank test was employed to evaluate the differences in survival. External validation for the prognostic model was conducted based on the GSE17538 and GSE39582 datasets, respectively. Expression values of genes in the prognostic model were firstly extracted to construct the model, and risk scores and survival analysis within two different risk groups were conducted as described for prognostic model construction.
Associations of risk groups with clinical phenotype and immune infiltration
The distributions of proportions of different clinical characteristics, including gender, TNM stage, tumor stage, AnatomicSite, and intestinal flora subtypes within two different risk groups were analyzed by ggstatsplot (version 0.6.5) in R. The t-test for comparisons within two groups and chi-square test for comparisons among three or more groups were carried out to evaluate the significant differences. The abundance of immune cell infiltration, including B cells, CD4+ T cells, CD8+ T cells, neutrophils, macrophages, and myeloid dendritic cells, were evaluated using the online database TIMER (Version 2.0), followed by the comparisons within two different risk groups.
Gene set variation analysis (GSVA)
GSVA was conducted to calculate the enrichment score of each KEGG pathway using GSVA software (version 1.36.2) based on the reference geneset c2.cp.kegg.v7.1.symbols.gmt to generate an enrichment score matrix. Then, differential analysis of these pathways within two different risk groups was performed using Limma package (version 3.10.3), followed by Benjamini & Hochberg (BH) multiple test corrections. The statistically significant pathways were screened with adjusted P < 0.05.
Cell culture
Human colonic cancer cell line SW480 and colonic epithelial cell line NCM460 were purchased from the Shanghai Cell Bank of the Chinese Academy of Sciences, China. SW480 cells were cultured in 90% L-15 basic culture adding 10% foetal bovine serum (FBS) and 1% penicillin–streptomycin. NCM460 cells were cultured in 90% DMEM: F12 adding 10% FBS and 1% penicillin–streptomycin. All cells were cultured at 37 °C in a humidified incubator with 5% CO2.
RT-qPCR
In order to validate the expression of optimal prognostic genes, RT-qPCR was performed. Briefly, total RNA was isolated using TRIZOL reagent, followed by determining the RNA concentration and quantity using a microplate reader (Infinite M100 PRO, TECAN). Reverse transcription was conducted to synthesize cDNA using ReverTra Ace® qPCR RT Master Mix (FSQ-201, TOYOBO), and then RT–PCR was performed using Power SYBR Green PCR Master Mix (A25742, Thermo) on a PCR Amplifier (7900HT FAST, ABI). The primer sequences are listed in Table S1. Three replicates were set. Data was presented as mean ± standard deviation (SD), and was analyzed using t-test provided by Graphpad prism 5 (Graphpad Software, San Diego, CA). P < 0.05 indicates statistical significance.
Results
Differential intestinal flora
The differences in the relative abundances of intestinal flora at phylum, class, order, family, and genus levels within tumor and normal samples were compared (Figure (A)). A total of 8, 9, 8, and 13 differential types of intestinal flora were found at class, order, family, and genus levels, respectively. At the phylum level, 5 differential types of intestinal flora were found, of which Fusobacteria, Proteobacteria, and Bacteroidetes showed increased relative abundances in samples. In particular, Fusobacteria and Bacteroidetes showed higher abundances in samples at different levels, suggesting their importance. The differential intestinal flora of Fusobacteria, Proteobacteria, and Bacteroidetes at other levels are displayed in Table . Fusobacteria showed significant difference at all levels between tumor and normal samples, as did Campylobacter in Proteobacteria.
Figure 2. Differential intestinal flora and intestinal flora subtype identification. (A) Bar graph of relative abundance distribution of differential intestinal flora at phylum, class, order, family, and genus levels; * P < 0.05, **P < 0.01, ***P < 0.001. (B) Clustering heatmap shows the three intestinal flora subtypes (Proteobacteria, Fusobacteria, and Bacteroidetes subtypes) based on the intestinal flora with significant differences at the phylum level and high abundance in samples. (C) KM survival curve shows the differences in survival among these three intestinal flora subtypes.
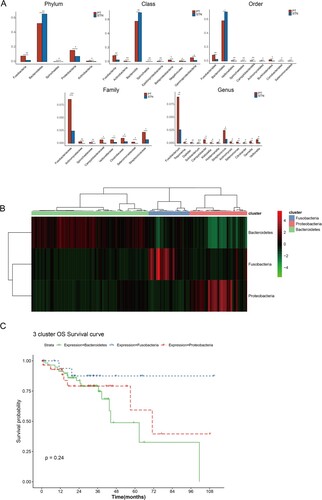
Table 2. Differential intestinal flora at other levels contained in Fusobacteria, Proteobacteria and Bacteroidetes.
Identification of intestinal flora subtypes
For matching to the transcriptome data, the samples in the microbiome dataset with a sample number of ‘−01A’ were selected, and 116 samples were subsequently analyzed. Considering that phylum, genus, and species levels were commonly used in microbiome analysis, and no significant difference in the Bacteroides genus was observed, Fusobacteria, Proteobacteria and Bacteroidetes were utilized to identify intestinal flora subtypes. Bidirectional hierarchical clustering analysis identified three intestinal flora subtypes. Among the 116 samples, 54% (n = 63) of samples were clustered into Bacteroidetes subtype, while 19% (n = 22) and 27% (n = 31) of samples were clustered into Fusobacteria and Proteobacteria subtypes, respectively (Figure (B)). KM survival curves showed the differences in overall patient survival among these three subtypes, in which Bacteroidetes subtype tended to be associated with worse patient survival compared to the other two subtypes. However, the differences showed no statistical significance (Figure (C)).
Identification of feature genes for intestinal flora subtypes
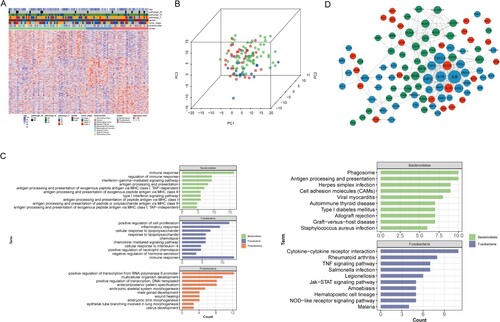
The 100 up-regulated genes in one subtype compared to other subtypes were screened as the feature genes as described in the methods (Table S2). Figure (A) shows the heatmap of feature gene expression in all samples. Principal component analysis was plotted to examine whether these feature genes could distinguish samples into three intestinal flora subtypes, and the results showed that samples in the same subtype tended to be clustered (Figure (B)). Functional enrichment revealed that the feature genes for each intestinal flora subtype were involved in different biological processes and KEGG pathways (Figure (C)). Feature genes of Bacteroidetes subtype were mainly implicated in immune-related functional terms, including immune response and antigen processing and presentation via major histocompatibility complex (MHC) class I/II, as well as the cell adhesion molecule (CAM) pathway. Feature genes of Fusobacteria subtype were mainly implicated in cell proliferation, inflammatory response, chemotaxis, cytokine−cytokine receptor interaction, and the tumor necrosis factor (TNF) signaling pathway. Moreover, feature genes of Proteobacteria subtype were mainly implicated in functional terms associated with transcription and development, such as positive regulation of transcription, DNA−templated, multicellular organism development, and embryonic limb morphogenesis.
Figure 3. Feature genes of intestinal flora subtypes. (A) Heatmap shows the expression pattern of feature genes of three intestinal flora subtypes. (B) Principal component analysis plot based on feature genes of three intestinal flora subtypes. (C) Bar graphs show the top 10 significantly enriched GO biological processes and KEGG pathways for feature genes of three intestinal flora subtypes. Green, blue, and red represent Bacteroidetes, Fusobacteria, and Proteobacteria subtypes, respectively. (D) Protein–protein interaction network for feature genes of three intestinal flora subtypes. Red, blue, and green nodes represent feature genes of Proteobacteria, Fusobacteria, and Bacteroidetes subtypes, respectively.
PPI network of feature genes
The PPI network for feature genes contained 264 interactions comprising 100 nodes (Figure (D)). In the PPI network, IL6 (degree = 34.0), CXCL8 (degree = 25.0), IL1B (degree = 22.0), CSF2 (degree = 20.0), CSF3 (degree = 14.0), CCL20 (degree = 14.0), and IL1A (degree = 14.0) were hub nodes with many interactions with others. Of these, IL6, CXCL8, IL1B, CSF2, CSF3 were all feature genes of Fusobacteria subtype. More interactions were observed within feature genes of Bacteroidetes subtype, such as HLA-B, HLA-C, HLA-F, HLA-DPA1, HLA-DPB1, HLA-DRB1. This was consistent with functional enrichment results that the feature genes of Bacteroidetes subtype were implicated in antigen processing and presentation.
Establishment of prognostic model
Univariate Cox regression analysis was applied to evaluate the associations of 100 feature genes in the PPI network with overall patient survival; of these, 14 genes were prognostic genes. Less contributive genes were cropped by LASSO Cox regression, and 6 optimal prognostic genes were screened to establish the prognostic model, including CSF1R, HLA-DOA, NOS3, HOXB4, PLA1A, and RPL3 (Table ). Survival analysis revealed that high expression levels of CSF1R, HLA-DOA, NOS3, HOXB4, and PLA1A were associated with worse survival, while high expression of RPL3 was associated with favorable survival (Figure ). According to the regression coefficients and expression values of these 6 genes, a prognostic model was established. Samples were assigned to two different risk groups based on the median risk score; patients in the high-risk group showed adverse survival compared to patients in the low-risk group (Figure (A)). A heatmap of these 6 genes showed that expression of CSF1R, HLA-DOA, NOS3, HOXB4, and PLA1A were gradually increased, while RPL3 expression was gradually decreased with a risk score from low to high (Figure (B)).
Figure 4. Survival analysis. KM survival curves show the prognostic value of the six genes in prognostic model.
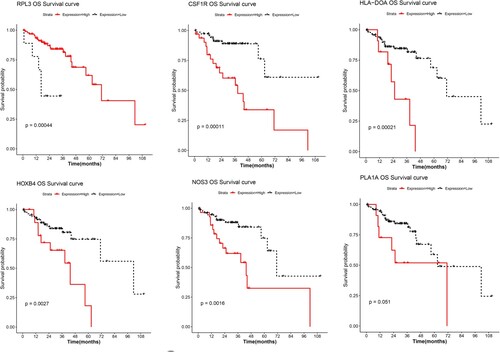
Figure 5. Prognostic model establishment. (A) KM survival curve shows the differences in survival of all samples within high/low-risk groups in TCGA dataset. (B) Heatmap shows the expression pattern of the six genes with risk score changes in TCGA dataset. (C) Heatmap shows the expression pattern of the six genes in GSE17538 external validation dataset. (D) KM survival curve shows the differences in survival of all samples within high/low-risk groups. (E) KM survival curve shows the differences in the survival of early stage (stage I-II) samples within high/low-risk groups. (F) Heatmap shows the expression pattern of the six genes in GSE39582 external validation dataset. (G) KM survival curve shows the differences in the survival of samples within high/low-risk groups.
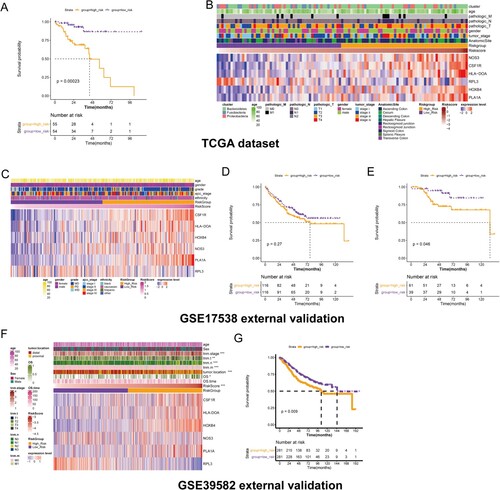
Table 3. The six optimal prognostic genes screened by univariate and LASSO Cox regression.
Validation for the prognostic model using external datasets
The GSE17538 and GSE39582 datasets were further utilized for external validation of the prognostic model, respectively. In GSE17538 dataset, high expression of RPL3 was associated with a low risk score, while high expression of CSF1R, HLA-DOA, NOS3, HOXB4, and PLA1A were associated with a high-risk score (Figure (C)). The survival curve revealed that patients with high-risk tended to have poor survival, but the differences showed no statistical significance (Figure (D)). We further established a prognostic model only for early patients (stage I-II), and patients were assigned to two different risk groups based on the optimal cutpoint calculated by the survminer package (version 0.4.3). Patients with high-risk were associated with worse survival compared to patients with low risk (Figure (E)). In GSE39582 dataset, expression of CSF1R, HLA-DOA, NOS3, HOXB4, and PLA1A were gradually increased, while expression of RPL3 was gradually decreased with risk score from low to high. Additionally, TNM stages, tumor location and overall survival showed significant differences between risk groups (Figure (F)). Survival curve confirmed that patients in high-risk group showed shorter survival time than that of low risk group (Figure (G)).
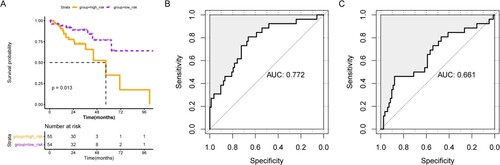
Sun et al. had established a prognostic model based on 6 metabolism-related genes (AOC2, ENPP2, ADA, GPD1L, ACADL, and CPT2) in colorectal cancer previously (Sun et al. Citation2020). We further compared the prognostic model in our study with that of Sun et al. Expression of AOC2, ENPP2, ADA, GPD1L, ACADL, and CPT2 were extracted from our TCGA cohort, and prognostic model was established with the coefficient obtained from Sun et al. As shown in Figure (A), patients with high-risk showed worse survival compared to patients with low risk. ROC curves revealed that our prognostic model (AUC = 0.772, Figure (B)) showed better performance than that of Sun et al (AUC = 0.661, Figure (C)).
Figure 6. Comparisons of prognostic model with others. (A) KM survival curve for prognostic model constructed by genes identified by Sun et al. ROC curves show the prognostic performance of our prognostic model (B) and prognostic model of Sun et al. (C).
Clinical phenotype in high/low-risk groups
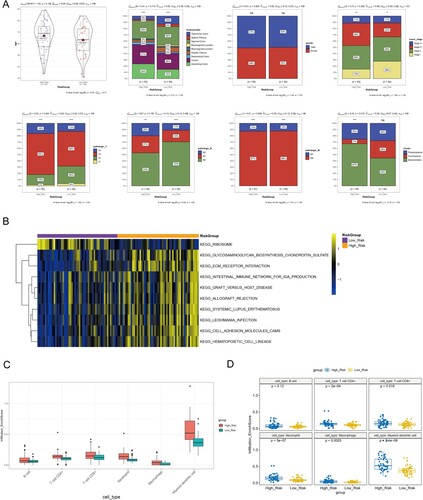
The distributions of the proportions of different clinical characteristics were analyzed, including gender, TNM stage, tumor stage, AnatomicSite, and intestinal flora subtypes within two different risk groups (Figure (A)). The low-risk group seemed to contain a higher proportion of early stage, pathologic N0, and pathologic T1-2 samples compared with those of the high-risk group. In addition, the high-risk group had a higher proportion of Bacteroidetes subtype, patients of which tended to have worse survival than with the other two subtypes. These results might explain the differences in survival within the high-risk and low-risk groups.
Figure 7. Associations of risk score with clinical phenotype, pathways and immune infiltration. (A) Histograms show the distribution of proportions for different clinical characteristics, including gender, TNM stage, tumor stage, AnatomicSite, and intestinal flora subtypes within two different risk groups. (B) Top 10 significant KEGG pathways within two different risk groups analyzed by GSVA. (C) Boxplot shows the infiltration abundance of six immune cells. D, Boxplot shows the difference in infiltration abundance within high/low-risk groups for each immune cell type.
Pathways and immune infiltration in high/low-risk groups
The differential pathways within the high/low-risk groups were further evaluated by GSVA, and 100 significant pathways were obtained. Figure (B) displays the top 10 pathways, of which 9 pathways were significantly enriched in the high-risk group, including extracellular matrix receptor interaction, intestinal immune network for IgA production, and CAM pathways.
TIMER analysis revealed that myeloid dendritic cells had relatively high infiltration abundance compared to other immune cells, such as B cells, CD4+/8+ T cells, neutrophils, and macrophages (Figure (C)). Additionally, the high-risk group had high infiltration abundance of CD4+/8+ T cells, neutrophils, macrophages, and myeloid dendritic cell in comparison with the low-risk group (Figure (D)), suggesting that differences in immune infiltration might be responsible for survival differences within the high/low-risk groups.
Expression of optimal prognostic genes determined by RT-qPCR
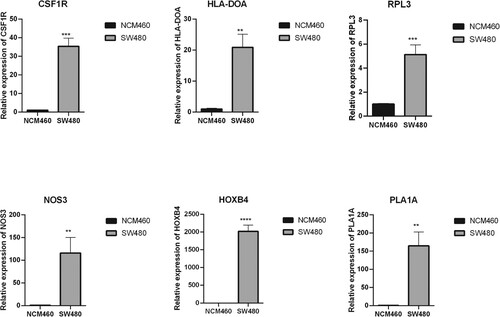
Expression of the six optimal prognostic genes (CSF1R, HLA-DOA, NOS3, HOXB4, PLA1A, and RPL3) in human colonic cancer cell line SW480 and colonic epithelial cell line NCM460 using RT-qPCR. As shown in Figure , all of these six genes were up-regulated in SW480 cells compared to NCM460 cells, indicating that these genes were indeed dysregulated in the development of colon cancer.
Figure 8. Expression of optimal prognostic genes determined by RT-qPCR. Bar chart show relative expression of CSF1R, HLA-DOA, NOS3, HOXB4, PLA1A, and RPL3 in human colonic cancer cell line SW480 and colonic epithelial cell line NCM460. **P < 0.01; ***P < 0.001.
Discussion
Colon cancer is a predominant human malignancy and has a major disease burden worldwide (Granier et al. Citation2016). In recent years, clinical research on tumor immunotherapy has been extensively carried out, and the intestinal flora has also been found to be related to the effects of immune checkpoint inhibitors in treating tumors. The intestinal flora has once again become a focus of study (Murata Citation2018; Bürtin et al. Citation2020; Ruan et al. Citation2020). In this study, based on the microbiome data in TCMA, we found that Fusobacteria, Proteobacteria, and Bacteroidetes showed high relative abundances in samples. In particular, Fusobacteria and Bacteroidetes showed high abundance in samples at different classification levels, suggesting their importance. Three intestinal flora subtypes were identified, including Proteobacteria, Fusobacteria, and Bacteroidetes subtypes. The Bacteroidetes subtype tended to be associated with worse survival compared to the other two subtypes.
Previous studies demonstrated that the abundance of Fusobacterium was increased in colon cancer compared to that in adjacent normal tissue, and the elevated abundance of Fusobacterium showed significant correlations with colon cancer pathogenesis (Sears Citation2018; King et al. Citation2020). Bacteroidetes and Firmicutes largely dominate the gut microbial flora. The dysbiosis of gut microbiota leads to increased permeability, systemic inflammation, irritable bowel disorder, colorectal cancer, and other effects (Pushpanathan et al. Citation2019). Beneficial flora such as Bacteroides and Bifidobacterium are closely related to the synthesis of intestinal lipopolysaccharide, which could stimulate the body's immune system to induce TNF-α inflammatory factors such as IL-18 and IL-18, whereas a lack of this type of flora affected the immune function, indicating that the intestinal flora is very important in the formation of the body's immune system (Wampach and Heintz-Buschart Citation2018). Two representative genera, Sutterella and Escherichia/Shigella of the Proteobacteria phylum, showed strong correlations with malignancy in colorectal cancer (Mori and Rampelli Citation2018). Enterotoxin-producing Bacteroides fragilis, Fusobacterium nucleatum, and other pathogenic bacteria invade colon epithelial cells, which can weaken the killing activity of lymphocytes and NK cells, thereby enhancing immune escape by cancer cells (Tjalsma et al. Citation2012). These findings all suggest important roles of Fusobacterium, Proteobacteria, and Bacteroidetes in colon carcinogenesis.
The feature genes of these three intestinal flora subtypes were identified. Feature genes of Bacteroidetes subtype were mainly implicated in immune-related functional terms, including immune response and antigen processing and presentation. The feature genes of Fusobacteria and Proteobacteria subtypes were mainly implicated in functions associated with inflammatory response and transcription, respectively. This highlighted the different functions of these three phyla of intestinal flora. A total of 14 genes significantly related to prognosis were screened, and LASSO Cox regression identified 6 optimal prognostic genes, including CSF1R, HLA-DOA, NOS3, HOXB4, PLA1A, and RPL3. CSF1R is a macrophage surface receptor for colony stimulating factor-1 (CSF1). The CSF1/CSF1R signaling pathway can regulate macrophages. Macrophage differentiation and function play a key regulatory role in the transformation of normal macrophages into tumor-associated macrophages (Cannarile et al. Citation2017; Denny and Flanagan Citation2021). Human leukocyte antigen (HLA) is the major histocompatibility complex (MHC) of humans. The host's cellular immune response to hepatitis C virus largely depends on the processing and presentation of viral epitopes by HLA molecules encoded by the human HLA gene system. HLA-DO belongs to the HLA II gene system, and the DO molecule is a negative regulator of the molecular function of HLA-DM, which affects exogenous antigen processing and presentation. Studies have shown that the results of human hepatitis B virus infection are related to HLA-DOA mutations with altered functions (Bellemare-Pelletier et al. Citation2005; Cui et al. Citation2010). HoxB4, a member of the Hox homeobox gene family, is highly conserved during evolution. HoxB4 is an important regulatory factor in the early stage of hematopoietic cell differentiation and plays an important role in regulating the balance between self-renewal and differentiation of hematopoietic stem cells. HoxB4 protein is currently considered to be promising tool for stem cell expansion (Amsellem et al. Citation2003; Teichweyde et al. Citation2018). Nitric oxide synthase 3 (NOS3) is involved in increasing vascular permeability and regulating vasodilation. The endogenous NO produced by tumor vascular endothelial cells and tumor cells can maintain the expansion of blood vessels in tumor tissues, promote tumor angiogenesis, and increase permeability (Wang and Hussain Citation2017; Medina et al. Citation2018). PLA1A protein encoded by this gene is a secreted phospholipase that hydrolyzes fatty acids at the sn-1 position of phosphatidylserine and 1-acyl-2-lysophosphatidylserine in liposomes. Recent studies have shown that serum PLA1A levels are related to tumor pathogenesis and can be used as diagnostic markers for monitoring various cancers, including hepatocellular carcinoma, gastric cancer, colorectal cancer, and melanoma. Among different transgenic animals, PLA1A was identified as a single marker. PLA1A has been used as a marker for early diagnosis of metastasis and treatment in laboratory medicine and the current clinical environment. The serum PLA1A level in liquid biopsy diagnosis provides a promising tool for early diagnosis, screening, and identifying tumor heterogeneity and drug resistance of tumors with genomic mutations (Gao et al. Citation2018; Yang et al. Citation2021). Ribosomes, the complexes that catalyze protein synthesis, consist of a small 40S subunit and a large 60S subunit in eukaryotes. Together, these subunits are composed of 4 RNA species and approximately 80 structurally distinct proteins. Ribosomal protein L3 (RPL3) encodes a component of the 60S subunit that belongs to the L3P family of ribosomal proteins and is located in the cytoplasm. Studies have shown that the perturbation of rp expression induces the occurrence of tumors. For example, rpL3 can promote apoptosis in p53-mutated lung cancer cells through down-regulation of cystathionine β-synthetase and nuclear factor κB following treatment with 5-fluorouracil (Russo et al. Citation2016; Zhang et al. Citation2021).
Based on these 6 genes, a prognostic model was established, which could predict overall survival for colon cancer patients. In order to investigate the underlying causes of survival differences within different risk groups, associations of risk score with clinical phenotype and immune infiltration were analyzed. The low-risk group contained a higher proportion of early stage, pathologic N0, and pathologic T1-2 samples compared with samples of the high-risk group. In addition, compared to the low-risk group, the high-risk group had a higher proportion of Bacteroidetes subtype, which tended to have worse survival than other two subtypes. These results might explain the differences in survival within high-risk and low-risk groups. Additionally, the high-risk group had high infiltration abundance of CD4+/8+ T cells, neutrophils, macrophages, and myeloid dendritic cell in comparison with the low-risk group. Tumors are inherently not very immunogenic, and the tumor microenvironment inhibits the activity of tumor-specific T cells. CD4+ T cells are necessary for effective anti-tumor immunity. Among intestinal lymphocytes, CD4+ T cells are the main cell group that mediates host protection and homeostasis. The intestinal flora and its metabolites can directly or indirectly induce the differentiation of CD4+ T cells, including T-bet+ Th1 cells, RORγt+ Th17 cells, Foxp3 + regulatory T cells, and GATA3+ Th2 cells (Borst et al. Citation2018). Considering that the feature genes of Bacteroidetes subtype were mainly implicated in immune-related functional terms, including immune response and antigen processing and presentation, we suggested that the high-risk group contained more Bacteroidetes, which might affect immune infiltration, leading to a poor prognosis.
In conclusion, we identified three intestinal flora subtypes, including Proteobacteria, Fusobacteria, and Bacteroidetes subtypes. The Bacteroidetes subtype tended to be associated with worse survival compared to the other two subtypes. The feature genes of these three intestinal flora subtypes were identified, from which 6 optimal prognostic genes, including CSF1R, HLA-DOA, NOS3, HOXB4, PLA1A, and RPL3, were identified. The prognostic model based on these 6 genes could predict overall survival for colon cancer patients. Patients with high-risk were associated with worse survival, and the high-risk group had high proportions of Bacteroidetes subtype and high immune infiltration.
Supplemental Material
Download Zip (50.7 KB)Acknowledgements
Conception and design of the research: YC; acquisition of data: CT; analysis and interpretation of data: XS, CT; statistical analysis: YS; drafting the manuscript: XS; revision of manuscript for important intellectual content: PS. All authors read and approved the final manuscript.
Disclosure statement
No potential conflict of interest was reported by the author(s).
Data availability statement
The microbiome data of human colon cancer used in this study is available publicly from the Cancer Microbiome Atlas (TCMA) database at https://tcma.pratt.duke.edu/. The RNA-seq data and corresponding clinical phenotype data of colon cancer used in this study is available publicly from the Cancer Genome Atlas (TCGA) database at https://xenabrowser.net/. GSE17538 and GSE39582 external validation datasets is available publicly from the Gene Expression Omnibus database at https://www.ncbi.nlm.nih.gov/geo/query/acc.cgi?acc. Data for RT-qPCR has been uploaded to 4TU. ResearchData repositories with doi:10.4121/19382681 at https://doi.org/10.4121/19382681.v2.
References
- Ahmed M. 2020. Colon cancer: A clinician’s perspective in 2019. Gastroenterol Res. 13:1–10.
- Amsellem S, Pflumio F, Bardinet D, Izac B, Charneau P, Romeo PH, Dubart-Kupperschmitt A, Fichelson S. 2003. Ex vivo expansion of human hematopoietic stem cells by direct delivery of the HOXB4 homeoprotein. Nat Med. 9:1423–1427.
- Bellemare-Pelletier A, Tremblay J, Beaulieu S, Boulassel MR, Routy JP, Massie B, Lapointe R, Thibodeau J. 2005. HLA-DO transduced in human monocyte-derived dendritic cells modulates MHC class II antigen processing. J Leukocyte Biol. 78:95–105.
- Borst J, Ahrends T, Bąbała N, Melief CJM, Kastenmüller W. 2018. CD4(+) t cell help in cancer immunology and immunotherapy. Nat Rev Immunol. 18:635–647.
- Brown KGM, Koh CE. 2020. Surgical management of recurrent colon cancer. J Gastrointest Oncol. 11:513–525.
- Bürtin F, Mullins CS, Linnebacher M. 2020. Mouse models of colorectal cancer: past, present and future perspectives. World J Gastroenterol. 26:1394–1426.
- Cannarile MA, Weisser M, Jacob W, Jegg AM, Ries CH, Rüttinger D. 2017. Colony-stimulating factor 1 receptor (CSF1R) inhibitors in cancer therapy. J Immunother Cancer. 5:53.
- Caprara G, Allavena P, Erreni M. 2020. Intestinal macrophages at the crossroad between diet, inflammation, and cancer. Int J Mol Sci. 21:4825.
- Chen F, Zhang Y, Parra E, Rodriguez J, Behrens C, Akbani R, Lu Y, Kurie JM, Gibbons DL, Mills GB, et al. 2017. Multiplatform-based molecular subtypes of non-small-cell lung cancer. Oncogene. 36:1384–1393.
- Cui Q, Zhang Y, Su J, Shi C, Lei N, Ding K, Li J, Yu R, Wang L, Wang N. 2010. The association between the genetic polymorphisms of LMP2/LMP7 and the outcomes of HCV infection among drug users. J Biomed Res. 24:374–380.
- Denny WA, Flanagan JU. 2021. Small-molecule CSF1R kinase inhibitors; review of patents 2015-present. Expert Opin Ther Patents. 31:107–117.
- Gao X, Chen D, Hu X, Zhou Y, Wang Y, Wu C, Chen J, Wang Y, Pei R, Chen X. 2018. PLA1A participates in the antiviral innate immune response by facilitating the recruitment of TANK-binding kinase 1 to mitochondria. J Innate Immun. 10:315–327.
- Garrett WS. 2019. The gut microbiota and colon cancer. Science. 364:1133–1135.
- Granier C, Karaki S, Roussel H, Badoual C, Tran T, Anson M, Fabre E, Oudard S, Tartour E. 2016. Cancer immunotherapy: rational and recent breakthroughs. La Revue de Medecine Intern. 37:694–700.
- Hu Y, Le Leu RK, Christophersen CT, Somashekar R, Conlon MA, Meng XQ, Winter JM, Woodman RJ, Mckinnon R, Young GP. 2016. Manipulation of the gut microbiota using resistant starch is associated with protection against colitis-associated colorectal cancer in rats. Carcinogenesis. 37:366–375.
- King MHH, Kr D, Ec D, Ma B, Ed C, Frey A. 2020. The link between fusobacteria and colon cancer: a fulminant example and review of the evidence. Immune Netw. 20:e30.
- Li QCL, Tian Y, Zhang P, Ding C, Lu W, Jia C, Shao C, Liu W, Wang D, Ye H, Hao H. 2018. Butyrate suppresses the proliferation of colorectal cancer cells via targeting pyruvate kinase M2 and metabolic reprogramming. Mol Cell Proteomics. 17:1531–1545.
- Mcnabney SM, Henagan TM. 2017. Short chain fatty acids in the colon and peripheral tissues: A focus on butyrate, colon cancer, obesity and insulin resistance. Nutrients. 9:1348.
- Medina AM, Zubero EE, MaA J, SaA B, CaL G, Ramos JJG, Gutierrez JFS, Castillo ZG. 2018. NOS3 polymorphisms and chronic kidney disease. Jornal Brasileiro de Nefrologia: ‘Orgao Oficial de Sociedades Brasileira e Latino-Americana de Nefrologia. 40:273–277.
- Mori G, Rampelli S. 2018. Shifts of faecal microbiota during sporadic colorectal carcinogenesis. Sci Rep. 8:10329.
- Murata M. 2018. Inflammation and cancer. Environ Health Prevent Med. 23:50.
- O'keefe SJ. 2016. Diet, microorganisms and their metabolites, and colon cancer. Nat Rev Gastroenterol Hepatol. 13:691–706.
- Orangio GR. 2018. The economics of colon cancer. Surg Oncol Clin North Amer. 27:327–347.
- Pushpanathan P, Mathew GS, Selvarajan S, Seshadri KG, Srikanth P. 2019. Gut microbiota and its mysteries. Ind J Med Microbiol. 37:268–277.
- Ruan H, Leibowitz BJ, Zhang L, Yu J. 2020. Immunogenic cell death in colon cancer prevention and therapy. Mol Carcinogen. 59:783–793.
- Russo A, Saide A, Cagliani R, Cantile M, Botti G, Russo G. 2016. Rpl3 promotes the apoptosis of p53 mutated lung cancer cells by down-regulating CBS and NFκB upon 5-FU treatment. Sci Rep. 6:38369.
- Sears CL. 2018. The who, where and how of fusobacteria and colon cancer. eLife. 7:e28434.
- Sears CL, Garrett WS. 2014. Microbes, microbiota, and colon cancer. Cell Host Microbe. 15:317–328.
- Song M, Chan AT, Sun J. 2020. Influence of the gut microbiome, diet, and environment on risk of colorectal cancer. Gastroenterology. 158:322–340.
- Sun YL, Zhang Y, Guo YC, Yang ZH, Xu YC. 2020. A prognostic model based on six metabolism-related genes in colorectal cancer. BioMed Res Intern. 2020:5974350.
- Teichweyde N, Kasperidus L, Carotta S, Kouskoff V, Lacaud G, Horn PA, Heinrichs S, Klump H. 2018. HOXB4 promotes hemogenic endothelium formation without perturbing endothelial cell development. Stem Cell Rep. 10:875–889.
- Temraz SNF, Nasr R, Charafeddine M, Mukherji D, Shamseddine A. 2019. Gut microbiome: A promising biomarker for immunotherapy in colorectal cancer. Intern J Mol Sci. 20:4155.
- Tjalsma H, Boleij A, Marchesi JR, Dutilh BE. 2012. A bacterial driver-passenger model for colorectal cancer: beyond the usual suspects. Nat Rev Microbiol. 10:575–582.
- Wampach L, Heintz-Buschart A. 2018. Birth mode is associated with earliest strain-conferred gut microbiome functions and immunostimulatory potential. Nat Commun. 9:5091.
- Wang J, Hussain SP. 2017. NO(•) and pancreatic cancer: A complex interaction with therapeutic potential. Antioxid Redox Signal. 26:1000–1008.
- Wieczorska K, Stolarek M, Stec R. 2020. The role of the gut microbiome in colorectal cancer: where are we? where are we going? Clin Colorectal Cancer. 19:5–12.
- Yang G, Liu S, Maghsoudloo M, Shasaltaneh MD, Kaboli PJ, Zhang C, Deng Y, Heidari H, Entezari M, Fu S, et al. 2021. PLA1A expression as a diagnostic marker of BRAF-mutant metastasis in melanoma cancer. Sci Rep. 11:6056.
- Zhang X, Han J, Feng L, Zhi L, Jiang D, Yu B, Zhang Z, Gao B, Zhang C, Li M, et al. 2021. DUOX2 promotes the progression of colorectal cancer cells by regulating the AKT pathway and interacting with RPL3. Carcinogenesis. 42:105–117.