
 ?Mathematical formulae have been encoded as MathML and are displayed in this HTML version using MathJax in order to improve their display. Uncheck the box to turn MathJax off. This feature requires Javascript. Click on a formula to zoom.
Abstract
An advanced insight into wheat stem rust progress curves is mainly needed by breeders and pathologists to improve accuracy and specificity of estimates of disease occurrence and development. It is necessary to identify certain disease curve elements for characterization of high variations in stem rust progress across different wheat cropping systems. A number of standard curves were fitted to a four-season data on stem rust severity to determine more predictive disease progress curve elements for wheat cultivars sown at different times. Exponential curve provided the best fitted parameters to be used as wheat stem rust progress curve elements. Sowing date and cultivar resistance significantly affected area under disease progress curve (AUDPC), maximum disease severity, and exponential parameter b. Mean AUDPC for early and late sowing dates were greater in susceptible cultivars (Bahar, Chamran II, Parsi and Sivand) than in resistant (Baharan and Pishtaz) and semi-resistant (Pishgam and Sirwan) cultivars. In semi-resistant cultivars, AUDPC increased by 37.44% at late sowings. Principal component analysis detected contributions of AUDPC, disease onset, maximum disease severity, and two exponential parameters in disease progression. This new understanding helps to achieve more accurate outcomes for future disease measurements for wheat breeding and wheat stem rust management programs.
GRAPHICAL ABSTRACT
1. Introduction
The rapid late-season development of severe wheat stem rust epidemics, caused by Puccinia graminis Pers.:Pers. f. sp. tritici Erikss. & E. Henn., occurring three weeks before harvest resulted in noticeable yield losses in wheat production systems (Roelfs et al. Citation1992). The progression of stem rust disease in susceptible cultivars might be intensified by favorable environmental conditions and some agricultural practices (Mideksa et al. Citation2018; Naseri and Sabeti Citation2021). According to a plot-scale research conducted in Kermanshah province, Iran, stem rust severity was estimated using the disease-onset and wheat maturity, mean minimum temperature and number of rainy days for spring months, number of autumn-winter-spring days with minimum temperature within 5–20°C and maximum relative humidity above 60%, cultivar resistance and sowing date (Naseri and Sabeti Citation2021). This means that a combination of earlier sowing, late occurrence of wheat stem rust in late spring, fewer spring days with rainfalls or minimum temperature within the range of 5–20°C and maximum RH > 60%, earlier maturation of wheat, and greater cultivar resistance reduced the disease severity over the growing season across commercial wheat crops. By using a multiple-regression-based model, Eversmeyer et al. (Citation1973) estimated wheat stem rust severity based on cultivar, disease severity ratings, crop growth stage, minimum and maximum temperature, urediospores number, and functions of fungal-temperature growth and fungal infection. Mideksa et al. (Citation2018) estimated wheat stem rust severity based on over-season total rainfall, mean minimum temperature, and average relative humidity in Ethiopia. Although such effective agro-ecological parameters can be considered to predict wheat rust epidemics and to develop sustainable disease management tools (Naseri and Sasani Citation2020), an updated understanding of disease progress curve elements for the stem-rust-wheat pathosystem is still required. Moreover, the previous models used many variables to characterize wheat stem rust progress that needed time and equipment to assess seasonal disease development.
In the USA, the onset of wheat stem rust was linked to the time of disease-onset in previous 1–2 years (Yang Citation1995). However, the association of the disease onset with other stem rust progress curve elements remained unclear. Wilcoxson (Citation1981) noted that measuring the area under the disease progress curve (AUDPC), the rate of disease increase or the logit line intercept can facilitate the comparison of disease progress curves to study genetics of slow rusting in cereals. Most of previous studies compared the progression of wheat stem rust through the detection of final disease severity, coefficient of infection (Hei et al. Citation2015), infection rate, latent period and AUDPC to identify slow-ruster lines as resistance cultivars, predict stem rust intensity (Vanderplank Citation1963; Mideksa et al. Citation2018), and estimate yield losses (Soko et al. Citation2018). However, none of them compared the above-mentioned disease curve elements for their predictive value. Moreover, there is no previous report on the examination of standard models to identify the best predictor for the progression of wheat stem rust. Although a huge number of previous studies examined stem-rust-resistance in wheat varieties, the multiple disease measurements over growing season were often analyzed according to the general criteria such as AUDPC (Mideksa et al. Citation2018). Whereas specific disease-progress-curve elements are needed to improve the accuracy of wheat stem rust assessments and predictions in wheat cropping systems. Therefore, attempts were made to find the best disease progress curve element for estimating intensity of wheat stem rust more confidently and efficiently.
Luo (Citation2008) recommended the principal component analysis (PCA) to lower the variable selection problem in fitting regression models with a moderately large number of explanatory variables involved. Knowledge of the magnitude of linkages among stem rust progress curve elements is an essential prerequisite for easier and more accurate breeding wheat crops, estimating yield losses, assessing disease-control-strategy efficiency, and predicting disease outbreaks. Moreover, it is proposed that a systematic understanding of wheat rust dynamics depends on the disease heterogeneity increased by involving more influential agro-ecological features in field studies (Naseri and Sheikholeslami Citation2021). In fact, Kranz (Citation2003) evidenced that the correspondence of a curve element to the disease progress was dependent on the degree of heterogeneity within the dataset. Therefore, this study explored: (i) which regression model describes the disease progression efficiently for finding the best fitted model parameters to be considered as wheat-stem-rust progress curve elements; (ii) effects of sowing date and cultivar resistance level on disease progress curves; (iii) how wheat stem rust progress descriptors rate disease dynamics in commercial wheat cultivars varying in disease-resistance, maturity and sowing-date levels.
2. Materials and methods
2.1. Experiment design and data collection
During the four-year (2013–2017) research, the occurrence and progression of stem rust in winter wheat were recorded in four sets of experimental field plots established at the research station (latitude 34°7′ north, longitude 46°28′ east) of Islamabad district, Kermanshah province. The following meteorological data were obtained from a weather station adjacent to the research station: cool temperate climate with annual mean temperature and rainfall of 13.7°C and 479.8 mm, respectively. The experimental plots received no fungicide application during the growing season for a precise measurement of wheat stem rust progress. The size of experimental plot decreased from 24 to 6 m2 during the research due to a deficiency in requirements for field management. Field experiments were established using a split-plot design with three replicates per treatment (Naseri and Sabeti Citation2021). To increase heterogeneity in the progression of wheat stem rust across the experimental plots, the four levels of sowing time (early = early autumn, optimum = mid-autumn, late = late autumn, and very late = early winter) and eight wheat cultivars (Bahar, Baharan, Chamran II, Parsi, Pishgam, Pishtaz, Sirwan, and Sivand) were examined. The following sowing times were tested: 10 Oct, 7 Nov, 3 & 31 Dec in 2013; 12 Oct, 14 Nov, 19 Dec in 2014; 27 Oct, 13 & 30 Dec in 2015; and 11 Oct, 15 Nov, 11 Dec, 5 Jan in 2016. The bread wheat cultivars have been registered from the breeding program developed by the Seed and Plant Improvement Institute, Karaj, Iran (Bahar: pedigree ICW84-0008-013AP-300L-3AP-300L-0AP; Baharan: pedigree KAUZ/PASTOR//PBW343, semi-resistant; Chamran II: pedigree Attila50Y//Attila/Bacanora, resistant; Parsi: pedigree Dove‘s’/Buc‘s’//2*Darab, resistant; Pishgam: pedigree Bkt/90-Zhong87; Pishtaz: pedigree Alvand//Aldan/Ias58; Sirwan: pedigree PRL/2*PASTOR, semi-resistant; and Sivand: pedigree KAUZ‘s’/Azadiakd, resistant). Due to either lacking information on the susceptibility of some of these cultivars to stem rust or the resistance breakdown, the reactions of wheat cultivars to this pathogen were assessed over the four growing seasons. The standard recommendations from local experts were followed in irrigation (sprinkler system at 7–10 days intervals), fertilization (225 kg/ha urea and 50 kg/ha superphosphate), pesticide (180 kg/ha Decis) and hand-weeding practices.
The severity of wheat stem rust was rated every 7–10 days from the disease onset to the end of each season. The stem rust severity rating defined the percentage of leaf area covered by black pustules for the three youngest leaves of 3–5 randomly inspected plants in at least three spots approximately 1 m apart per plot (Naseri and Sabeti Citation2021). Therefore, at least 11664 (in 2014), 6804 (in 2015), 8505 (in 2016), and 9072 (in 2017) assessments were conducted across the experimental plots. The disease onset was determined by the first occurrence of wheat stem rust pustules per experimental plot. This wheat stem rust indicator was classified in the two groups representing the early (prior to mid-spring or 5 May) and late (after mid-spring at anthesis stage) disease onset. The development of severe stem rust epidemics in wheat crops is dependent on the early disease onset under prevailing environmental conditions in Kermanshah (Naseri and Sabeti Citation2021).
2.2. Analysis of disease curve elements
The progression of wheat stem rust across 282 field plots (72 in 2014, 63 in either 2015 or 2016, 84 in 2017) was studied using these five disease progress curve elements: (1) the disease onset time; (2) the AUDPC based on the disease severity ratings over time (Vanderplank Citation1963); (3) maximum disease severity was the highest rating recorded over the growing season per treatment (Naseri and Kazemi Citation2020; Naseri and Jalilian Citation2021); (4) b; (5) r exponential curve parameters considered as the infection rate variables according to the disease severity data. The two exponential parameters were identified as wheat stem rust progress curves according to the analysis of standard models. All the statistical analyses were performed using the GENSTAT (Payne et al. Citation2009), which fits standard curves by maximum likelihood. The goodness of fit of the standard curves was evaluated using the co-efficient of determination (R2), Fisher’s (F) test, and regressing fitted values against observed values (Brusco and Stahl Citation2005; Naseri and Jalilian Citation2021).
The categories of sowing-time and cultivar-resistance factors on the wheat-stem-rust progress curve elements were compared according to rankings provided by the H-test of the Kruskal–Wallis one-way ANOVA procedure. Considering the maximum stem rust severity ratings, the eight commercial wheat cultivars were categorized into the following three groups of disease resistance: cvs. Baharan and Pishtaz as resistant (<40% severity rating), cvs. Pishgam and Sirwan as semi-resistant (<50% severity rating), and cvs. Bahar, Chamran II, Parsi and Sivand as susceptible (>70% severity rating).
According to Spearman’s rank correlations analysis, linkages among the wheat stem rust progress curve elements were determined. Spearman’s rank correlation provides a nonparametric (distribution-free) coefficient which measures a monotone association between two variables (data converted to ranks) measured at the ordinal level (Hauke and Kossowski Citation2011).
The principal component analysis (PCA) using correlation matrix provided information on the most seminal factors determining the entire stem rust severity progress curves. In this analysis, the factors or principal components (PCs) for the present dataset were defined as linear combinations of the disease progress curve elements that accounted for maximum variance within the data. Therefore, it was assumed that PCs receiving high percentage variances best explained the variability in the disease data. The PCA procedure examined the five disease progress curve elements as follows: the disease onset time, the AUDPC, maximum disease severity, b and r exponential curve parameters. The PCs with eigenvalues (the proportion of variance) greater than 1.0 were considered for statistical conclusions (Sharma Citation1996). Loadings (relevance of a variable to PC) greater than 0.35 were significant (Kranz Citation2003). The PCA identified the significantly driving curve elements which affected the progression of wheat stem rust.
3. Results
Fourteen types of standard curve were employed to simulate wheat stem rust progress data. The exponential (Y = a + brx), line plus exponential (Y = a + brx + c), double exponential (Y = a + brx + csx), critical exponential (Y = a + (b + cx)rx), logistic (a + c/(1 + exp(−b(x − m)))), generalized logistic (a + c/((1 + t exp(−b(x − m)1/t)))), Gompertz (a + c exp(−exp(−b(x − m)))), linear-by-linear (a + b/(1 + dx)), quadratic-by-linear (a + b/(1 + dx) + cx), quadratic-by-quadratic (a + (b + cs)/(1 + dx + ex2)), fourier (a + b sin(2π(x − e)/w)), double fourier (Y = a + b sin(2π(x − e)/w) + csin(4π(x − f)/w)), Gaussian (Y = a + b*Gauss(x − m)/s), and double Gaussian (Y = a + b*Gauss(x − m)/s + c*Gauss(x − n)/s) models were examined to find the best function fitted to the four-year data on the progression of stem rust on the eight commercial wheat cultivars with different levels of disease resistance, maturity and sowing time. The exponential model (or asymptotic regression) was fitted the best to the wheat-stem-rust-severity data in comparison with the above-mentioned standard functions examined (Table ). The exponential function is of the form:
Table 1. Standard regression models generated by GenStat to characterize stem rust progress in eight wheat cultivars with different resistance levels and sowing times at plot scale.
In the exponential model, a is defined as the initial value of the model (constant term), b is the increase factor, r is the increase rate, and x is the time intervals (day) between disease severity ratings. This model indicates a slow increase of wheat stem rust at first, and then rapid and more rapid increase without bound. With b > 1 the model demonstrates an exponential increase and with 0 < b < 1 an exponential decrease occurs.
The evaluation of an exponential model evidenced a significant fitness (P < 0.05) for all the four seasons of the current research, from 2013 to 2017. The proportions of variation explained by exponential functions developed for the study years were 0.71%, 0.82%, 0.70% and 0.80% for 2013–2014, 2014–2015, 2015–2016 and 2016–2017, respectively. Although some of the other standard curves explained higher percentages of data variations, the significance of their fitness was not consistent over the four seasons studied. The exponential parameters, b and r, were estimated for each experimental plot per study year according to wheat stem rust severity data. These two exponential parameters in addition to the three descriptors of AUDPC, disease onset time, and maximum disease severity were regarded as wheat stem rust progress curve elements. The exponential parameters, AUDPC and maximum disease severity descriptors of stem rust development in wheat cultivars with different resistance levels and sowing dates were characterized as summarized in Table . Larger standard deviations compared to the mean values determined for the disease predictors indicated a wide range of variation within variables.
Table 2. Average, standard deviation, and range values detected for predictors of stem rust progress in wheat cultivars with different resistance levels and sowing times at plot scale.
3.1. Kruskal–Wallis one-way ANOVA
Severe stem rust epidemics developed on commercial wheat cultivars over 2013–2014 and 2015–2016 growing seasons (Figure ). The lack of (2014–2015) or mild (2016–2017) stem rust development was recorded in the two remainder growing seasons studied. To simplify the interpretation of the Kruskal–Wallis one-way ANOVA results, the eight wheat cultivars were grouped into the three groups of resistant (Baharan and Pishtaz), semi-resistant (Pishgam and Sirwan), and susceptible (Bahar, Chamran II, Parsi and Sivand) cultivars. Based on the H-test results, the greatest and lowest mean values for stem-rust-AUDPC were detected in the early-optimum sowing dates of susceptible cultivars (mean = 55.22; rank = 1) and resistant cultivars (mean = 34.30; rank = 6), respectively (Table ). The mean AUDPC values for the both categories of sowing date were greater in susceptible cultivars (mean adjusted H = 10.57; P = 0.046) than in the resistant and semi-resistant cultivars. In semi-resistant cultivars, mean AUDPC increased by 37.44% when the sowing date changed from the early-optimum to the late-very late level. For the disease onset time, the earliest and latest disease occurrence were detected at the level of late-very late sowings of susceptible cultivars (mean = 42.58) and early-optimum sowings of semi-resistant cultivars (mean = 54.33), respectively. However, there was the lack of significant difference (mean adjusted H = 2.66; P = 0.753) in disease onset time between the rankings obtained for the categories of cultivars and sowing dates tested. For the maximum stem rust severity, the H-test (mean adjusted H = 9.68; P = 0.054) determined the greatest mean value for the late-very late sowings of susceptible-cultivar-class (mean = 58.33; rank = 1). For the early-optimum sowing dates, the mean maximum disease severity for the susceptible class (mean = 48.74; rank = 2) was greater than that for the both categories of resistant (mean = 34.15; rank = 6) and semi-resistant cultivars (mean = 35.96; rank = 5). The mean maximum severity increased by 19.61–33.59% when the sowing date of resistant, semi-resistant and susceptible cultivars was postponed to the late-very late class. For the exponential parameter b (the disease increase factor), the greatest and lowest mean values were detected for the late-very late (mean = 60.98; rank = 1) and early-optimum (mean = 35.24; rank = 6) sowings of susceptible cultivars, respectively. This demonstrated that the slowest and quickest exponential increases of wheat stem rust over time were observed in earlier and later sown susceptible cultivars, respectively. Furthermore, stem rust severity increased more rapidly in late-very late sowings of resistant (by 13.77%) and susceptible (by 73.04%) cultivars than early-optimum sowings. There was a lack of significant difference between the rankings determined for the exponential parameter r (mean adjusted H = 5.40; P = 0.369) of stem rust progress on the eight commercial wheat cultivars studied over four growing seasons. This means that there was no significant difference in the base of exponential stem rust progress curve between the classes of wheat cultivars and sowing dates tested (Table ).
Figure 1. Wheat stem rust severity curves during 2013–2014 (up) and 2015–2016 (down) growing seasons in resistant (Baharan and Pishtaz), semi-resistant (Pishgam and Sirwan) and susceptible (Bahar, Chamran II, Parsi and Sivand) cultivars sown at different dates (x axis represents assessment times).
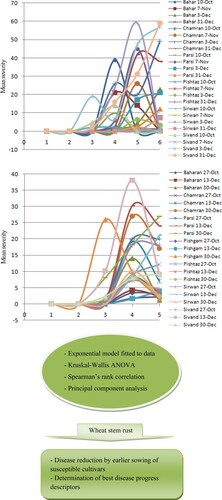
Table 3. Effects of cultivar resistance and sowing time on wheat stem rust progress curve elements examined by Kruskal-Wallis one-way ANOVA based on H-test.
3.2. Correlation analysis
From the Spearman’s rank correlation analysis of stem rust curve elements, there were significant (P ≤ 0.05) relations of the AUDPC variable with the exponential parameter r and maximum disease severity (Table ). The maximum disease severity corresponded (P ≤ 0.05) to the exponential parameter r. The exponential parameter b was significantly correlated to the parameter r.
Table 4. Spearman’s rank correlations between wheat stem rust progress curve elements determined for eight cultivars with different resistance levels and sowing times at plot scale.
3.3. Principal component analysis
From the PCA, the two principal components justified 66.77% of the variation in stem rust progress curve elements examined over the four growth seasons of eight commercial wheat cultivars differing in the levels of resistance and sowing date (Table ). The first principal component accounted for 46.86% of the total data variance. This factor determined the greatest loading (−0.58) for the negative linkage (P ≤ 0.05) of the maximum stem rust severity indicator. The disease onset time was the only descriptor positively contributed (P ≤ 0.05) in the first principal component. In addition, the AUDPC was negatively (P ≤ 0.05) associated with the first principal component. Thus, this factor of PCA test indicated the reverse relationship of disease-onset indicator with the other two indicators significantly contributed. This suggested the correspondence of an earlier wheat-stem-rust onset to greater AUDPCs and maximum severity ratings in wheat crops. Furthermore, the similar significant associations of the AUDPC, disease-onset, and maximum disease severity indicators with the first principal component evidenced the similar importance of these disease variables to describe the occurrence and progression of wheat stem rust.
Table 5. Principal component analysis of stem rust progress curve elements characterized for wheat cultivars with different resistance levels and sowing times at plot scale.
The second principal component, explaining 19.91% of the total data variance, demonstrated the high and moderate contributions of the base of exponential curve (parameter r) and the disease increase factor (parameter b), respectively, to characterize a wide range of wheat stem rust progress curves over the growth seasons. In agreement with the results of H-test and Spearman’s rank correlations, the PCA results confirmed the significant dependence of occurrence and progression of wheat stem rust on the five disease progress curve elements (AUDPC, disease onset, maximum disease severity, and two exponential parameters) examined over the four growth seasons at field-plot scale.
4. Discussion
The present study involved the common predictors of occurrence and progression of wheat stem rust to achieve more accurate and easy-to-use models for predicting severe epidemics, estimating crop damage, and breeding resistant genotypes in future. Due to reducing the predictive value of a regression-based model following an increased number of collinear disease indicators (Pietravalle et al. Citation2003), it is needed to find the best curve elements of wheat stem rust progress. The progression of stem rust over a four-year research on the eight commercial wheat cultivars with different levels of resistance and sowing date was characterized according to five disease curve elements determined by using the PCA procedure as recommended by Luo (Citation2008) and Kranz (Citation2003). In agreement with Kranz (Citation2003) reporting the relevance of a fitted progress curve to disease variability, the current experimental design improved not only variations in stem rust development across the 282 field plots examined during four growing seasons but also heterogeneity in the disease progress curve elements determined.
MacKenzie (Citation1976) compared the increase of wheat stem rust in space and time between a slow-ruster cultivar and two susceptible cultivars using the two epidemiological models, logarithm and exponential. Although he found the exponential model as the best estimator of wheat stem rust intensity in relation to the distance from uredospores foci, the fitness of other standard models for wheat stem rust progress remained unknown. Elsewhere, Wilcoxson (Citation1981) reported AUDPC, disease increase rate or logit-line intercept as disease progress curve elements to evaluate slow rusting cereals. The progression of leaf rust (Naseri and Jalilian Citation2021) and powdery mildew (Naseri and Sheikholeslami Citation2021) in wheat have been characterized with the help of specific disease curve elements. However, there is no previous report on fitting different regression models to detect the best predictors of stem rust progress in wheat. Hence, the present research evidenced the best fit of exponential model to characterize the progression of wheat stem rust. Thus, the two exponential parameters were regarded as stem rust progress curve elements. To the best of our knowledge, this is the first report of the fitted exponential curve parameters for characterizing disease progress in this pathosystem. Moreover, this advantage of fitted exponential parameters is achieved through a much larger variance of stem rust progress curves that improved the association of curve elements with the disease progress based on the statement from Kranz (Citation2003). Furthermore, the current importance of exponential parameters explaining 20% of variance in wheat stem rust progress underscores the necessity of considering these disease curve elements in breeding slow-rusting resistant cultivars. It should be noted that AUDPC, disease onset, and maximum severity criteria which accounted for nearly half of data variance must be assessed in combination with exponential parameters. Therefore, this study provided a manageable set of stem rust progress curves to be used for more accurate breeding programs, estimating yield loss, and predicting epidemics.
Although Southern and Wilcoxson (Citation1984) reported the effect of sowing date on slow rusting in resistant wheat varieties against P. graminis f. sp. tritici, they did not compared different predictors of wheat stem rust progress curves at various sowing dates. To the best of our knowledge, this appears to be the first report of significant effects of sowing date and cultivar resistance on the five stem-rust-progress-curve elements studied. Earlier sowing of susceptible cultivars showed AUDPC values similar to later sowings in this study, however, it reduced the maximum stem rust severity and exponential parameter b by 20% and 73%, respectively. This suggested that future breeding and control-efficiency programs for wheat stem rust should consider the maximum disease level and exponential rate factor in addition to the AUDPC criterion. Therefore, this new finding must be added to the previous recommendations on the adequacy of AUDPC to evaluate resistant genotypes or disease control operations for the wheat-stem-rust pathosystems (Eversmeyer et al. Citation1973). Moreover, the advanced sowing of susceptible cultivars reduced the exponential rate of wheat stem rust progress much more than that of resistant and semi-resistant cultivars examined in the current research. As proposed by Southern and Wilcoxson (Citation1984), the date of sowing may interact with the genotypic stem-rust-resistance of wheat in the form of slow rusting that needs further studies to explore possible mechanisms linked to such observations. Furthermore, this remarkable impact of sowing date on different drivers of temporal stem rust dynamics in cultivars with diverse resistant levels appears to be highly valuable for not only breeders but also pathologists and agronomists for sustainable wheat production. The accuracy of all the above-mentioned findings on the sowing date and cultivar resistance may be verified by the high variability in wheat stem rust progress data as specified in this study. According to the statement from Kranz (Citation2003), the linkage between a curve element and disease progression is dependent on data variability. The present five stem rust progress curves justified 67% of total variance in the disease data recorded over the four growing seasons of wheat at plot scale. The future research may include further influential agronomic variables to improve data variability and contributions of disease curves into wheat stem rust progress.
Earlier studies examined wheat stem rust progress according to final disease severity, coefficient of infection (Hei et al. Citation2015), infection rate, latent period and AUDPC (Vanderplank Citation1963; Kranz Citation2003) for either breeding or predicting purposes (Mideksa et al. Citation2018; Soko et al. Citation2018). However, none of them compared different stem rust curve elements for their descriptive value. The present findings classified the AUDPC, disease onset date, and maximum disease severity as descriptors of disease occurrence and intensity provided by the first principal component. These three most commonly used predictors explained nearly half of the total data variance. The second principal component, which is independent from the first principal component and its contributors, accounted for 20% of the data variance with moderate-high contributions from the exponential curve parameters. Therefore, this seems to be the first record of relationships between the commonly used and newly described curve elements for characterizing wheat stem rust progress.
A time-series analysis of historical data (1921–1961) collected from six regions of Mississippi, the USA, showed that the onset of wheat stem rust was associated with the time of disease-onset in previous 1–2 years (Yang Citation1995). Thus, one may conclude that the onset of wheat stem rust every year did not correspond to over-season variations in environmental conditions during the past 1–2 years. Hence, it was desired to know whether disease onset time is influenced by within season changes in wheat stem rust progress following different sowing dates. Although wheat stem rust onset was observed slightly earlier in late-very late sowings of wheat cultivars in the present study, there was no significant difference in the disease onset date between the levels of cultivar resistance and sowing date tested over four growing seasons. Therefore, this research evidenced the lack of significant effects of sowing date and cultivar resistance on wheat stem rust onset. Thus, the noticeable contribution of the disease onset time in stem rust progress in wheat crops according to the present PCA results needs further investigation to identify agro-ecological parameters effective on this easy-to-measure curve element.
Authors’ contributions
Naseri B: Designing and performing the work, data collecting, interpreting the data and writing the paper.
Ethical statement
The research presented in this manuscript did not involve any animal or human participants, therefore no ethics approval is required.
Data availability statement
The data that support the findings of this study are openly available in figshare at https://doi.org/10.6084/m9.figshare.20487651.
Disclosure statement
No potential conflict of interest was reported by the author(s).
Additional information
Funding
References
- Brusco MJ, Stahl S. 2005. Branch-and-bound applications in combinatorial data analysis. Statistics and computing. New York: Springer.
- Eversmeyer MG, Burleigh JR, Roelfs AP. 1973. Equations for predicting wheat stem rust development. Phytopathology. 63:348–351.
- Hauke J, Kossowski T. 2011. Comparison of values of Pearson’s and Spearman’scorrelation coefficients on the same sets of data. Quaest Geograph. 30:87–93.
- Hei N, Shimelis H, Laing M, Admassu B. 2015. Assessment of Ethiopian wheat lines for slow rusting resistance to stem rust of wheat caused by Puccinia graminis f. sp. tritici. J Phytopathol. 163:353–363.
- Kranz J. 2003. Comparison of temporal aspects of epidemics: the disease progress curves. In: J. Kranz, editor. Comparative epidemiology of plant diseases. Berlin, Heidelberg: Springer; p. 93–134.
- Luo W. 2008. Spatial/temporal modelling of crop disease data using high-dimensional regression [PhD thesis]. The University of Leeds.
- MacKenzie DR. 1976. Application of two epidemiological models for the identification of slow stem rusting in wheat. Phytopathology. 66:55–59.
- Mideksa T, Fininsa C, Hundie B. 2018. Analysis of climate variability effects on wheat stem rust (Puccinia graminis f. sp. tritici) epidemics in bale and arsi zones of Oromia regional state, Ethiopia. Am J Biol Environ Statis. 4:49–65.
- Naseri B, Jalilian F. 2021. Characterization of leaf rust progress in wheat cultivars with different resistance levels and sowing dates. Eur J Plant Pathol. 159:665–672.
- Naseri B, Kazemi H. 2020. Structural characterization of stripe rust progress in wheat crops sown at different planting dates. Heliyon. 6:e05328.
- Naseri B, Sabeti P. 2021. Analysis of the effects of climate, resistance level, maturity and sowing date on wheat stem rust epidemics. J Plant Pathol. 103:197–205.
- Naseri B, Sasani S. 2020. Cultivar, planting date and weather linked to wheat leaf rust development. Cereal Res Commun. 48:203–210.
- Naseri B, Sheikholeslami M. 2021. Progression of powdery mildew in susceptible-resistant wheat (Triticum aestivum) cultivars sown at different dates. J Phytopathol. 169:640–647.
- Payne RW, Murray DA, Harding SA, Baird DB, Soutar DM. 2009. Genstat®. Oxford (UK): VSN International.
- Pietravalle S, Shaw MW, Parker SR, Van Den Bosch F. 2003. Modeling of relationships between weather and Septoria tritici epidemics on winter wheat: a critical approach. Phytopathology. 93:1329–1339.
- Roelfs AP, Singh RP, Saari EE. 1992. Rust diseases of wheat: concepts and methods of disease management. Mexico: CIMMYT.
- Sharma S. 1996. Applied multivariate techniques. New York (USA): Wiley.
- Soko T, Bender CM, Prins R, Pretorius ZA. 2018. Yield loss associated with different levels of stem rust resistance in bread wheat. Plant Dis. 102:2531–2538.
- Southern JW, Wilcoxson RD. 1984. Effect of planting date on slow rusting of wheat by Puccinia graminis f. sp. tritici. Int J Trop Plant Dis. 1:21–24.
- Vanderplank JE. 1963. Plant diseases: epidemics and control. New York (USA): Academic Press.
- Wilcoxson RD. 1981. Genetics of slow rusting in cereals. Phytopathology. 71:989–993.
- Yang XB. 1995. Analysis of the long-term dynamics of stem and leaf rusts of wheat in North America using a time-series approach. J Phytopathol. 143:651–657.