
Abstract
Background: Glioma is the most common primary brain tumor, but its therapeutic effect is not very ideal up to now. The point of this study was to recognize the potential gene involved in lower-grade glioma (LGG) and to promote the treatment and prognosis for LGG patients. Method: During the investigation, we first studied the differential expression and the survival analysis of GNG5 in patients with glioma, LGG, and GBM, respectively. Then, independent prognostic analysis, the clinical relevance characteristics and the differential expressed genes (DEGs) were also evaluated. In addition, Metascape and GSEA analyses were carried out to achieve potential mechanism. Co-expression and immune infiltration analysis were finally conducted. Results: The results indicated that GNG5 as an independent prognostic indicator was negatively associated with the overall survival of LGG patients. Metascape and GSEA analyses showed that GNG5 may participate in complement and coagulation cascades pathway. The co-expression analysis was concluded that GNG5 was positively correlated with the following factors: C4B, PLAU, C1R, C1QC, C4A, SERPINA1, C1QB, CFI, C3. Conclusions: This study demonstrated that the highly expression of GNG5 in LGG may lead to poor prognosis. Besides, our research also revealed that GNG5 may be a promising immune-related biomarker for LGG patients.
KEYWORDS:
Introduction
Glioma is the most common primary tumor of the central nervous system in humans (Xi et al. Citation2015). The World Health Organization (WHO) classifies gliomas as grade I to grade IV. At the same time, gliomas can also be divided into lower-grade gliomas (LGGs) (grade II and III) or glioblastomas (GBMs) (grade IV) (Cejalvo et al. Citation2020). Lower-grade glioma (LGG), the most common histological type of glioma, is a heterogeneous tumor that may develop into high-grade malignant glioma which can severely shorten the survival time of patients (Xiao et al. Citation2020; Shi et al. Citation2021). Glioblastoma (GBM), the grade 4 astrocytoma with the highest degree of histological abnormalities, owns poor prognosis (Sales et al. Citation2016). Under present circumstances, the clinical treatment methods for gliomas include surgery, radiotherapy, chemotherapy, targeted therapy, immunotherapy, as well as electric field therapy and so on. The unfavorable prognosis of glioma and the high recurrence rate after initial treatment, nevertheless, still persist (Huang et al. Citation2020). The efficacy of these therapies is limited as well, therefore, it is urgent to find a new treatment for glioma.
Bioinformatics is a science that uses computers as tools to study biological information. Mainly research genomics and proteomics. Specifically, it is based on nucleic acid and protein sequences to study biological information. In silico evaluation approaches have been widely used to discover drug-target interactions. For example, potential therapeutic CDK2 inhibitors have been identified in silico to suppress cancer cell proliferation by regulating the cell cycle. It provides valuable therapeutic target for the treatment of tumors (Singh et al. Citation2021, Citation2020). Likewise, we wondered if we could identify the therapeutic targets for LGG patients through bioinformatics. Bioinformatics analysis techniques are generally used to discover genetic changes during tumorigenesis and development (Xue et al. Citation2020). In addition, the analysis of biological information has become an indispensable part of biological research (Raden et al. Citation2018). Previous study has identified potential biomarkers for glioblastoma by using bioinformatics analytical methods (Zhou et al. Citation2019).
Over the past few decades, it has been reported that a variety of biomarkers are related to maligant phenotype and prognosis of gliomas (Li et al. Citation2018). An increasing body of evidence suggests that molecular markers such as isocitrate dehydrogenase (IDH) 1/2 mutations, O-6-methylguanine-DNA methyltransferase (MGMT) promoter methylation, or 1p/19q co-deletion would for extraordinary vitality for the diagnosis, treatment and prognosis about patients for glioma (Dabrowski et al. Citation2018). There is a high incidence of IDH mutation for patients who are lower-grade gliomas, accounting for more than 70% (Taher et al. Citation2020). Moreover, the study for the epidemiology of IDH mutation is also mostly found in LGG patients, and the prognosis of IDH-mutations is better than IDH-wild types (Chen et al. Citation2018). Previously, some researchers have shown that the expression level of MGMT methylation can predict the sensitivity to temozolomide (TMZ) in glioma patients and those patients with MGMT promoter methylation had more therapeutic benefits from TMZ compared to those with an unmethylated promoter(Chen et al. Citation2019; Stupp et al. Citation2007). Oligodendrogliomas with 1p/19q co-deletion characteristics are usually present in an inert manner, and thus the reaction of chemotherapy is often better (Vigneswaran et al. Citation2015). But the treatment options for LGG patients remain limited. Therefore, discovering new biomarkers in gliomas is essential, which may be advantageous for the diagnosis, medication and prognosis of patients who are lower-grade glioma and serve as a milestone (Chen et al. Citation2019). Previous studies have confirmed that the expression of APOBEC3B and CD86, as well as hypoxia-related lncRNA, may be associated with the immune tumor microenvironment, affecting the prognosis of LGG (Qiu et al. Citation2021; Xu et al. Citation2021; Zhang et al. Citation2021). We wondered whether G Protein Subunit Gamma 5 (GNG5) was also immune-related and had a role in LGG. G protein is a signal transduction protein, which can regulate cells through signal pathway. In our study, we investigate the relationship between G Protein Subunit Gamma 5 (GNG5) and LGG.
In this study, GNG5 related bioinformatics analysis was carried out. Furthermore, the correlation of clinical features and GNG5 was performed. Moreover, the GNG5 pathway was found to be complement and coagulation cascades pathway by Metascape and GSEA analyses, and immune infiltration analysis was further investigated. In the end, co-expression analysis was carried out.
Due to the limited current treatments and the poor prognosis for LGG, it is urgent for us to find a new treatment strategy to enhance the overall survival and improve their life. It has been shown that immune microenvironment plays a key role in tumor development (Anderson and Simon Citation2020). Our study suggests that GNG5 may be involved in immune infiltration and could provide a new therapeutic approach for LGG patients by affecting GNG5 expression. Overall, this study would provide a novel target for the therapy of the patients with lower-grade gliomas, which will help with subsequent treatment in the future (Geng et al. Citation2018).
Materials and methods
Data obtaining and preprocessing
Two datasets were obtained from the GPL570 platform of the Gene Expression Omnibus (GEO) (Barrett et al. Citation2013), containing GSE4290 (with a total sample size of 180 including 23 normal brain tissues and 157 brain tumors), GSE68848 (with 28 normal brain tissues and 320 gliomas). GSE16011 (with 8 normal brains and 276 gliomas) from the GPL8542 platform was also acquired. The gene expression profile information and the relating clinical information of a total of 1018 mRNA sequenced glioma patients were acquired from The Chinese Glioma Genome Atlas (CGGA) database (Zhao et al. Citation2021). Besides, 702 mRNA-sequenced glioma samples were also obtained from The Cancer Genome Atlas (TCGA) database (Wang et al. Citation2016). The expression data extracted from the glioma samples were modified and integrated together, then loaded into R software for analysis (Sepulveda Citation2020).
GNG5 expression in Normal and tumor tissues and GEPIA Database analysis
GraphPad Prism 8.0 was used to detect the differential expression of GNG5 between glioma, lower-grade glioma (LGG), and glioblastoma (GBM) tissues compared with normal tissues. The difference with P < 0.05 was considered a meaningful standard which was statistically significant. GEPIA is an intelligent media web server that analyzes RNA sequencing expression profile information for disease of tumor and ordinary gene expression analysis from the TCGA and GTEx projects (Tang et al. Citation2017). GEPIA might lead with recognizing the differential expression level of the GNG5 gene between normal tissues and glioma tissues.
HPA database analysis
HPA is a website which can be used to detect protein expression in three dimensions: cells, normal and tumor tissues (Thul and Lindskog Citation2018). The individual differential expression of the GNG5 gene at the protein level between normal tissues and glioma patients was obtained by utilizing the website HPA.
Immunohistochemical (IHC) staining
The LGG sample tissues used for immunohistochemical staining were all from the Second Hospital of Hebei Medical University. Tissue sections were deparaffinized in xylene and hydrated in graded alcohol. The blocked antigen-binding sites were opened by heating the EDTA antigen retrieval solution. After blocking with endogenous peroxidase and goat working serum, the sections were incubated with GNG5 primary antibody (1:100, Cusabio Biotech, China) at 4°C overnight. The next day, biotin-labeled goat anti-rabbit secondary antibody was added dropwise and incubated for 1 h at room temperature. Then add an appropriate amount of biotin–streptavidin-horseradish peroxidase (HRP) and incubate for 30 min at room temperature. Slides were stained with 3,3-diaminobenzidine (DAB) and rinsed in water, then counterstain with hematoxylin. The staining results were observed under a light microscope.
Survival analysis filtering
From the CGGA and TCGA databases, we loaded the survival software package into R software and calculated the gene expression profile and survival data using Kaplan-Meier (K-M) analysis. A p-value <0.001 was viewed as a statistical criterion.
Receiver operating characteristic curve analysis
From the CGGA and TCGA databases, ROC curves were plotted utilizing gene expression information to assess the predictive power of the model.
Independent prognostic analysis filtering
Univariate and multivariate COX analyses using the LGG gene expression information from CGGA were performed to determine whether GNG5 was an independent prognostic indicator for LGG on the basis of the selection criteria of an adjusted p-value <0.001.
Clinical relevance filtering
R software was performed to analyze the LGG gene expression profile information and the relating clinical features utilizing the CGGA database, p-value <0.05 was of significance. LGG gene expression information from TCGA dataset was also analyzed by Ualcan online website (Chandrashekar et al. Citation2017).
Correlation analysis, differential expressed genes analysis and enrichment pathway analysis
The correlation analysis of LGG from the CGGA database was conducted by R software with correlation coefficient greater than 0.5 and p-value <0.05. The mRNA sequencing data in LGG from the CGGA data set were normalized, and the differential expressed genes (DEGs) significantly up-regulated and down-regulated were obtained, with adjusted p-value <0.05 and absolute log2 fold change (FC) >1.5. Then put the DEGs into Metascape online website, and got corresponding pathways (Zhou et al. Citation2019). GSEA (Gene set enrichment analysis), which was performed to determine those signaling pathways associated with the high and low GNG5 groups, is a method of uncovering genomic expression data through basic knowledge (Subramanian et al. Citation2005). The expression level of GNG5 was served as a phenotypic marker. We use false discovery rate (FDR) and normalized enrichment score (NES) to illustrate the level of enrichment at a significance level of NES >1and FDR <0.05.
Co-expression analysis
Co-expression investigation of the GNG5 gene was performed by utilizing the limma packet in R software. The heatmap was plotted using the top 20 positively and negatively genes from correlation genes. The corlot and Circlize software packages were used to draw the circle map of the intersection genes which were under the pathway and the differential genes.
Immune infiltration analysis
Tumor Immune Estimation Resource may be a thorough computational apparatus to investigate the interactions between tumor-infiltrating lymphocytes and significant biological signatures (Li et al. Citation2020). According to the correlation of the different levels of GNG5 expression in LGG with the immune infiltration, we plotted graphs using the Timer ‘gene’ module. The single-sample gene set enrichment analysis (ssGSEA) was also conducted to estimate the association of GNG5 expression with immune cells.
Results
Differential expression analysis and prognosis analysis of GNG5
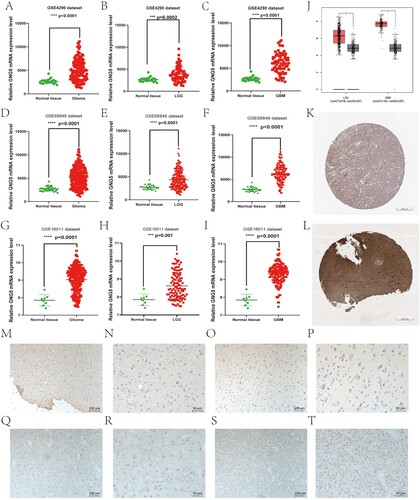
The flow chart for our study is indicated in Figure . We concentrated on GNG5 expression levels from different databases. It can be seen from the figure that the expression levels of the GNG5 gene in GSE4290, GSE68848, and GSE16011 were different in normal and tumor tissues, with higher expression levels in tumor tissues and lower expression levels in normal (Figure A-I). Moreover, the expression levels of the GNG5 gene were also fundamentally distinctive among the three groups, *P < 0.05. What’s more, the expression level of the specific gene in LGG and GBM was also fundamentally higher than that in normal subjects, which we obtained from the TCGA database using the GEPIA website (Figure J). To confirm that the GNG5 gene expression was also high at the protein level, we obtain the representative images of immunohistochemistry staining through the HPA. At the protein level, the immunohistochemical staining intensity of the tissues of LGG patients (staining: high; intensity: strong; quantity: >75%) (Figure K) was significantly stronger than that of normal (staining: medium; intensity: moderate; quantity: >75%) (Figure L). Consistent with the HPA, our immunohistochemical staining results using LGG tissue sections showed that GNG5 was highly expressed in WHO grade II (Figure M–P) and WHO grade III (Figure Q–T).
Figure 1. Flow chart of our study.
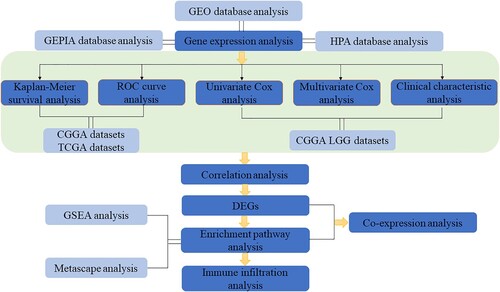
Figure 2. Differential expression of GNG5 in different database. GNG5 expression in glioma (A), LGG (B), and GBM (C) patients in GSE4290. GNG5 expression in glioma (D), LGG (E) and GBM (F) patients in GSE50161. GNG5 expression in glioma (G), LGG (H) and GBM (I) patients in GSE66354. (J) GNG5 expression in LGG and GBM patients by using online GEPIA. (K) The protein level of GNG5 in normal tissue by using online HPA website (staining: medium; intensity: moderate; quantity: >75%). (L) The protein level of GNG5 in LGG tissue by using online HPA website (staining: high; intensity: strong; quantity: >75%). Results of immunohistochemical staining of glioma with WHO grade II (M-P) and WHO grade III (Q-T).
Survival analysis and predictive ability of GNG5 in the CGGA and TCGA databases
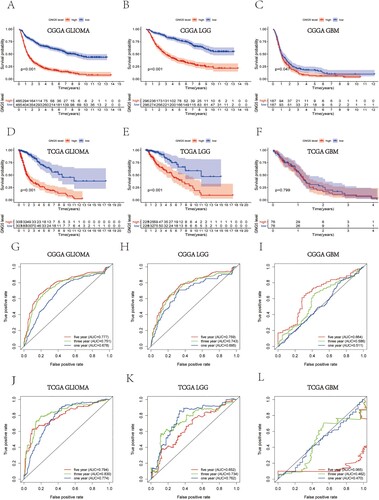
The survival analysis utilizing the information from the CGGA database suggested that gliomas with low expression of the GNG5 gene owned higher survival ability and a better prognosis. In comparison, patients who have high expressions of the GNG5 gene had a lower survival ability and a poor prognosis (Figure A). GNG5 with low expression in LGG also had a better survival ability (Figure B). However, the level of GNG5 expression in GBM had no significant difference in the survival ability of patients (Figure C). Similarly, survival analysis from the TCGA database is consistent with that of CGGA database (Figure D–F). ROC curve analysis utilizing the CGGA database suggested that GNG5 was a predictor, and the areas under the curve (AUC) of 1-, 3-, and 5-year survival were 0.678, 0.751, and 0.777, respectively, in glioma (Figure G). The ROC curve of LGG also indicates that GNG5 is a great predictor, and the AUC of 1-, 3-, and 5-year survival were 0.695, 0.743, and 0.759, respectively (Figure H). While, the AUC of 1-, 3-, and 5-year survival in GBM patients were only 0.511, 0.586, and 0.664, respectively (Figure I). At the same time, the results from the TCGA database also confirmed the results of CGGA database mentioned above and the areas under the curves for the 1-, 3-, and 5-year survival in the TCGA database were 0.774, 0.830, and 0.794, respectively, in glioma (Figure J), and were 0.762, 0.734, and 0.652, respectively, in the LGG patients (Figure K). While, GNG5 was not a very good predictor in the GBM since the survival rate for GBM is low, and the AUC was 0.474 at 1 year, 0.518 at 3 years, and 0.141 at 5 years, respectively (Figure L). The ROC curves indicate that the accuracy of this model is high, indicating that GNG5 is an excellent predictive marker in glioma and LGG.
Figure 3. Survival analysis and prognostic ability of GNG5 in different database. Survival analysis in glioma (A), LGG (B) and GBM (C) patients from the CGGA database. Survival analysis in glioma (D), LGG (E) and GBM (F) patients from the TCGA database. ROC curve analysis in glioma (G), LGG (H) and GBM (I) patients from the CGGA database. ROC curve analysis in glioma (J), LGG (K) and GBM (L) patients from the TCGA database.
Independent prognosis analysis of GNG5 in the CGGA database
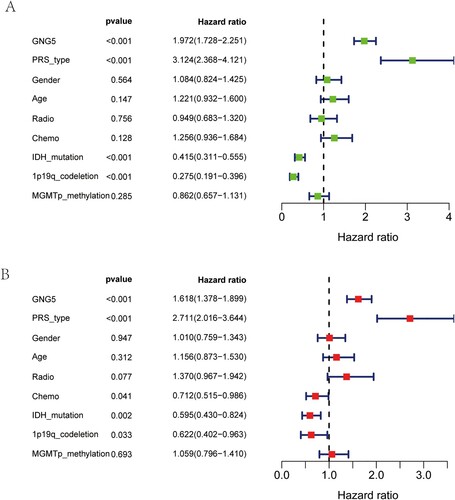
Univariate Cox analysis, which using LGG information from the CGGA database, suggested that GNG5 (HR = 1.972; 95% CI: 1.728-2.251; P <0.001) was a high-risk factor for patients with lower-grade glioma. Beyond that, primary-recurrent-secondary (PRS) type (HR = 3.124; 95% CI: 2.368-4.121; P <0.001) could also raise hazard structure components for LGG patients. On the contrary, as illustrated in the Figure (A), IDH mutation (HR = 0.415; 95% CI: 0.311-0.555; P <0.001), 1p19q co-deletion (HR = 0.275; 95% CI: 0.191-0.396; P <0.001) were low-risk factors. There was no significant difference in the prognosis by gender, age, radiotherapy, chemotherapy or MGMT promoter methylation in glioma (Figure A). Multivariate analysis suggested that GNG5 (HR = 1.618; 95% CI: 1.378-1.899; P < 0.001) might have been independent of the overall survival (OS) of LGG patients, meaning that GNG5 may be a factor that independently affects the occurrence, development and prognosis of patients with lower-grade glioma. What's more, PRS type (HR = 2.711; 95% CI: 2.016-3.644; P < 0.001), chemotherapy (HR = 0.712; 95% CI: 0.515-0.986; P = 0.041), IDH mutation (HR = 595; 95% CI: 0.430-0.824; P = 0.002), and 1p19q co-deletion (HR = 0.622; 95% CI: 0.402-0.963; P = 0.033) might additionally be elements which have independent predictive power. However, gender, age, radiotherapy, and MGMT promoter methylation had no significance for the prognosis of glioma (Figure B).
Figure 4. Independent prognosis analysis of GNG5 in the CGGA database. Univariate analysis (A) and multivariate analysis (B) of GNG5 in LGG patients.
Correlation between GNG5 expression level and clinical characteristics
Based on the analysis of LGG samples in the CGGA database, it might have been discovered that the differential expression of the GNG5 gene was closely related to grade and WHO grade III was higher GNG5 expression than WHO grade II (Figure A). As for primary, recurrent and secondary status, it can be seen that the expression of GNG5 in recurrent LGG gliomas was higher than primary pathological types (Figure B). As the same result, the expression levels of GNG5 in recurrent astrocytoma (rA), recurrent anaplastic astrocytoma (rAA), recurrent anaplastic oligodendroglioma (rAO) and recurrent oligodendroglioma (rO) were higher than that in corresponding primary pathological types (Figure E). Previous researches showed that glioma patients with IDH-mutation or 1p/19q co-deletion had a better prognosis than that in IDH-wildtype or 1p/19q non-codeletion (Weller et al. Citation2015). Coincidentally, the patients who were 1p/19q co-deletion or IDH-mutation own lower GNG5 expression than 1p/19q non-codeletion or IDH-wildtype according to our study (Figure C,D). What we got from the TCGA database is consistent with the CGGA. There was no statistical significance in age and gender for LGG patients (Figure F,H). GNG5 expression level of patients who are grade 3 was higher than grade 2, consistent with the results of the CGGA dataset (Figure G). The expression of GNG5 in astrocytoma is higher than that in oligoastrocytoma, and oligodendroglioma is the lowest, which is also consistent with the results of the CGGA (Figure I). LGG patients with TP53 mutation have been reported to have a worse prognosis than TP53-nonmutation (Zhang et al. Citation2022). Interestingly, the expression of GNG5 in LGG patients with TP53 mutation is higher than without TP53 mutation according to our study (Figure J). LGG clinical characteristic information from TCGA database was also performed to confirmed that GNG5 was associated with grade (P = 1.7430501486615E-14), histological subtypes (Table ), and TP53 mutation status (P = 3.34759999720546E-08). There was no significant difference in patients’ age (Table ).
Figure 5. The association between the expression level of GNG5 and clinical characteristics. CGGA database: (A) Grade; (B) PRS type; (C) 1p19q co-deletion status; (D) IDH mutation status; (E) Histology. TCGA database: (F) Age; (G) Grade; (H) Gender; (I) Histological subtypes; (J) TP53 mutation status.
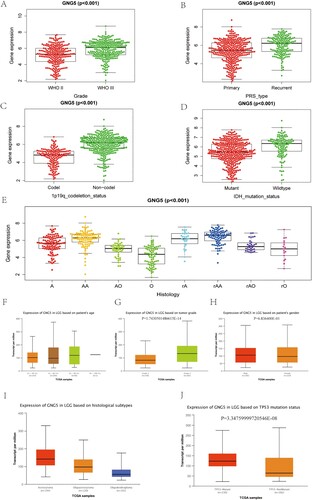
Table 1. Expression of GNG5 in LGG based on patients’ age.
Table 2. Expression of GNG5 in LGG based on histological subtypes.
Correlation analysis, differential expressed genes analysis, enrichment pathway analysis and co-expression analysis of GNG5
We got 4517 positive and 29 negative genes associated with GNG5 from the correlation analysis. Through differential expressed analysis, 118 genes were obtained, of which 105 were positive and 13 were negative. Metascape analysis showed the possible pathways GNG5 may participate in (Figure A). GSEA can be utilized to determine the signaling pathways of differential expression in LGG between high – and low-risk groups. As stated by the data coming out, there was a statistical significance in the enrichment analysis (NES > 1, FDR < 0.05) of GSEA. Signaling pathways with the significant enrichment were chosen on the support of a normalized enrichment score (NES) and the false discovery rate (FDR). The complement and coagulation cascades pathway (NES = 1.7, P = 0.029) was both enriched by Metascape analysis and GSEA analysis (Figure B). The heatmap was plotted using the top 20 positively and negatively genes from correlation genes (Figure C). As shown in the Venn diagram (Figure D), the intersection genes were achieved with the DEGs and the complement and coagulation cascades pathway. And then, the circular plot of the 9 intersection genes was also plotted (Figure E). As shown in the figure, GNG5 was positively associated with C4B, PLAU, C1R, C1QC, C4A, SERPINA1, C1QB, CFI, C3. The correlation coefficients between these factors and GNG5 can be seen in Table .
Figure 6. Enrichment pathway analysis and co-expression analysis of GNG5. (A) Metascape analysis. (B) GSEA analysis. (C) Heatmap of the top 20 genes positively and negatively correlated with GNG5. (D) Venn diagram of DEGs and the complement and coagulation cascades pathway. (E) A circular plot of the 9 intersection genes.
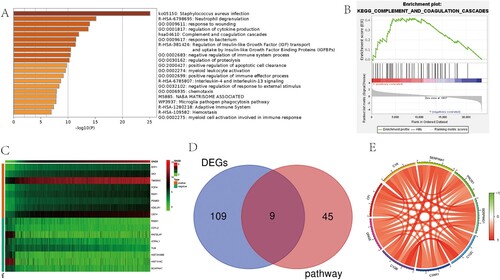
Table 3. Correlation between GNG5 and the 9 intersecting genes.
Immune infiltration analysis of GNG5
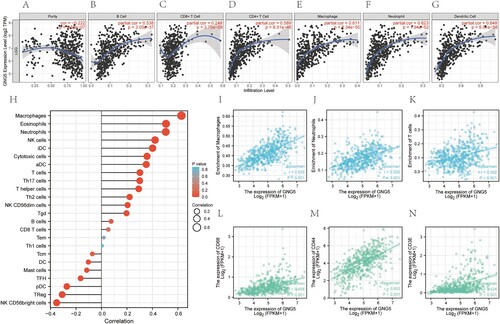
According to TIMER analysis, for patients who with lower-grade gliomas, GNG5 was negatively associated with tumor purity (Cor = −0.222, P = 9.62e-07), and might have been positively related to B cells (Cor = 0.538, P = 3.05e-37), CD8 + T cells (Cor = 0.248, P = 3.75e-08), CD4 + T cells (Cor = 0.589, P = 8.01e-46), macrophages (Cor = 0.611, P = 8.34e-50), neutrophils (Cor = 0.623, P = 1.94e-52), and dendritic cells (Cor = 0.648, P = 6.01e-58) (Figure A–G). We also perform the immune infiltration analysis using ssGSEA algorithm. The lollipop chart was plotted showing the correlation between GNG5 and various immune cells (Figure H). Combining the two algorithms of TIMER and ssGSEA, we obtained three common immune cells: macrophages, neutrophils, and T cells. Then the relationships of GNG5 and the common immune cells were analyzed. GNG5 was positively related to macrophages (Cor = 0.628, P <0.001), neutrophils (Cor = 0.505, P <0.001) and T cells (Cor = 0.302, P <0.001) (Figure I–K). We also investigated the association of GNG5 with these three immune cells corresponding markers. GNG5 was also positively associated with CD68 (Cor = 0.498, P <0.001), CD44 (Cor = 0.603, P <0.001) and CD3E (Cor = 0.434, P <0.001) (Figure L–N).
Figure 7. Immune infiltration analysis of GNG5. (A-G). Relationship between the expression level of GNG5 and Purity (A), B cell (B), CD8+ T cell (C), CD4+ T cell (D), Macrophage (E), Neutrophil (F), Dendritic Cell (G) of LGG patients using Timer multiple algorithms. (H). Correlations between the expression of GNG5 and various immune cells based on ssGSEA analysis. (I-K). Correlation analysis of the expression of GNG5 with the common immune cells derived from the above two algorithms. (I). Macrophages. (J). Neutrophils. (K). T cells. (L-N). Correlations between the expression of GNG5 and the corresponding markers of common immune cells. (L). CD68. (M). CD44. (N). CD3E.
Discussion
Lower-grade glioma is one of the ordinary invasive types in primary intracranial malignancy tumors in adults, which can be separated into diffuse low-grade and intermediate-grade gliomas (Ostrom et al. Citation2018). In the past four decades, despite an extensive treatment regimen that includes maximum surgical excision, and radiation and chemotherapy after surgery, the prognosis of LGG has not improved (Claus et al. Citation2015). The overall survival of LGG is estimated to be between 1 and 15 years due to the different sensitivity of each patient to treatment and the unique inherent characteristics and clinical heterogeneity of lower-grade gliomas (Brat et al. Citation2015). Although histopathological classifications of LGG have traditionally been used to predict clinical outcomes, there is considerable variation within and between observers, so it is very difficult to predict results particularly accurately even at the same grade (van den Bent Citation2010). Thus, it is urgent to find new molecular biomarkers for the genetic classification of LGG, and this is what we should strive for. Our efforts may provide novel biomarkers for the diagnosis, therapy and prognosis of LGG. Furthermore, the patients with lower-grade gliomas may also benefit from our discovery.
In this study, we first investigated the differential analysis of GNG5 expression in normal tissues and glioma patients by three data sets in GEO and two online websites include GEPIA and HPA. We found that GNG5 expression in LGG was particularly higher than that in normal tissues, which was confirmed by multiple databases. The key gene GNG5 belongs to the GNG gene family, which was to be linked to cancer as stated by those past reports. For example, GNG2 has proven to be a prognostic indicator in patients with human malignant melanoma cells, and GNG3 can be seen as a potential biomarker for glioblastoma (Yajima et al. Citation2014; Zhou et al. Citation2019). So, we speculated that GNG5 may also associated with the prognosis of glioma and further performed following investigations. The survival analysis indicated that GNG5 with low expression might closely relevant to the superior prognosis for patients with glioma and LGG. Furthermore, ROC curve analysis was investigated to confirm that the AUC of GNG5 in 1,3 and 5 years were all >0.6, implying that GNG5 might be a survival predictor. Combined with independent prognostic analysis including univariate and multivariate cox analysis, we concluded that GNG5 might be a factor which can elevate risks and can be seen as an element for independent prognostic for LGG patients. Since GNG5 had significant statistical significance in LGG, the subsequent studies focused on LGG patients. In general, these results suggest that GNG5 is up-regulated in lower-grade gliomas and glioblastomas, and GNG5 has prognostic value in LGG, showing that GNG5 might assume a critical regulatory role in lower-grade glioma. It also can be seen in HPA website that GNG5 was related to colorectal, breast, thyroid cancers and so on. We presumed that GNG5 could be regarded as a prognostic biomarker for many cancers. In the future, we will conduct multidisciplinary cooperation with other relevant medical disciplines to explore this protein and strive to find more novel molecular markers with clinical significance.
Besides, Metascape analysis and GSEA analysis were performed, and the results confirmed that GNG5 was relative to the complement and coagulation cascades pathway. Co-expression analysis suggested that GNG5 might positively relevant to C4B, PLAU, C1R, C1QC, C4A, SERPINA1, C1QB, CFI, C3. As previously reported, inhibition of complement production by C4B may be a novel anti-tumor strategy (Wang et al. Citation2020). Down-regulating PLAU inhibits the proliferation and migration of pancreatic cancer cells (Zhao et al. Citation2020). DNA-methylation in C1R is a prognostic biomarker for acute myeloid leukemia (Bozic et al. Citation2015). C1QC was relevant to the overall survival of soft tissue sarcoma and cervical cancer (Zhang et al. Citation2020; Li et al. Citation2021). In patients with gastric cancer, C4A were significantly overexpressed (Cheng et al. Citation2018). SERPINA1 with other genes establish gene signature which was found relative to breast cancer and colon cancer (Du et al. Citation2020; Xu et al. Citation2020). C1QB was identified a novel gene with prognostic value in gastric cancer and a potential factor in osteosarcoma (Jiang et al. Citation2020; Chen et al. Citation2021). The CFI gene plays an anti-cancer role in Ewing's sarcoma cells (Kerschner-Morales et al. Citation2020). Overexpression of complement C3 activates the JAK2/STAT3 pathway and is associated with the progression of gastric cancer (Yuan et al. Citation2020). These studies suggest that the genes we performed co-expression analysis were related to various cancers. Our research indicated that GNG5 was correlated with these genes, suggesting that GNG5 might take part in the occurrence and development of lower-grade glioma.
In the end, we conducted the immune infiltration analysis and came to the conclusion that GNG5 was negatively relevant to tumor purity, and was positively related to B cells, CD8 + T cells, CD4 + T cells, macrophages, neutrophils, and dendritic cells by TIMER which is using six state-of-the-art algorithms (Li et al. Citation2020). We also perform the immune infiltration analysis using ssGSEA algorithm. Then three common immune cells: macrophages, neutrophils, and T cells were obtained. The corresponding markers of these immune cells have also been identified. CD68 is highly expressed in macrophages and regarded as a valuable cytochemical marker to macrophages in the immunohistochemical analysis of tumor tissues (Chistiakov et al. Citation2017). CD68 also showed a good predictive value as a prognostic marker of survival in various cancer patients (Zhang et al. Citation2012). CD44 which is highly expressed in neutrophils promotes neutrophils adhesion (Iqbal et al. Citation2022). Due to its adhesive property, CD44 is of great significance to tumor invasion (Hong et al. Citation2010). CD3E molecular antigen is a highly specific marker for T cells and is present in most T cell tumors. CD3E which is involved in signal transduction inside T cells after antigen recognition plays central and multiple roles for CD3E in T cell development and function (Dave Citation2011). Our further investigation showed that the correlations between GNG5 and these markers were high and statistically significant. It indicated that GNG5 may be an immune-related factor. The immune system acts a pivotal part in controlling tumor growth, as do immune cells. For example, dendritic cells are important antigen-presenting cells that present antigens to T cells, which need be activated to kill the antigen-carrying tumor cells. Previously, an article in which dendritic cells were treated as antigen-presenting cells to present tumor cell antigen to vaccination and activate the immune response for anti-tumor immunotherapy (Harari et al. Citation2020). B cells are also critical immune cells which can influence the therapy of tumors. It has been reported that B cells are connected with the survival of tumor (Petitprez et al. Citation2020). Other immune cells have similar anti-tumor functions. Therefore, we could manage the immune response of tumor cells through the GNG5 gene, thus affecting tumor growth.
To the best of our knowledge, our article is the first to investigate the effect of GNG5 on the survival and prognosis of LGG. It has been confirmed that GNG5 is overexpressed in gliomas, predicting a poor prognosis (Yang et al. Citation2020). However, there was no report on the predictive value of GNG5 in lower grade gliomas so far. There are also certain limitations to our research. Although immunohistochemistry was conducted to verify that GNG5 expression is high in LGG tissues, we still lack adequate in vitro or in vivo experiments to support our view. In fact, our article aims to screen out genes that are viable for LGG at the level of bioinformatics analysis.
Conclusions
To sum up, this study demonstrated the relationship between GNG5 and the prognosis of lower-grade gliomas. Firstly, we investigated the differential analysis of GNG5 expression. Then the correlation between GNG5 and prognosis and clinical characteristics was analyzed. In addition, the mechanism of GNG5 was clarified. Co-expression analysis and immune infiltration analysis were further performed. The conclusion is that the prognosis of lower-grade gliomas with high expression level of GNG5 is poor, and GNG5 is a high-risk factor, which has also been discovered to be an independent prognostic immune-related indicator for lower-grade glioma patients. At the same time, it is possible to see the role of GNG5 in LGG treatment in years to come.
Data availability statement
The data that support the findings of this study are available in [Gene Expression Omnibus (GEO)] at [https://www.ncbi.nlm.nih.gov/geo], reference (Barrett et al. Citation2013), [The Chinese Glioma Genome Atlas (CGGA)] at [http://www.cgga.org.cn/], reference (Zhao et al. Citation2021), [The Cancer Genome Atlas (TCGA)] at [https://portal.gdc.cancer,gov/repository], reference (Wang et al. Citation2016), [Gene Expression Profiling Interactive Analysis (GEPIA)] at [http://gepia.cancer-pku.cn/], reference (Tang et al. Citation2017), [The Human Protein Atlas (HPA)] at [http://www.proteinatlas.org], reference (Thul and Lindskog Citation2018), [Ualcan] at [http://ualcan.path.uab.edu.], reference (Chandrashekar et al. Citation2017), [Metascape] at [http://metascape.org/gp/index.html#/main/step1], reference (Zhou et al. 2019), [Tumor Immune Estimation Resource(TIMER)] at [http://timer.cistrome.org], reference (Li et al. Citation2020). The raw data that support the immunohistochemical staining experiment of this study are available in figshare at https://doi.org/10.6084/m9.figshare.19682871.
Ethical approval and consent to participate
The samples used for the experiments in this study were obtained from the Pathology Laboratory of the Second Hospital of Hebei Medical University. The study was approved by the ethics committee of the Second Hospital of Hebei Medical University (2019-R191). The ethics committee waived the requirement for obtaining informed consent for this retrospective study on stored samples.
Acknowledgements
XX was responsible for the overall design of this study and the revision of the manuscript. XT collected the data, performed the data analysis and edited the manuscript. HZ contributed to the conception, revised the figures, tables and our draft. LH contributed to the acquisition of the data, validated the data analysis and drafted the work. HL contributed to the acquisition and the interpretation of the data and drafted the manuscript. JL contributed to the design of the work and drafted the work. YL contributed to the study design and revised the manuscript for important intellectual content. All authors contributed to the article and approved the submitted version.
Disclosure statement
The authors declare that the research was conducted in the absence of any commercial or financial relationships that could be construed as a potential conflict of interest.
Additional information
Funding
References
- Anderson NM, Simon MC. 2020. The tumor microenvironment. Current Biol: CB. 30:R921–r925. doi:10.1016/j.cub.2020.06.081.
- Barrett T, Wilhite SE, Ledoux P, Evangelista C, Kim IF, Tomashevsky M, Marshall KA, Phillippy KH, Sherman PM, Holko M, et al. 2013. NCBI GEO: archive for functional genomics data sets–update. Nucleic Acids Res. 41:D991–D995. doi:10.1093/nar/gks1193.
- Bozic T, Lin Q, Frobel J, Wilop S, Hoffmann M, Muller-Tidow C, Brummendorf TH, Jost E, Wagner W. 2015. DNA-methylation in C1R is a prognostic biomarker for acute myeloid leukemia. Clin Epigenetics. 7:116. doi:10.1186/s13148-015-0153-6.
- Cancer Genome Atlas Research, N., Brat DJ, Verhaak RG, Aldape KD, Yung WK, Salama SR, Cooper LA, Rheinbay E, Miller CR, Vitucci M, et al. 2015. Comprehensive, integrative genomic analysis of diffuse lower-grade gliomas. N Engl J Med. 372:2481–2498. doi:10.1056/NEJMoa1402121.
- Cejalvo T, Gargini R, Segura-Collar B, Mata-Martinez P, Herranz B, Cantero D, Ruano Y, Garcia-Perez D, Perez-Nunez A, Ramos A, et al. 2020. Immune profiling of gliomas reveals a connection with IDH1/2 mutations. Tau Function and the Vascular Phenotype. Cancers (Basel). 12. doi:10.3390/cancers12113230.
- Chandrashekar DS, Bashel B, Balasubramanya SAH, Creighton CJ, Ponce-Rodriguez I, Chakravarthi B, Varambally S. 2017. UALCAN: A portal for facilitating tumor subgroup gene expression and survival analyses. Neoplasia (New York, N.Y.). 19:649–658. doi:10.1016/j.neo.2017.05.002.
- Chen LH, Liu JF, Lu Y, He XY, Zhang C, Zhou HH. 2021. Complement C1q (C1qA, C1qB, and C1qC) May Be a potential prognostic factor and an index of tumor microenvironment remodeling in osteosarcoma. Front Oncol. 11:642144. doi:10.3389/fonc.2021.642144.
- Chen X, Yan Y, Zhou J, Huo L, Qian L, Zeng S, Li Z, Wei J, Xu Z, Gong Z. 2019. Clinical prognostic value of isocitrate dehydrogenase mutation, O-6-methylguanine-DNA methyltransferase promoter methylation, and 1p19q co-deletion in glioma patients. Ann Transl Med. 7:541. doi:10.21037/atm.2019.09.126.
- Chen YH, Hueng DY, Tsai WC. 2018. Proteolipid protein 2 overexpression indicates aggressive tumor behavior and adverse prognosis in human gliomas. Int J Mol Sci. 19. doi:10.3390/ijms19113353.
- Cheng CW, Chang CC, Patria YN, Chang RT, Liu YR, Li FA, Shih HM, Lin CY. 2018. Sex hormone-binding globulin (SHBG) is a potential early diagnostic biomarker for gastric cancer. Cancer Med. 7:64–74. doi:10.1002/cam4.1254.
- Chistiakov DA, Killingsworth MC, Myasoedova VA, Orekhov AN, Bobryshev YV. 2017. CD68/macrosialin: not just a histochemical marker. Lab Invest. 97:4–13. doi:10.1038/labinvest.2016.116.
- Claus EB, Walsh KM, Wiencke JK, Molinaro AM, Wiemels JL, Schildkraut JM, Bondy ML, Berger M, Jenkins R, Wrensch M. 2015. Survival and low-grade glioma: the emergence of genetic information. Neurosurg Focus. 38:E6. doi:10.3171/2014.10.FOCUS12367.
- Dabrowski MJ, Draminski M, Diamanti K, Stepniak K, Mozolewska MA, Teisseyre P, Koronacki J, Komorowski J, Kaminska B, Wojtas B. 2018. Unveiling new interdependencies between significant DNA methylation sites, gene expression profiles and glioma patients survival. Sci Rep. 8:4390. doi:10.1038/s41598-018-22829-1.
- Dave VP. 2011. Role of CD3epsilon-mediated signaling in T-cell development and function. Crit Rev Immunol. 31:73–84. doi:10.1615/critrevimmunol.v31.i1.70.
- Du JX, Chen C, Luo YH, Cai JL, Cai CZ, Xu J, Ni XJ, Zhu W. 2020. Establishment and validation of a novel autophagy-related gene signature for patients with breast cancer. Gene. 762:144974. doi:10.1016/j.gene.2020.144974.
- Geng RX, Li N, Xu Y, Liu JH, Yuan FE, Sun Q, Liu BH, Chen QX. 2018. Identification of core biomarkers associated with outcome in glioma: evidence from bioinformatics analysis. Dis Markers. 2018:3215958. doi:10.1155/2018/3215958.
- Harari A, Graciotti M, Bassani-Sternberg M, Kandalaft LE. 2020. Antitumour dendritic cell vaccination in a priming and boosting approach. Nat Rev Drug Discov. 19:635–652. doi:10.1038/s41573-020-0074-8.
- Hong X, Nelson KK, deCarvalho AC, Kalkanis SN. 2010. Heparanase expression of glioma in human and animal models. J Neurosurg. 113:261–269. doi:10.3171/2009.9.Jns09682.
- Huang L, Li X, Ye H, Liu Y, Liang X, Yang C, Hua L, Yan Z, Zhang X. 2020. Long non-coding RNA NCK1-AS1 promotes the tumorigenesis of glioma through sponging microRNA-138-2-3p and activating the TRIM24/Wnt/beta-catenin axis. J Exp Clin Cancer Res. 39:63. doi:10.1186/s13046-020-01567-1.
- Iqbal AJ, Krautter F, Blacksell IA, Wright RD, Austin-Williams SN, Voisin MB, Hussain MT, Law HL, Niki T, Hirashima M, et al. 2022. Galectin-9 mediates neutrophil capture and adhesion in a CD44 and β2 integrin-dependent manner. FASEB J. 36:e22065. doi:10.1096/fj.202100832R.
- Jiang J, Ding Y, Wu M, Lyu X, Wang H, Chen Y, Wang H, Teng L. 2020. Identification of TYROBP and C1QB as Two novel Key genes With prognostic value in gastric cancer by network analysis. Front Oncol. 10:1765. doi:10.3389/fonc.2020.01765.
- Kerschner-Morales SL, Kuhne M, Becker S, Beck JF, Sonnemann J. 2020. Anticancer effects of the PLK4 inhibitors CFI-400945 and centrinone in ewing's sarcoma cells. J Cancer Res Clin Oncol. 146:2871–2883. doi:10.1007/s00432-020-03346-z.
- Li G, Wang Z, Zhang C, Liu X, Yang F, Sun L, Liang J, Hu H, Liu Y, You G, et al. 2018. MEGF10, a glioma survival-associated molecular signature, predicts IDH mutation status. Dis Markers. 2018:5975216. doi:10.1155/2018/5975216.
- Li T, Fu J, Zeng Z, Cohen D, Li J, Chen Q, Li B, Liu XS. 2020. TIMER2.0 for analysis of tumor-infiltrating immune cells. Nucleic Acids Res. 48:W509–w514. doi:10.1093/nar/gkaa407.
- Li X, Zhang Q, Chen G, Luo D. 2021. Multi-Omics analysis showed the clinical value of gene signatures of C1QC(+) and SPP1(+) TAMs in cervical cancer. Front Immunol. 12:694801. doi:10.3389/fimmu.2021.694801.
- Ostrom QT, Gittleman H, Truitt G, Boscia A, Kruchko C, Barnholtz-Sloan JS. 2018. CBTRUS statistical report: primary brain and other central nervous system tumors diagnosed in the United States in 2011-2015. Neuro Oncol. 20:iv1–iv86. doi:10.1093/neuonc/noy131.
- Petitprez F, de Reynies A, Keung EZ, Chen TW, Sun CM, Calderaro J, Jeng YM, Hsiao LP, Lacroix L, Bougouin A, et al. 2020. B cells are associated with survival and immunotherapy response in sarcoma. Nature. 577:556–560. doi:10.1038/s41586-019-1906-8.
- Qiu H, Tian W, He Y, Li J, He C, Li Y, Liu N, Li J. 2021. Integrated analysis reveals prognostic value and immune correlates of CD86 expression in lower grade glioma. Front Oncol. 11:654350. doi:10.3389/fonc.2021.654350.
- Raden M, Mohamed MM, Ali SM, Backofen R. 2018. Interactive implementations of thermodynamics-based RNA structure and RNA-RNA interaction prediction approaches for example-driven teaching. PLoS Comput Biol. 14:e1006341. doi:10.1371/journal.pcbi.1006341.
- Sales TT, Resende FF, Chaves NL, Titze-De-Almeida SS, Bao SN, Brettas ML, Titze-De-Almeida R. 2016. Suppression of the Eag1 potassium channel sensitizes glioblastoma cells to injury caused by temozolomide. Oncol Lett. 12:2581–2589. doi:10.3892/ol.2016.4992.
- Sepulveda JL. 2020. Using R and bioconductor in clinical genomics and transcriptomics. J Mole Diag. 22:3–20. doi:10.1016/j.jmoldx.2019.08.006.
- Shi H, Song Y, Song Z, Huang C. 2021. CKMT1B is a potential prognostic biomarker and associated with immune infiltration in lower-grade glioma. PLoS One. 16:e0245524. doi:10.1371/journal.pone.0245524.
- Singh R, Bhardwaj V, Das P, Purohit R. 2020. Natural analogues inhibiting selective cyclin-dependent kinase protein isoforms: a computational perspective. J Biomol Struct Dyn. 38:5126–5135. doi:10.1080/07391102.2019.1696709.
- Singh R, Bhardwaj VK, Sharma J, Das P, Purohit R. 2021. Identification of selective cyclin-dependent kinase 2 inhibitor from the library of pyrrolone-fused benzosuberene compounds: an in silico exploration. J Biomol Struct Dyn. 1–9. doi:10.1080/07391102.2021.1900918.
- Stupp R, Hegi ME, Gilbert MR, Chakravarti A. 2007. Chemoradiotherapy in malignant glioma: standard of care and future directions. J Clin Oncol. 25:4127–4136. doi:10.1200/JCO.2007.11.8554.
- Subramanian A, Tamayo P, Mootha VK, Mukherjee S, Ebert BL, Gillette MA, Paulovich A, Pomeroy SL, Golub TR, Lander ES, et al. 2005. Gene set enrichment analysis: a knowledge-based approach for interpreting genome-wide expression profiles. Proc Natl Acad Sci U S A. 102:15545–15550. doi:10.1073/pnas.0506580102.
- Taher MM, Dairi G, Butt EM, Al-Quthami K, Al-Khalidi H, Jastania RA, Nageeti TH, Bogari NM, Athar M, Al-Allaf FA, et al. 2020. EGFRvIII expression and isocitrate dehydrogenase mutations in patients with glioma. Oncol Lett. 20:384. doi:10.3892/ol.2020.12247.
- Tang Z, Li C, Kang B, Gao G, Li C, Zhang Z. 2017. GEPIA: a web server for cancer and Normal gene expression profiling and interactive analyses. Nucleic Acids Res. 45:W98–w102. doi:10.1093/nar/gkx247.
- Thul PJ, Lindskog C. 2018. The human protein atlas: A spatial map of the human proteome. Protein Sci. 27:233–244. doi:10.1002/pro.3307.
- van den Bent MJ. 2010. Interobserver variation of the histopathological diagnosis in clinical trials on glioma: a clinician's perspective. Acta Neuropathol. 120:297–304. doi:10.1007/s00401-010-0725-7.
- Vigneswaran K, Neill S, Hadjipanayis CG. 2015. Beyond the world health organization grading of infiltrating gliomas: advances in the molecular genetics of glioma classification. Ann Transl Med. 3:95. doi:10.3978/j.issn.2305-5839.2015.03.57.
- Wang H, Li Y, Shi G, Wang Y, Lin Y, Wang Q, Zhang Y, Yang Q, Dai L, Cheng L, et al. 2020. A novel antitumor strategy: simultaneously inhibiting angiogenesis and complement by targeting VEGFA/PIGF and C3b/C4b. Mol Ther Oncolytics. 16:20–29. doi:10.1016/j.omto.2019.12.004.
- Wang Z, Jensen MA, Zenklusen JC. 2016. A practical guide to The cancer genome atlas (TCGA). Methods Mole Biol (Clifton, N.J.). 1418:111–141. doi:10.1007/978-1-4939-3578-9_6.
- Weller M, Wick W, Aldape K, Brada M, Berger M, Pfister SM, Nishikawa R, Rosenthal M, Wen PY, Stupp R, et al. 2015. Glioma. Nat Rev Dis Primers. 1:15017. doi:10.1038/nrdp.2015.17.
- Xi S, Zhang X, Chen H, Zhong Z, Lu J, Hu W, Wu Q, Zeng J. 2015. Downregulation of ring-finger protein 43 in glioma associates with poor prognosis. Int J Clin Exp Pathol. 8:490–496.
- Xiao K, Liu Q, Peng G, Su J, Qin CY, Wang XY. 2020. Identification and validation of a three-gene signature as a candidate prognostic biomarker for lower grade glioma. PeerJ. 8:e8312. doi:10.7717/peerj.8312.
- Xu J, Dai S, Yuan Y, Xiao Q, Ding K. 2020. A prognostic model for colon cancer patients based on eight signature autophagy genes. Front Cell Dev Biol. 8:602174. doi:10.3389/fcell.2020.602174.
- Xu S, Tang L, Liu Z, Luo C, Cheng Q. 2021. Hypoxia-Related lncRNA correlates With prognosis and immune microenvironment in lower-grade glioma. Front Immunol. 12:731048. doi:10.3389/fimmu.2021.731048.
- Xue L, Liu H, Chen Y, Wei L, Hong J. 2020. Computational analysis and verification of molecular genetic targets for glioblastoma. Biosci Rep. 40. doi:10.1042/BSR20201401.
- Yajima I, Kumasaka MY, Yamanoshita O, Zou C, Li X, Ohgami N, Kato M. 2014. GNG2 inhibits invasion of human malignant melanoma cells with decreased FAK activity. Am J Cancer Res. 4:182–188.
- Yang B, Han ZY, Wang WJ, Ma YB, Chu SH. 2020. GNG5 is an unfavourable independent prognostic indicator of gliomas. J Cell Mol Med. 24:12873–12878. doi:10.1111/jcmm.15923.
- Yuan K, Ye J, Liu Z, Ren Y, He W, Xu J, He Y, Yuan Y. 2020. Complement C3 overexpression activates JAK2/STAT3 pathway and correlates with gastric cancer progression. J Exp Clin Cancer Res. 39:9. doi:10.1186/s13046-019-1514-3.
- Zhang H, Chen Z, Wang Z, Dai Z, Hu Z, Zhang X, Hu M, Liu Z, Cheng Q. 2021. Correlation between APOBEC3B expression and clinical characterization in lower-grade gliomas. Front Oncol. 11:625838. doi:10.3389/fonc.2021.625838.
- Zhang J, Chen M, Zhao Y, Xiong H, Sneh T, Fan Y, Wang J, Zhou X, Gong C. 2020. Complement and coagulation cascades pathway correlates with chemosensitivity and overall survival in patients with soft tissue sarcoma. Eur J Pharmacol. 879:173121. doi:10.1016/j.ejphar.2020.173121.
- Zhang J, Liu M, Fang Y, Li J, Chen Y, Jiao S. 2022. TP53 r273c mutation Is associated With poor prognosis in LGG patients. Front Genet. 13:720651. doi:10.3389/fgene.2022.720651.
- Zhang QW, Liu L, Gong CY, Shi HS, Zeng YH, Wang XZ, Zhao YW, Wei YQ. 2012. Prognostic significance of tumor-associated macrophages in solid tumor: a meta-analysis of the literature. PLoS One. 7:e50946. doi:10.1371/journal.pone.0050946.
- Zhao X, Liu Z, Ren Z, Wang H, Wang Z, Zhai J, Cao D, Lyu S, Li L, Lang R, et al. 2020. Triptolide inhibits pancreatic cancer cell proliferation and migration via down-regulating PLAU based on network pharmacology of tripterygium wilfordii hook F. Eur J Pharmacol. 880:173225. doi:10.1016/j.ejphar.2020.173225.
- Zhao Z, Zhang KN, Wang Q, Li G, Zeng F, Zhang Y, Wu F, Chai R, Wang Z, Zhang C, et al. 2021. Chinese glioma genome atlas (CGGA): A comprehensive resource with functional genomic data from Chinese glioma patients. Genomics Proteomics Bioinformatics. 19:1–12. doi:10.1016/j.gpb.2020.10.005.
- Zhou Y, Yang L, Zhang X, Chen R, Chen X, Tang W, Zhang M. 2019. Identification of potential biomarkers in glioblastoma through bioinformatic analysis and evaluating their prognostic value. Biomed Res Int. 2019:6581576. doi:10.1155/2019/6581576.
- Zhou Y, Zhou B, Pache L, Chang M, Khodabakhshi AH, Tanaseichuk O, Benner C, Chanda SK. 2019. Metascape provides a biologist-oriented resource for the analysis of systems-level datasets. Nat Commun. 10:1523. doi:10.1038/s41467-019-09234-6.