
 ?Mathematical formulae have been encoded as MathML and are displayed in this HTML version using MathJax in order to improve their display. Uncheck the box to turn MathJax off. This feature requires Javascript. Click on a formula to zoom.
Abstract
This study aimed at assessing the characteristics of water hyacinth biomass in Lake Tana. Explanatory research design was used based on biomass samples and satellite images acquired along with field observation and literature reviews. The results showed that high amount of N and P nutrients, shallow nature of the Lake and suitable climatic conditions of the area are the causes for the weeds’ proliferation. The mean NDVI values were −0.542 to 0.828 and −0.628 to 0.877 in the dry and wet seasons, respectively. The spatial distribution of the weed was 2126.9 ha and 592.4 ha during the wet and dry seasons. The weed has recorded a mean leaf length of 9.3 cm, petiole length of 28.1 cm, root shoot ratio of 3.3, leaf blade area of 55.6 cm2 and leaf area index of 11343.9 cm2. In addition, a mean of 10.9 leaves per plant and 18.6 plants per 0.25m2 was found. Furthermore, the biomass analysis revealed 1,990,787.8 tons of wet and 554,523.8 tons of dry water hyacinth biomass can be harvested from the Lake per year. Stakeholders shall work on control of water hyacinth biomass as a short-term measure and reduction of nutrient inflow into the Lake as a long-term measure.
1. Introduction
A hazard is a potentially damaging physical event, phenomenon or human activity that may cause the loss of life or injury, property damage, social and economic disruption or environmental degradation (UNISDR Citation2004; FDRE Citation2010). Hazards may have the potential to pose damage to people and their activities, property and environment (ADPC Citation2008). Livelihoods and human beings in rural areas are also vulnerable to stresses and shocks of natural and human-made origin (Chambers and Conway Citation1992; UNISDR Citation2004; Lawrence et al. Citation2007; Holzmann Citation2008). Ethiopia is vulnerable to a variety of natural and man-made disastrous events due to the exposure of the country to such events related to geographic setting, climate, social and economic conditions (DRMFSS Citation2014; CDRC Citation2019). As a result, several hazards in the country impact communities and their livelihoods (DRMFSS Citation2014).
The recent surge in water hyacinth invasion across the country has raised an alarm by taking the water resources hostage and labeled as one of the most notorious weed the country has faced. Water hyacinth is one of the 35 invasive weed species identified in Ethiopia (Shiferaw et al. Citation2018). The local name of the weed in Ethiopia is ‘Enboch’. UNEP (Citation2013) and Coetzee et al. (Citation2017) believe that water hyacinth existence was first shown in Ethiopia at Aba-Samuel dam in 1956s as an ornamental plant. Water hyacinth has been reported to invade two major areas of Ethiopia: the Nile basin and the Awash basin extending down to the rift valley region (Habtamu, Citation2015 as cited in Mengistu et al., Citation2017). Additional occurrences of the weed are recorded in the Gambella regional state, the Blue Nile River from just below Lake Tana into Sudan, and Lake Ellen near Alem Tena areas of the country (Admas et al. Citation2017). Most rift valley lakes, canals, reservoirs and irrigation water supplies are invaded by the weed with varied levels of existence (Firehun et al. Citation2014). Currently, the weed has invaded the largest lake in the country, Lake Tana, where the largest weed invasion is observed.
New emerging hazards affecting the community should be identified and analyzed as it will deliver knowledge on the risks facing the community (ACF, Citation2010; Islam and Siwar Citation2012). Water hyacinth has its characteristics and analysis of the weed shall include characterization as an element. The existing characteristics of the water hyacinth weed built the vulnerability context of the lake ecosystem and the surrounding communities. Water hyacinth is attached with several negative impacts on the aquatic ecosystem and local livelihoods with different levels of manifestation (Timmer and Weldon Citation1967; Patel Citation2012; Rakotoarisoa et al. Citation2015; Saleh Citation2016). It threatens biodiversity, causes eutrophication, provides habitat for pests, clogs fresh streams, has an impact on agriculture and aquaculture, and impedes shipping and recreational activities (Patel Citation2012). The weed has also been linked to serious ecological and socioeconomic consequences (Tham Citation2012). To achieve successful control, it is vital to understand the characteristics of this invasive alien weed (ACF Citation2010; Hill and Coetzee Citation2017). Therefore, the management of the weed in Lake Tana should be leveraged by critical analysis of the water hyacinth biomass characteristics.
As a source of insecurity and a recent occurrence in the Lake Tana environment, the characteristics of water hyacinth shall be studied. Failure in the management of water hyacinth to avoid or reduce the weed on Lake Tana is supported by a lack of knowledge about the characteristics of the weed (Tewabe et al. Citation2017; Kibret and Worqlul Citation2018). However, researchers overlook the characterization of water hyacinth biomass. No study is conducted on various characteristics of the weed biomass in Lake Tana. Hence, the general objective of this study is designed to analyze the morphometric and biomass characteristics of water hyacinth on Lake Tana, Ethiopia.
2. Study area description
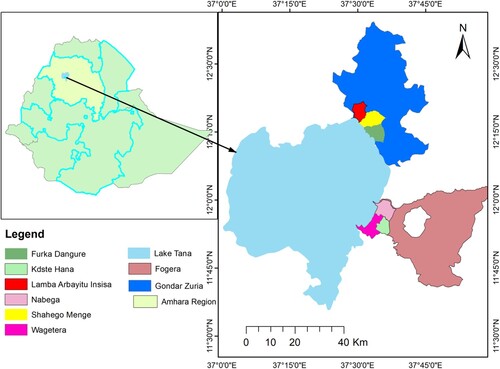
The study area, Lake Tana, is a tropical lake situated in the north-western part of Ethiopian highlands (Vijverberg et al. Citation2009). Lake Tana is around 563 km far from Addis Ababa which is the capital city of Ethiopia (UNESCO Citation2015). Administratively, the lake is found in the Amhara National Regional State (ANRS) of Ethiopia. The absolute location of the lake extends from 11°25′07″-12°29′18″' North and 36°54′01″'-37°47'20″ East (UNESCO Citation2015). Lake Tana is the largest lake in the country and it is found at an altitude of 1830 m above sea level (Vijverberg et al. Citation2009; Mundt Citation2011). The average temperature of the Lake Tana basin is 20°C (Abebe et al. Citation2017) while the rainfall of the basin extends from 816 up to 2344 mm (ADSWE Citation2015). Lake Tana basin is a home for numerous biodiversity resources. The basin delivers a comfortable place for various flora and fauna. Cultural heritages and waterfalls in the basin are well acknowledged and are good sources of the region’s economy (Mundt Citation2011). Lake Tana basin is home to numerous biodiversity resources. Among 27 fish species in the Lake Basin, 20 of them are endemic to the area (Tewabe Citation2015).
Like the rest of the country, 88.6% of the population in Amhara National Regional State reside in rural areas and their economy is dependent on subsistence agriculture (ANRS Citation2011). As a natural resource, Lake Tana supports the settlement and livelihoods of many people. About 2 million people live near Lake Tana and its catchment including the town of Bahir Dar (Vijverberg et al. Citation2009). Ejigu and Ayele (Citation2018) indicated that Lake Tana and its watershed provide a livelihood security for 5 million people. More specifically, Lake Tana and the neighboring wetlands deliver a livelihood for more than 500,000 people both directly and indirectly (Vijverberg et al. Citation2009). The Lake supports various livelihoods through agriculture and fishing are dominant (Goshu and Aynalem Citation2017). However, because of different natural and human-made calamities these resources are in danger (Figure ).
Figure 1. Location map of Amhara Regional State in Ethiopia (left) and Lake Tana (right).
Source: Authors' production using Ethio-Gis spatial data, 2021.
3. Materials and methods
3.1. Research design
Characteristics of water hyacinth studies can be conceptualized from various perspectives. Due to the nature of the weed, this study emphasized on the major characteristics of the weed: causes of the weed, extent/spatial coverage of the weed, morphometric and biomass characteristics. These characteristics should be considered in the light of ‘all being equal’, in other words without taking into consideration of the possible presence of coping mechanisms (Van Niekerk Citation2011). Explanatory research design was employed to achieve the objective of the study.
3.2. Data sources and data collection
The characterization of water hyacinth biomass needs data input from various sources. For the sake of this study, both primary and secondary data were considered as data sources. Primary data were captured from water hyacinth biomass survey, field observation and satellite images. In addition, published and unpublished literature written on the issue of water hyacinth characteristics were reviewed.
Water Hyacinth Biomass Survey: Biomass survey of water hyacinth helps to show major morphometric characters and biomass of the weed. Typically, the biomass of water hyacinth can be collected using quadrats with a specific unit area placed over the plant mat (Robles et al. Citation2015). Water hyacinth samples were collected once using quadrant of 0.25 m2. For this study, a destructive biomass estimation method was used to collect the samples. The weed samples were measured to estimate the morphometric and biomass characteristics of water hyacinth in the study area. Morphometric characteristics of a randomly selected single water hyacinth plant were measured from each quadrant (Robles et al. Citation2015). Tape meter was used to measure leaf length, root and shoot length of water hyacinth samples while leaf blade area of the weed was estimated via ImageJ 5.3 software. In addition, the weight of each quadrant water hyacinth biomass was measured using a weight scale. The measurement of wet water hyacinth biomass was consistent enough and the wet weed was measured after rinsing for 1 minute. According to Madsen (Citation1993) and Center and Spencer (Citation1981), water content of water hyacinth biomass can be dried with a minimum of 50°C for considerable enough time. Hence, the weed samples were dried in an oven at 65°C for 48 h to remove all the water from the water hyacinth.
Field Observation: Visual observation helps to cross-check the data obtained from other sources about characteristics of the weed. The observation was focused on water hyacinth-infested areas, morphometric characteristics of the weed, farming and land cover around the lake. Photographs and GPS locations of water hyacinth and other land covers were taken during the field observation.
Document Review: Secondary data was collected from published and unpublished materials that are available in the form of government policy briefs, plans, reports and other relevant documents from the concerned administrative offices. The reviewed secondary data was used to complement the data requirements whenever required.
Satellite Images: Effective and low-cost water hyacinth water hyacinth monitoring can be managed by satellite remote sensing data (Datta et al. Citation2021). Sentinel 2 MSI satellite images of the study area, Lake Tana, were acquired for the peak and low infestation periods in 2021. According to previous studies, the peak water hyacinth infestation is recorded immediately after the rainy season (June–August) and the low infestation period is after the dry season (February–April) (Kibret and Worqlul Citation2018; Dersseh et al. Citation2020). Therefore, the satellite images with less than 10% of cloud cover in October and May 2021 were downloaded from the United States Geological Survey (USGS) close to the water hyacinth sampling period in the field. The images were extracted to Tiff format. Descriptions of image properties are given in Table .
Table 1. Description of the Sentinel 2 MSI satellite images.
3.3. Water hyacinth biomass sampling and sample size determination
Evenly spaced line transect sampling design was used to capture the density difference across Lake Tana. To collect water hyacinth samples distance from the edge of the Lake to the end of the water hyacinth coverage was estimated then the sample points were determined proportionally to the length. The samples of the weed were taken at regular intervals and the beginning sample sites were selected randomly. The determined water hyacinth samples were taken from different corners of the Lake with varied densities (dense, medium and sparse).
The formula suggested by Madsen (Citation1993) was used to determine the minimum sample size of water hyacinth samples to be taken from Lake Tana.
where n is the minimum sample size, S is the standard deviation and X is the mean biomass from the previous survey.
The study output of Firehun et al. (Citation2014) in the rift valley water bodies of Ethiopia has been used to determine the number of water hyacinth biomass samples. The mean wet/fresh biomass of the seven significantly infested water bodies was 24 kg/m2 while the mean standard deviation was 13.74 kg/m2. Then the number of water hyacinth biomass samples was determined to be 33 based on the equation. However, 36 water hyacinth samples were collected for the study.
3.4. Data analysis
Descriptive statistics were applied to analyze the quantitative characteristics of water hyacinth biomass. The researchers narrated the qualitative characteristics data. ArcGIS 10.4, Envi 5.3 and Qgis 3.12.1 plug in SCP used to compute the spatial analysis of water hyacinth. ImageJ 5.3 was applied to estimate the Leaf blade area (LBA). Furthermore, STATA 15.0 was applied to compute the statistical analysis of the data.
3.4.1. Morphometric characterization and biomass estimation
The morphometric characteristics and the biomass of water hyacinth were analyzed based on the data from water hyacinth biomass survey. The morphometric characteristics of water hyacinth leaf blade area, leaf length, plant density and leaves per plant measured manually using tape meter and used to compute the leaf area index (LAI) (Center and Spencer Citation1981). The LAI was calculated using the following equation:
where LBA = leaf blade area (m2), LPP = leaves per plant, and PD = plant density or number of plants per 0.25 m2.
Furthermore, the total plant dry biomass was calculated as a product of the area of water hyacinth coverage and the average dry biomass of water hyacinth per 0.25 m2.
Finally, water content of water hyacinth in each quadrant was estimated as follows:
The maximum, minimum, mean and standard deviations of the sample’s characteristics were calculated. The biomass differences in wet and dry seasons were also tested using an independent sample t-test.
3.4.2. Spatial analysis of water hyacinth
A combination of unsupervised and supervised classification methods was used to assess the spatial coverage of water hyacinth biomass in Lake Tana. Generally, a five-stage workflow was employed to analyze and map the spatial extent of water hyacinth: preprocessing of the Sentinel-2 satellite images, computation of unsupervised vegetation classification (NDVI), extraction of spectral signature files, supervised classification (maximum likelihood classification) and accuracy assessment.
Preprocessing: Radiometric and atmospheric corrections were made on the Sentinel 2 MSI images before the main analysis. Preprocessing of satellite images, atmospheric correction and conversion of radiance to reflectance were conducted by employing Qgis 3.12.1 plug in SCP. To capture the extent of the weed proliferated from the Lake boundary one kilometer buffering was made. Since the weed is available on the northeastern part of Lake Tana, the area of the Lake was clipped for better visualization.
Normalized Vegetation Index (NDVI): Vegetation indices are classification techniques that are often used to differentiate between plant communities (Young and Schrader Citation2014). According to Mund et al. (Citation2014), multiple vegetation indices were constructed based on the reflectance pattern of vegetation to explain the healthiness, vegetation cover and biomass status of vegetation. Various mathematical combinations of satellite images were employed for various studies, depending on the goal of the discovery and the type of image provided. Cho et al. (Citation2008) have confirmed the potential of Normalized Vegetation Index (NDVI) to detect the vegetation coverage of water bodies until a depth of 0.3 m as of the land surface. Thamaga and Dube (Citation2018) and Venugopal (Citation1998) also indicated that vegetation indices like NDVI can discriminate water hyacinth from other types of land covers. In addition, the NDVI can work well without saturation problems since diverse vegetation types are not found in the Lake. Hence, NDVI was used to estimate the spatial extent of water hyacinth biomass in the study area. Due to its ease of calculation and standardization, NDVI is commonly applied by scholars (Venugopal Citation1998). The NDVI value of the study was estimated using the following equation, employing the reflectance values combination of the two bands (Govaerts and Verhulst Citation2010; Kuc and Chormański Citation2019):
Since Sentinel 2 satellite images were used for the analysis, the NDVI values were calculated using Band 8 and Band 4 as NDVI = (Band 8 – Band 4)/(Band 8 + Band 4).
As to vegetation conditions, NDVI values vary from −1 to +1. Healthy vegetation yields high positive NDVI values because they have relatively high reflectance in NIR and low in visible wavelength (Ceamanos and Valero Citation2016; Drisya and Roshni Citation2018).
Maximum Likelihood Classifier (MLC): The computed NDVI outputs were further analyzed to capture the type of land use land cover (LULC) in the area. The LULC classes are categorized based on the maximum likelihood supervised classification method. Maximum likelihood classifier (MLC) is the most common and widely applied method of supervised classification (Richards Citation1995). The classification was based on the five major LULC classes of the study area which are water hyacinth, water, forest, agricultural land and other vegetation. The classification of water hyacinth and other land use land cover (LULC) classes was determined based on the benchmarks generated from spectral libraries. Spectral library was developed for the major LULC classes using sample ground points from pure sample LULC classes.
Accuracy Assessment: In image classification analysis, the measurement of accuracy is a critical phase. LULC classifications are not free from flaws since errors may occur because of the image acquisition method used or the categorization methodology applied. Therefore, the level of classification should be checked and the information from the reference data was compared to the classified image to ensure accuracy. The accuracy was assessed using first-hand data acquired using the Global Positioning System (GPS) and the Google earth engine.
The classification error matrix, also known as a confusion matrix, was created by combining various ways of assessing classification accuracy: overall accuracy, kappa value, user accuracy and producer accuracy. The Kappa coefficient denotes the errors that could occur with simple random classification, while the overall classification accuracy displays the level of classification accuracy. A minimum level of overall accuracy in classification is 85 (Anderson Citation1971; Foody Citation2008) whereas 0.81 and above denotes almost perfect kappa value (Landis and Koch Citation1977).
4. Results and discussion
4.1. Causes of water hyacinth proliferation
The presence of water hyacinth can be real when the root and immediate causes of the weed meet together. In Lake Tana, water hyacinth was observed for the first time in 2011 (Ejigu and Ayele Citation2018; Kibret and Worqlul Citation2018). The weed’s entrance into the Lake was first noted at the edge of Megech River (Tewabe Citation2015). Through time, the northeastern part of the Lake was invaded by the weed (Kibret and Worqlul Citation2018). However, the immediate cause of the water hyacinth weed’s existence and the agent responsible for its introduction into Lake Tana are still unknown (Tewabe Citation2015; Ayalew et al. Citation2020). Nevertheless, there are visible factors that create favorable conditions for the weed’s expansion. Since water hyacinth is the symptom of an unhealthy water ecosystem, its existence will not be real without the enabling factors in and around the water bodies (Gichuki et al. Citation2012). The proliferation of water hyacinth differs over water bodies of the world because of changes in the climate and season, water level, disposal of sewage and nutrient runoff in the water system (Thamaga and Dube Citation2018). Similar causal factors are observed in Lake Tana.
Nutrients from agricultural areas, industrial regions and residential buildings play their role in creating a favorable room for water hyacinth proliferation (Practical Action Citation2006; Ayalew et al. Citation2020; EPA Citation2020). Water bodies transform into a weed as a result of high nutrient levels in urban, industrial, and municipal effluent (Jiménez Citation2003). The potential of water hyacinth is strongly determined by plant nutrition (Madsen Citation1993; Makhanu Citation1997; Yu et al. Citation2019). Increased nutrient concentration in water bodies is regarded as one of the most major external causes responsible for water hyacinth invasion (Gao et al. Citation2016). Specifically, water hyacinth coverage is determined by phosphorus (P) and nitrogen (N) content of water bodies (Firehun et al. Citation2014; Dersseh et al. Citation2019). The optimum requirements for the growth of water hyacinth are 5.5–20 mg/L of N and 1.66–3 mg/L of P (Dersseh et al. Citation2019). Reports delivered by scholars showed the presence of nutrients that support the growth of the weed in the lake. Kebedew et al. (Citation2020) found 0.21 mg P/L in the Lake Tana water. In addition, Goshu et al. (Citation2017) reported 0.1–9.1 mg/L of P and 3.66 mg/L of N in the Lake. Furthermore, 0.001–0.76 mg/L of P and 0.1–9 mg/L of N were testified by Aron (Citation2017).
The field observation showed that water hyacinth concentration/density is higher at the edge of the Lakes and declines as we go to the inner part of Lake Tana. This is because the depth of water is small and the nutrient abundance that comes from the washed soil and exposed wastes is high at the lake shore which favors the growth of the weed. Figure shows the nutrient load beneath water hyacinth mat. According to Dersseh et al. (Citation2019), Lake Tana is nutrient-rich water body and nutrients of phosphorus and nitrogen from point and nonpoint sources join the Lake Tana. In recent years, a huge amount of nutrients has joined Lake Tana from hotels, industries and residential sources. In addition, nutrients washed from the surrounding areas into the Lake. Agricultural lands with fertilizers application and deforested land resulted in increased nutrient run-off. Similarly, EPA (Citation2020) has reported that farming practices on muddy soils near to Lake Tana's edge have led to the weed's aggressive spread. As depicted in Table , a huge amount of agricultural land, 4.8% of the northwestern Lake Tana with 1 km buffering, was covered by agricultural land.
Figure 2. Agricultural land adjacent to Lake Tana (left) and nutrient load under the weed (right).
Source: Images taken during the field survey, 2021.
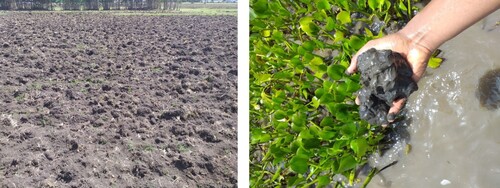
Table 2. Spatial coverage of water hyacinth in Lake Tana.
Sediments are a source of plant nutrients for the Lake communities. According to Tewabe et al. (Citation2017), fertilizers and other agricultural inputs washed from the surrounding catchment areas worsen the water hyacinth’s ability to outcompete other plant species on the Lake. Shore area floras, which would be significant fish breeding grounds and cattle feed sources in the area, are harmed. Setegn et al. (Citation2009) indicated that 12–30.5% of the Lake Tana basin has been found with a significant potential for erosion and the sediment production was greater than 30 tons/ha in each sub-basin area. In addition, Lemma et al. (Citation2020) disclosed that Lake Tana received an average sediment load of 31.02 Mt per year which is made up of 96.6% suspended load and 3.4% bedload.
Environmental conditions of the water bodies are additional factors for the growth of water hyacinth (Dersseh et al. Citation2019). The best environmental circumstances for water hyacinth growth include temperatures ranging from 28°C to 30°C, pH values ranging from 6.5 to 8.5 and salinity of less than 2% (Gaikwad and Gavande Citation2017). The climatic condition of Lake Tana meets the optimal growth conditions of water hyacinth. Goshu et al. (Citation2017) indicated that the temperature of the Lake ranges from 20.8°C to 28.6°C while the pH is 6.8–8.3. In addition, the salinity of the three major tributaries of Lake (Gilgel Abay, Gumara, Rib and Megech) was below 0.14 ppm.
On the other hand, Yu et al. (Citation2019) confirmed the significant effect of water level for the survival of water hyacinth. Water hyacinth grows well in shallow water bodies with a depth of less than 6 m (Makhanu Citation1997). The depth of Lake Tana makes it suitable for the growth of water hyacinth. The Lake has an average depth of 9 m despite the Lake shore being very shallow with few meters depth (Mundt Citation2011; Ejigu and Ayele Citation2018). The field observation result disclosed that the water hyacinth was accumulated on the shallow parts of the Lake while the weed’s presence to the inner depth parts of the Lake is limited. Inverse relationship was noted on water hyacinth density and Lake Tana depth. Dersseh et al. (Citation2020) have also confirmed similar correlation between depth and water hyacinth expansion on Lake Tana.
4.2. Spatial coverage of water hyacinth
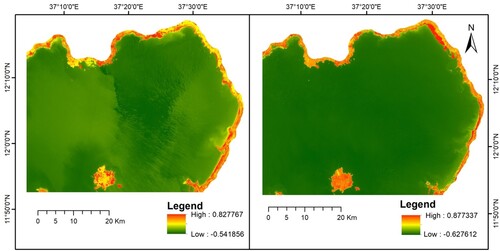
The study employed NDVI analysis using October and May Sentinel 2 MSI images representing the wet and dry seasons of 2021. The vegetation index, NDVI, extracted the water hyacinth region from other earth features of the study area. The NDVI score of the dry season satellite images of the year, 2021, was from −0.542–0.828 and the wet season was from −0.628 to 0.877. The NDVI analysis images of the study area in the two periods are presented in Figure .
Figure 3. NDVI analysis of Lake Tana in dry (left) and wet (right) seasons.
Source: NDVI output, 2021.
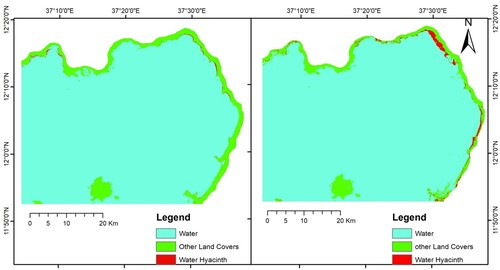
The MLC-supervised classification showed that the highest quantity of water hyacinth in Lake Tana was found in the wet season (2126.9 ha) while the dry season water hyacinth coverage was 592.4 ha. Approximately 0.9 and 0.2% of the study area were covered by the proliferated invasive weed water hyacinth in the wet and dry seasons, respectively. Without consideration of external factors, the extent of water hyacinth in wet seasons increased by 3.59 times as compared to the dry season. The weed occupied a significant portion of northeastern Lake Tana area. In addition, the agricultural areas, grazing lands, indigenous marsh and grasslands adjacent to the Lake are also covered by the weed. The weed expands to the flood plain rice production areas around Lake Tana whereas due to the topography and the hill edge of the Lake limited amount of the weed goes out of the Lake Tana Zuria Livelihood Zone.
Previous studies conducted using NDVI and MLC have shown spatial extents of water hyacinth coverage result that are similar to this study. Dersseh et al. (Citation2020) found 436.7–2504.5 ha of water hyacinth in 2019 using the NDVI method. In addition, Asmare et al. (Citation2020) estimated 112.1, 168.7 and 1512 ha of water hyacinth in December 2013, 2015 and 2017 respectively using MLC. Likewise, Kibret and Worqlul (Citation2018) noted that 300 up to 1900 ha of the weed was estimated from August 2017 to Oct 2018. In contrast, the spatial coverage result was much lower than what was reported by GPS trucking and digitizing studies. Wassie et al. (Citation2014) estimated 20,000 ha in 2012 and 40,000 ha in 2014. Furthermore, 5396 ha of water hyacinth weed was reported by Ayalew (Citation2014) and 5358.7 ha of weed was reported by Ayalew et al. (Citation2020) in November 2019. The possible reason for different spatial coverage of water hyacinth in Lake Tana could be the method of estimation employed. The GPS tracking and digitizing methods delineate areas with sparse weed and water coverage as a weed while the NDVI and MLC image analysis techniques consider pixels with major existence of the weed as a water hyacinth area. In addition, the water hyacinth management initiatives employed by the government campaigns could be one reason for the variation as water hyacinth management initiatives are usually employed during the dry period (Figure ).
Figure 4. Spatial coverage of water hyacinth in dry (left) and wet (right) seasons of 2021.
Source: MLC output, 2021.
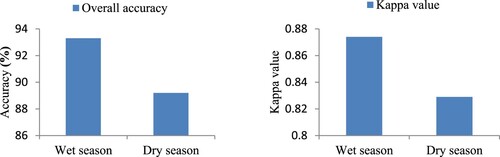
A classification accuracy assessment was carried out using a confusion matrix. Results of the producer accuracy, user accuracy, overall accuracy and kappa value confirmed the accuracy of the classifications conducted. Producer accuracy was 66.7–100% during the wet season and 50–100% during the dry season. The user accuracy was found within the ranges of 60–100% for both the wet and dry seasons. In addition, the overall classification accuracy was 93.3% and 89.2% during the wet and dry seasons. The overall classification accuracy assessment was above the minimum of 85% recommended by Anderson (Citation1971). On the other hand, the kappa values were 0.874 and 0.829 that are on the perfect classification limit (0.81–1.00) according to Landis and Koch (Citation1977) (see Figure ). The confusion matrix results revealed that the accuracy of the classified images is within the acceptable range and the classifications can be applied for further analysis. The accuracy assessment results are presented in Annexes I and II.
Figure 5. Overall accuracy and Kappa value for the wet and dry seasons of 2021.
Source: Authors’ compilation, 2021.
4.3. Morphometric characteristics of water hyacinth
The literature frequently refers to the different growth forms of water hyacinth, which emphasizes the varied characters of the plant's morphology (Center and Spencer Citation1981). Morphometric characteristics of water hyacinth vary according to the environmental situation and the nutrients available in the local area that determine the growth of the weed. This study tried to identify the major morphometric characteristics of water hyacinth in Lake Tana. To inculcate the characteristics difference of the weed across the study area, evenly spaced line transect sampling was used.
A measurement of a randomly selected single water hyacinth plant from each quadrant showed a mean leaf length of 9.2 cm while the mean petiole length of the water hyacinth was found 28.1 cm. This result is in the top range of the water hyacinth weeds 20–30 cm height indicated by Makhanu (Citation1997). In addition, the root and shoot lengths were found as 120 and 37.5 cm, respectively, whereas the root-to-shoot ratio was found 3.3. The outputs of this study are higher than 67 cm of root mean length, 9.1 cm of leaf mean length and 18.4 cm of mean petiole length reported in Lake Tana by Tewabe et al. (Citation2017).
The mean density of the water hyacinth plants was 18.6 with a range of 12–27 plants within 0.25 m2 quadrant. This result is smaller than 104 water hyacinth plants in 1 m2 quadrants found in Lake Tana by Tewabe et al. (Citation2017). However, 7 up to 14 leaves per plant or a mean of 10.9 leaves were found in a single water hyacinth plant. The leaf blade area that was estimated using ImageJ 5.3 was 55.6 cm2. Finally, the mean leaf area index of each quadrant was 11343.9 cm2. The size of the leaves is a reliable predictor of the nutrition level of the water body (Makhanu Citation1997). The high leaf size in Lake Tana shows the existence of enormous amounts of nutrients that support the growth of the weed in the Lake. A summary of the morphometric measurements of the weed is given in Table .
Table 3. Morphometric measurements of water hyacinth in Lake Tana (n = 36).
Water hyacinth has the highest growth rate among any plant on the earth (Jana Citation2015). The weed is a fast grower that doubles its population within two weeks (Jana Citation2015). The high plant density and leaf area are the reason for the domination of the weed on other flora and fauna available on Lake Tana. In addition, it is responsible for the high photosynthesis that will result in enormous water loss in the Lake. This could be the key to eradicate the weed completely. The rate of evapotranspiration is around 1.02–13.4 (mean 2.5) times that of open water mass (Makhanu Citation1997).
4.4. Water hyacinth biomass in Lake Tana
Biomass is defined as the total mass of living plant organic matter expressed as oven-dry tons or oven dry tons per unit area (FAO Citation2015). This study also conducted biomass quantification of water hyacinth with the perspective of impacts to be exerted and management efforts needed. The biomass of the weed was measured two times: the fresh wet biomass and the biomass that is dried in an oven for 48 h at 65°C. The mean wet/fresh biomass of the 36 water hyacinth samples was 93.6 ± 18.4 kg per m2. On the other side, the dry biomass of the weed was recorded as 6 ± 2.72 kg per m2. The t-test result showed that the weight of wet and dry biomass of water hyacinth has statistically significant difference at less than 1% significant level both at the wet and dry seasons. This result implies the high proportion of water in water hyacinth weed. The result revealed that a mean of 87.6 ± 8.0 kg per m2 covering 93.7% of the weed is water. The high content of water in the weed and the evapotranspiration process are the reason for the reduction of water volume in the weed-infested water bodies. The result of this study is much higher than 8.216 ± 0.45 kg/m2 of freshwater hyacinth biomass found in Lake Tana during the dry season reported by Tewabe et al. (Citation2017). The biomass output of this study is also higher than 25 kg/m2 in the Kenyan side of Lake Victoria (Makhanu Citation1997) (Figure ).
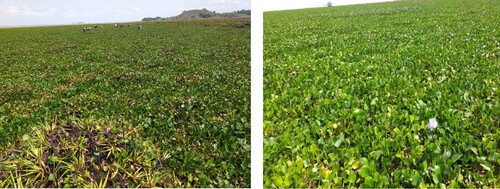
Figure 6. Water hyacinth invasion around Lake Tana.
Source: Images taken during the field survey, 2021.
The estimation of water hyacinth biomass considered the inputs of ground survey and satellite images spatial analysis. In the wet season of 2021, the estimated total wet biomass of water hyacinth in Lake Tana was 1,990,787.8 tons in the wet season and 554,523.8 tons in the dry season. On the other side, 127,614.6 tons and 35,546.4 tons of dry water hyacinth biomass were found during the wet and dry seasons of the year, respectively. The result of biomass analysis in Table implies that the management of the weed in Lake Tana shall remove biomass of 1,990,787.8 tons during the wet and 554,523.8 tons in the dry season of the year.
Table 4. Lake Tana water hyacinth biomass in tons (n = 36).
On the other hand, the mentioned amount of the weed biomass can be employed as an input for various productive works: animal feed, biogas, handcraft works, compost and others. It is also being speculated that the huge water hyacinth biomass can be used in wastewater treatment, heavy metal and dye remediation, bioethanol and biogas production, electricity generation, industrial uses, human food and antioxidants and medicines (Patel Citation2012; Kumar et al. Citation2019; Kumar et al. Citation2020; Li et al. Citation2021; Prasad et al. Citation2021). Water hyacinth is used as a raw material for the production of pulp, paper, rope, baskets, fiberboards, chairs and mats (Anuja et al. Citation2016; Sierra-Carmona et al. Citation2022). As a readily available resource endowed with a variety of properties, water hyacinth can be used in different industries such as textile, energy, water purification, agriculture and handcraft (ARCOS Citation2018). Nevertheless, the economic feasibility is uncertain due to underdeveloped extraction and processing technology (Güereña et al. Citation2015). In addition, the utilization of the weed shall be in consideration of the local settings especially the rural context (Pin et al. Citation2021).
5. Conclusion and recommendations
The study was conducted with an interest of characterizing water hyacinth in Lake Tana. Monitoring of the water hyacinth biomass was successfully achieved by sentinel 2 MSI images and field biomass survey. The study concludes that the high amount of P and N inflows to the Lake, the shallowness of the Lake and the suitable environmental conditions are the underlying causes of water hyacinth proliferation at Lake Tana. A combination of NDVI and MLC is found reliable water hyacinth spatial distribution analysis methods using Sentinel-2 MSI satellite images. The NDVI value of the study area during the wet season was −0.542 to 0.828 and in the dry season was −0.628 to 0.877. Spatial coverage of water hyacinth during the dry and wet seasons was 2126.9 ha and 592.4 ha, respectively. Moreover, biomass of water hyacinth in the wet season was 1,990,787.8 tons and 554,523.8 tons in the dry season of 2021. The study also concludes that the high biomass and morphometric characteristics of water hyacinth are consequences of enormous nutrient content in the Lake. Statistically significant difference was found in the samples of wet and dry water hyacinth biomass. The concerned governmental and non-governmental bodies shall control the water hyacinth biomass to an unproblematic level to protect the Lake ecosystem and the community settled in and around the Lake. The management of the weed shall focus on the reduction of nutrients inflow into the Lake that favors the growth of the weed as a long-term measure that alleviates the root causes including reduction of nutrients inflow.
Acknowledgements
The authors acknowledge Bahir Dar University and the University of Gondar for facilitating the study. The authors also acknowldge International Foundation for Science (IFS) for funding this study.
Disclosure statement
No potential conflict of interest was reported by the author(s).
Authors contributions
Yilebes A. Damtie has contributed to the conception, analysis, drafting and interpretation of this study. Tewabe K. Ayelew worked on supervising the water hyacinth biomass analysis. Arega B. Berlie and Gashaw M. Gessese engaged in supervising and editing the overall research process.
Ethical approval
The Postgraduate Council of the Department of Development and Environmental Management Studies at the University of Gondar assesses and approves the ethical issues of this study. In addition, the ethical approval on the use of water hyacinth was received from Lake Tana and Other Water Bodies Protection and Development Agency (LTOWBPDA).
Availability of data and materials
The data supporting the findings of this research is accessible on the Figshare, The name of the data set is ‘Water Hyacinth Samples in Lake Tana’ and it can be accessed at https://doi.org/10.6084/m9.figshare.21252420.v2.
Additional information
Funding
References
- Abebe WB, Leggesse ES, Beyene BS, Nigate F. 2017. Climate of Lake Tana Basin. In: Social and ecological system dynamics. Cham: Springer, Switzerland; p. 51–58.
- ACF. 2010. Food security and livelihood assessments: A practical guide for field workers.
- Admas A, Sahle S, Belete E, Agidie A, Alebachew M. 2017. Controlling water hyacinth in Lake Tana using biological method at green house and pond level. Eur Exp Biol. 7(5):30.
- ADPC. 2008. Vulnerability and risk: module 2, capacity building in Asia using information technology applications (CASITA) project. ADPC, SM Tower, 24th Floor. 979.
- ADSWE. 2015. Tana sub basin land use planning and environmental study project. Technical Report Volume V: Agro-Climatic Assessment for BoEPLAU (ADSWE, LUPESP/TaSB: 09/2015). Bahir Dar, Ethiopia.
- Anderson JR. 1971. Land-use classification schemes. Photogram Eng. 379–387.
- ANRS. 2011. The development study on the improvement of livelihood through integrated watershed management in Amhara region: final report.
- Anuja S, Aggarwal NK, Anita S, Anita Y. 2016. Beyond biocontrol: water hyacinth-opportunities and challenges. J. J. o. E. S., & Technol. 9(1):26–48.
- ARCOS. 2018. Using water hyacinth to improve livelihoods and restore freshwater ecosystems.
- Aron A. 2017. Mapping the Spatial and Temporal Eutrophication Status of Lake Tana Using GIS. MSc Thesis, Bahir Dar University, Bahir Dar.
- Asmare T, Demissie B, Nigusse AG, GebreKidan A. 2020. Detecting spatiotemporal expansion of water hyacinth (Eichhornia crassipes) in Lake Tana, northern Ethiopia. J Indian Soc Remote Sensing. 48(5):751–764.
- Ayalew D, Alemayehu Y, Genet A, Asfaw D, Asfaw H, Abeje A. 2020. Water hyacinth: a threat to Lake Tana. 1–14.
- Ayalew MG. 2014. Spatial coverage of water hyacinth infestation around Lake Tana, Ethiopia. Earth Sci Int J (ESIJ). 1(1):1–4.
- CDRC. 2019. Poverty and hunger strategic review, Ethiopia's roadmap to achieve zero poverty and hunger, main report.
- Ceamanos X, Valero S. 2016. Processing hyperspectral images. In: Optical remote sensing of land surface. London: Elsevier; p. 163–200.
- Center TD, Spencer NR. 1981. The phenology and growth of water hyacinth (Eichhornia crassipes (Mart.) Solms) in a eutrophic north-central Florida lake. Aquat Bot. 10:1–32.
- Chambers R, Conway G. 1992. Sustainable rural livelihoods: practical concepts for the 21st century: Institute of Development Studies (UK).
- Cho HJ, Kirui P, Natarajan H. 2008. Test of multi-spectral vegetation index for floating and canopy-forming submerged vegetation. Int J Environ Res Public Health. 5(5):477–483.
- Coetzee JA, Hill MP, Ruiz-Téllez T, Starfinger U, Brunel S. 2017. Monographs on invasive plants in Europe N° 2: Eichhornia crassipes (Mart.) Solms. Botany Letters. 164(4):303–326.
- Datta A, Maharaj S, Prabhu GN, Bhowmik D, Marino A, Akbari V, Rupavatharam S, Sujeetha JARP, Anantrao GG, Kumar S, et al. 2021. Monitoring the spread of water hyacinth (Pontederia crassipes): challenges and future developments. Front Ecol Evol. 9:631338.
- Dersseh MG, Melesse AM, Tilahun SA, Abate M, Dagnew DC. 2019. Water hyacinth: review of its impacts on hydrology and ecosystem services—lessons for management of Lake Tana. Extreme Hydrol Climate Var. 1(1):237–251.
- Dersseh MG, Tilahun SA, Worqlul AW, Moges MA, Abebe WB, Mhiret DA, Melesse AM. 2020. Spatial and temporal dynamics of water hyacinth and its linkage with lake-level fluctuation: Lake Tana, a sub-humid region of the Ethiopian highlands. Water (Basel). 12(5):1435.
- Drisya J, Roshni T. 2018. Spatiotemporal variability of soil moisture and drought estimation using a distributed hydrological model. In: Integrating disaster science and management. Amsterdam: Elsevier; p. 451–460.
- DRMFSS. 2014. Disaster risk management strategic programme and investment framework.
- Ejigu M, Ayele B. 2018. Conserving the Lake Tana ecosystem and biodiversity for sustainable livelihoods and enduring peace, 2018 world water week, pp.
- EPA. 2020. Tana: A lake at stake. Ethiopian Herald. 1–2.
- FAO. 2015. Knowledge reference for national forest assessments - modeling for estimation and monitoring; Biomass estimation.
- FDRE. 2010. National policy and strategy on disaster risk management.
- Firehun Y, Struik P, Lantinga E, Taye T. 2014. Water hyacinth in the Rift Valley water bodies of Ethiopia: Its distribution, socio-economic importance and management. Management of Water Hyacinth (Eichhornia crassipes [Mart.] Solms) using bioagents in the Rift Valley of Ethiopia. 17.
- Foody GM. 2008. Harshness in image classification accuracy assessment. Int J Remote Sens. 29(11):3137–3158.
- Gaikwad RP, Gavande S. 2017. Major factors contributing growth of water hyacinth in natural water bodies. Int J Eng Res. 6(6):304–306.
- Gao L, Li B, Jin L. 2016. Can water hyacinth (Eichhornia crassipes) be controlled by reducing nitrogen and phosphorus pollution of water bodies? Appl Ecol Environ Res. 14(3):77–91.
- Gichuki J, Omondi R, Boera P, Okorut T, Matano AS, Jembe T, Ofulla A. 2012. Water hyacinth Eichhornia crassipes (Mart.) Solms-Laubach dynamics and succession in the Nyanza Gulf of Lake Victoria (East Africa): implications for water quality and biodiversity conservation. Scientific World J. 2012:1–10.
- Goshu G, Aynalem S. 2017. Problem overview of the Lake Tana basin. In: Social and ecological system dynamics. Cham: Springer; p. 9–23.
- Goshu G, Koelmans A, de Klein J. 2017. Water quality of Lake Tana basin, Upper Blue Nile, Ethiopia. A review of available data. Social Ecol Sys Dyn. 1(1):127–141.
- Govaerts B, Verhulst N. 2010. The normalized difference vegetation index (NDVI) Greenseeker (TM) handheld sensor: toward the integrated evaluation of crop management part A: concepts and case studies. In: CIMMYT.
- Güereña D, Neufeldt H, Berazneva J, Duby S. 2015. Water hyacinth control in Lake Victoria: transforming an ecological catastrophe into economic, social, and environmental benefits. Sustain Prod Consump. 3:59–69.
- Habtamu K. 2015. Invasive Alien Weed Species Impacts on Biodiversity and Socio-Economic Aspect in Ethiopia: A Review. International Journal of Science and Research. 4(10):2179–2185.
- Hill MP, Coetzee J. 2017. The biological control of aquatic weeds in South Africa: current status and future challenges. Bothalia-Afr Biodivers Conserv. 47(2):1–12.
- Holzmann P. 2008. Household Economy Approach, the Bk: A Guide for Programme Planners and Policy-Makers: Save the Children UK.
- Islam R, Siwar C. 2012. Characterization of hazards, vulnerability and risk of disaster management. Adv Environ Biol. 6(3):955–966.
- Jana H. 2015. Water Hyacinth: A serious threat to agriculture.
- Jiménez MM. 2003. Progress on water hyacinth (Eichhornia crassipes) management.
- Kebedew MG, Kibret AA, Tilahun SA, Belete MA, Zimale FA, Steenhuis T. 2020. The relationship of lake morphometry and phosphorus dynamics of a tropical highland lake: Lake Tana, Ethiopia. Water. 12(8):2243.
- Kibret S, Worqlul A. 2018. Analysis: why Ethiopia is unable to control water hyacinth from Lake Tana and what to do about it?, Addis Standard magazine. October. 31:2018.
- Kuc G, Chormański J. 2019. Sentinel-2 imagery for mapping and monitoring imperviousness in urban areas. Int Arch Photogram Remote Sens Spatial Inf Sci. 42(1/W2):43–47.
- Kumar V, Singh J, Kumar P, Kumar P. 2019. Response surface methodology based electro-kinetic modeling of biological and chemical oxygen demand removal from sugar mill effluent by water hyacinth (Eichhornia crassipes) in a continuous stirred tank reactor (CSTR). Environ Technol Innov. 14:100327.
- Kumar V, Singh J, Nadeem M, Kumar P, Pathak V. 2020. Experimental and kinetics studies for biogas production using water hyacinth (Eichhornia crassipes [Mart.] Solms) and sugar mill effluent. Waste Biomass Valorization. 11(1):109–119.
- Landis JR, Koch GG. 1977. The measurement of observer agreement for categorical data. Biometrics. 33:159–174.
- Lawrence M, Holzmann P, O’Donnell M, Adams L, Holt J. 2007. The Practitioners’ Guide to the Household Economy Approach. RHVP, FEG and Save the Children-UK, London.
- Lemma H, Frankl A, Dessie M, Poesen J, Adgo E, Nyssen J. 2020. Consolidated sediment budget of Lake Tana, Ethiopia (2012–2016). Geomorphology. 371:107434.
- Li F, He X, Srishti A, Song S, Tan HTW, Sweeney DJ, Ghosh S, Wang C-H. 2021. Water hyacinth for energy and environmental applications: a review. Bioresour Technol. 327:124809.
- Madsen JD. 1993. Biomass techniques for monitoring and assessing control of aquatic vegetation. Lake Reservoir Manag. 7(2):141–154.
- Makhanu K. 1997. Impact of water hyacinth on Lake Victoria, 23rd WEDC Conference, Water and sanitation for all: partnerships and innovations.
- Mengistu BB, Unbushe D. 2017. Invasion of Water Hyacinth (Eichhornia crassipes) Is Associated with Decline in Macrophyte Biodiversity in an Ethiopian Rift-Valley Lake-Abaya. Open Journal of Ecology. 7(13):667–681.
- Mund J-P, Murach D, Parplies A. 2014. Monitoring and quantification of floating biomass on tropical water bodies. Geospatial Innov Soc. 67–76.
- Mundt F. 2011. Wetlands around Lake Tana: a landscape and avifaunistic study. Preliminary research finding of a master thesis, Greifswald University, Germany.
- Patel S. 2012. Threats, management and envisaged utilizations of aquatic weed Eichhornia crassipes: an overview. Rev Environ Sci Bio/Technol. 11(3):249–259.
- Pin LA, Pennink BJ, Balsters H, Sianipar C. 2021. Technological appropriateness of biomass production in rural settings: addressing water hyacinths (E. crassipes) problem in Lake Tondano, Indonesia. Technol Soc. 66:101658.
- Practical Action. 2006. Water hyacinth control and possible uses. Technical Brief, The Schumacher Centre for Technical Development, UK.
- Prasad R, Sharma D, Yadav KD, Ibrahim H. 2021. Preliminary study on greywater treatment using water hyacinth. Appl Water Sci. 11(6):1–8.
- Rakotoarisoa TF, Waeber PO, Richter T, Mantilla-Contreras J. 2015. Water hyacinth (Eichhornia crassipes), any opportunities for the Alaotra wetlands and livelihoods? Madagascar Conserv Dev. 10(3):128–136.
- Richards JA. 1995. Remote sensing digital image analysis:An introduction. Berlin: Springer-Verlag; p. 265–290.
- Robles W, Madsen JD, Wersal RM. 2015. Estimating the biomass of water hyacinth (Eichhornia crassipes) using the normalized difference vegetation index derived from simulated Landsat 5 TM. Invasive Plant Sci Manage. 8(2):203–211.
- Saleh H. 2016. Biological remediation of hazardous pollutants using water hyacinth - a review. J Biotechnol Res. 2(11):80–91.
- Setegn SG, Srinivasan R, Dargahi B, Melesse AM. 2009. Spatial delineation of soil erosion vulnerability in the Lake Tana Basin, Ethiopia. Hydrol Processes Int J. 23(26):3738–3750.
- Shiferaw W, Demissew S, Bekele T. 2018. Invasive alien plant species in Ethiopia: ecological impacts on biodiversity a review paper. Int J Mol Biol. 3:169–176.
- Sierra-Carmona CG, Hernández-Orduña MG, Murrieta-Galindo R. 2022. Alternative uses of water hyacinth (Pontederia crassipes) from a sustainable perspective: a systematic literature review. Sustainability. 14(7):3931.
- Tewabe D. 2015. Preliminary survey of water hyacinth in Lake Tana, Ethiopia. Global J Allergy. 1(1):013–018.
- Tewabe D, Asmare E, Zelalem W, Mohamed B. 2017. Identification of impacts, some biology of water hyacinth (Eichhornia crassipes) and its management options in Lake Tana, Ethiopia. Net J Agric Sci. 5(1):8–15.
- Tham HT. 2012. Water hyacinth (Eichhornia crassipes) Vol. 2012.
- Thamaga KH, Dube T. 2018. Remote sensing of the spatio-temporal distribution of invasive water hyacinth (Eichhornia crassipes) in the Greater Letaba River System in Tzaneen, South Africa.
- Timmer C, Weldon LW. 1967. Evapotranspiration and pollution of water by water hyacinth. Hyacinth Control J. 6:34–37.
- UNEP. 2013. Water hyacinth: Can its aggressive invasion be controlled?
- UNESCO. 2015. Ecological Sciences for Sustainable Development. http://www.unesco.org/new/en/natural-sciences/environment/ecological-sciences/biosphere-reserves/africa/ethiopia/lake-tana/.
- UNISDR. 2004. Living with risk. United Nation International Strategy for Disaster Reduction, United Nation-International Strategy for Disaster Risk Reduction.
- Van Niekerk D. 2011. Introduction to disaster risk reduction. USAID Disaster Risk Reduction Training Course for Southern Africa.
- Venugopal G. 1998. Monitoring the effects of biological control of water hyacinths using remotely sensed data: a case study of Bangalore, India. Singap J Trop Geogr. 19(1):91–105.
- Vijverberg J, Sibbing FA, Dejen E. 2009. Lake tana: source of the blue Nile. In: The Nile. Dordrecht: Springer; p. 163–192.
- Wassie A, Minwuyelet M, Ayalew W, Dereje T, Woldegebrael W, Addisalem A, Wondie E. 2014. Water hyacinth coverage survey report on Lake Tana.
- Young KE, Schrader TS. 2014. Predicting risk of invasive species occurrence—remote-sensing strategies. Early Detect Invasive Plants Principles Practices. 55:59–77.
- Yu H, Dong X, Yu D, Liu C, Fan S. 2019. Effects of eutrophication and different water levels on overwintering of eichhornia crassipes at the northern margin of its distribution in China. Front Plant Sci. 10:1–11.
Appendices
Annex 1. Confusion matrix for land cover map of 2021 wet season in percentage.
Annex 2. Confusion matrix for the land cover map of 2021 dry season in percentage.